| INVESTIGATION
A Reassessment of Genes Modulating Aging in Mice
Using Demographic Measurements of the Rate
of Aging
João Pedro de Magalhães,1Louise Thompson, Izabella de Lima, Dale Gaskill, Xiaoyu Li, Daniel Thornton, Chenhao Yang, and Daniel Palmer Integrative Genomics of Ageing Group, Institute of Ageing and Chronic Disease, University of Liverpool, L7 8TX, United Kingdom ORCID ID: 0000-0002-6363-2465 (J.P.d.M.)
ABSTRACT Many studies have reported genetic interventions that have an effect on mouse life span; however, it is crucial to discriminate between manipulations of aging and aging-independent causes of life extension. Here, we used the Gompertz equation to determine whether previously reported aging-related mouse genes statistically affect the demographic rate of aging. Of 30 genetic manipulations previously reported to extend life span, for only two we found evidence of retarding demographic aging: Cisd2and
hMTH1. Of 24 genetic manipulations reported to shorten life span and induce premature aging features, we found evidence offive accelerating demographic aging:Casp2,Fn1,IKK-b,JunD, andStub1. Overall, our reassessment found that only 15% of the genetic manipulations analyzed significantly affected the demographic rate of aging as predicted, suggesting that a relatively small proportion of interventions affecting longevity do so by regulating the rate of aging. By contrast, genetic manipulations affecting longevity tend to impact on aging-independent mortality. Our meta-analysis of multiple mouse longevity studies also reveals substantial variation in the controls used across experiments, suggesting that a short life span of controls is a potential source of bias. Overall, the present work leads to a reassessment of genes affecting the aging process in mice, with broad implications for our understanding of the genetics of mammalian aging and which genes may be more promising targets for drug discovery.
KEYWORDSlongevity; meta-analysis; hazard rate; progeria; survival;Mus musculus
T
HE discovery that single-gene manipulations can signifi -cantly modulate longevity is arguably the major break-through in biogerontology thus far (Kenyon 2010). Genetic manipulations of aging in mice are crucial to gather insights into the underlying mechanisms of aging (de Magalhães and Faragher 2008), to discover pathways modulating longevity (Fernandeset al.2016), and to identify candidate genes for drug discovery (de Magalhãeset al.2012; Barardoet al.2017).Moreover, the manipulation of the aging process in mamma-lian models (particularly mice) via genetic manipulation (gene knockouts, over expression,etc.) is crucial to test mechanistic hypotheses of aging (de Magalhães 2005). However, determin-ing if such genetic interventions actually affect the agdetermin-ing pro-cess and not some other factor(s) of health is not always straight forward. For example, should a genetic intervention reduce an organism’s resistance to disease, this could conceiv-ably reduce the life span of the organism, although the rate of aging would not have been affected. Differentiating between genetic interventions that affect the life span of an organism through altered health as opposed to changes in the rate of aging is therefore essential to gain insights on aging and de-termine interventions with wide-ranging effects (Hayflick 2000; de Magalhãeset al.2005).
There are two fundamental methods to determine if a life-extending genetic intervention has altered the rate of aging rather than general health. One can track the onset and pro-gression of age-related ailments and physiological degeneration Copyright © 2018 de Magalhãeset al.
doi:https://doi.org/10.1534/genetics.118.300821
Manuscript received November 3, 2017; accepted for publication February 7, 2018; published Early Online February 14, 2018.
Available freely online through the author-supported open access option.
This is an open-access article distributed under the terms of the Creative Commons Attribution 4.0 International License (http://creativecommons.org/licenses/by/4.0/), which permits unrestricted use, distribution, and reproduction in any medium, provided the original work is properly cited.
Supplemental material is available online atwww.genetics.org/lookup/suppl/doi:10. 1534/genetics.118.300821/-/DC1.
to determine if there is a shift in the onset and progression of the ailments. In addition, efforts have been made to quantify aging rates with mathematical models. The Gompertz law of mortality:
RmðtÞ¼R0eat;
where Rm(t) is the hazard or mortality rate (likelihood of death at any time),tis age,R0is the age-independent mor-tality component, andais the age-specific exponential coeffi -cient, describes how the hazard rate increases exponentially with age (Finch and Pike 1996). From the Gompertz param-eters, the mortality rate doubling time (MRDT) can be calcu-lated. As defined by Finch (1990), the MRDT is the amount of time it takes for the mortality rate to double for a given cohort. A change in MRDT indicates a change in the demographic rate of aging, which is not a perfect reflection of biological aging but a metric that correlates with physiological deterioration and health (Finch 1990; de Magalhãeset al.2005). Although some mouse studies have investigated MRDT (Hinkalet al. 2009; Lapointeet al.2009), many authors still often assume that changes in the life span of mice following a genetic interven-tion directly equate to changes in the rate of aging, leading to the misrepresentation of certain genes as having a causal role in aging, when in reality they do not.
Many studies have reported altered median and/or max-imum life span as a result of an intervention, but life span alterations may have a number of causes, including altered age at onset of senescence and age-independent mortality (Pletcheret al.2000). To address this lack of distinction, we previously used linear regression tofit the Gompertz model to longevity data from published mouse studies, and statisti-cally compared the rates of aging in these cohorts (de Magalhães
et al. 2005). For example, we showed that caloric restric-tion increases the MRDT and thus retards the demographic rate of aging (de Magalhães et al. 2005). Here, the same methodology was employed to reassess mouse longevity data published since 2005 and to identify which genes are more important in determining the demographic rate of aging. Lastly, we perform a meta-analysis combining the data from the present study and from our 2005 analysis to investigate patterns in how longevity changes correlate with changes in demographic rates of aging.
Methods
Data selection and extraction
Studies published since 2005 were selected since studies pub-lished up to 2005 were analyzed previously (de Magalhães
et al.2005). Genes were selected from the GenAge database, build 17 (Tacutuet al.2013). GenAge already excludes genes extending life span in short-lived (or disease) mutants or con-ditions. In addition, some genes were excluded as they could not be studied for demographic parameters (some genes could not be properlyfitted to the Gompertz model and some studies lacked full life span data, while other studies lacked sufficient
cohort size). A total of 54 genetic manipulations could be properly analyzed (primarily single-gene manipulations but also some manipulations involving more than one gene): 30 genetic manipulations that extended mouse life span (Ta-ble 1) and 24 genetic manipulations that reduced life span (Table 2).
Mortality data were extracted from published studies. WebPlotDigitizer, an online graph digitizer application (https://automeris.io/WebPlotDigitizer/), was used to ex-tract raw data from survival graphs in some cases. The digital imaging software package PaintShop Pro X3 (Corel Corporation, Ottawa, Canada) was used to extract age-specific survival data from published survivorship graphs (usually in the form of Kaplan–Meier survivorship curves). Percent survival was extracted at regular time intervals over the linear phase of these plots. Interval length was selected for each study individually to maximize the number of consecutive time points analyzed within this exponential phase.
Demographic analysis
The same methods and computer programs for the data gathering and analysis of de Magalhães et al.(2005) were used. Once the mortality data were collected, the age-specific mortality (qx) was calculated as the number of mice alive (T1) at the beginning of a given time interval minus the number of mice alive (T2) at the end of that same time interval divided byT1(i.e.,ðT12T2Þ=T1 = qx). The hazard rate (hz) for each
individual time interval was calculated as hz =
ðT12T2Þ=ððT1þT2Þ=2Þor the number of animals dying in the interval divided by the average number of individuals alive in the interval. The aging rate was then calculated through use of the Gompertz equation:Rm(t)= R0eat; where
Rm(t)is the chance of dying (the hazard rate) at aget,R0is the nonexponential factor in mortality, andais the exponential parameter (Finch et al. 1990). The Gompertz model was used because, as de Magalhães et al.(2005) asserted, the sample size (number of mice) in the majority of these ex-periments was small, meaning that other logarithmic meth-ods offitting models to mortality data may not provide the accuracy that the Gompertz model gives while retaining its simplicity. This point held true for the majority of genetic interventions tested herein and so it was decided that use of the Gompertz model remained a viable option for this anal-ysis. From the Gompertz model, the weighted regression line (weighted by the number of animals dying at each in-terval) was calculated byln(Rm(t)) = ln(R0) +at, which will also give the MRDT as 0:693=a:To compareabetween a given genetic intervention cohort and wild-type (WT) mice from the same lineage, a “dummy variables” test was employed as described (de Magalhãeset al.2005). As in de Magalhãeset al.(2005), the aim of this research was not to
Table 1 Mortality and life span statistics of genetically altered mouse strains with extended life span
Gene or protein Type Strain Gender n t50(yr) tmax(yr) Reference
Adcy5 WT 129/SvJ-C57BL/6 M & F 25 2.08 2.75 Yanet al.(2007)
2/2 M & F 13 2.75 3.08
Agrt1a WT C57BL/63129/SvEv M 10 2.08 2.41 Benigniet al.(2009)
2/2 M 20 2.63 3.00
Arf/p53 WT C57BL/6J 111 2.31 3.30 Matheuet al.(2007)
s-Arf/p53 25 2.63 3.03
Atg5 WT C57BL/6 65 1.93 2.14 Pyoet al.(2013)
Atg5-Tg 70 2.26 2.52
BubR1 WT C57BL/6-SV129 M:30 60 1.72 2.9 Bakeret al.(2013)
F: 30
mBubR1-Tg M:29 57 2.02 3.42
F:28
Cat WT 4033 M & F 44 2.16 2.83 Schrineret al.(2005)
MCAT 4033 M & F 20 2.58 3.10
WT 4403 M & F 58 2.18 3.06
MCAT 4403 M & F 42 2.60 3.33
Cisd2 WT (M) C57BL/6 M 40 2.25 2.90 Wuet al.(2012)
Cisd2-Tg (M) M 34 2.69 3.07
WT (F) F 25 2.27 2.50
Cisd2-Tg (F) F 21 2.74 3.25
Clk-1 WT 129Sv/J F 12 2.01 2.30 Liuet al.(2005)
+/2 F 10 2.34 2.54
Dgat1 WT C57BL/6J F 30 2.04 2.81 Streeperet al.(2012)
2/2 F 30 2.58 3.05
Esp8 WT C57BL/6 M:13 29 1.74 2.72 Tocchettiet al.(2010)
F:16
2/2 M:20 39 2.16 3.00
F:19
FGF21 WT C57Bl/6J M:32 67 2.34 3.56 Zhanget al.(2012)
F:35
FGF21-Tg M:37 77 3.18 NR (.3.65)
F:40
Ghrh WT C57BL/6 M:56 108 1.75 3.20 Sunet al.(2013)
3129SV F:52
KO M:39 97 2.55 3.58
F:58
Gpx4 WT C57BL/6 50 2.63 3.34 Ranet al.(2007)
+/– 50 2.83 3.17
hMTH1 WT C57BL/6 M 42 2.17 2.64 De Lucaet al.(2013)
hMTH1-Tg M 34 2.51 3.21
Htt WT 129/Sv- M:1 15 2.34 2.93 Zhenget al.(2010)
F:14
DQ/DQ M:2 15 2.76 3.43
F:13
Igf1 WT FVB M 39 1.97 3.17 Li and Ren (2007)
Igf1-Tg M 38 2.43 3.42
IkB-a MBH-GFP C57BL/6 23 2.41 2.91 Zhanget al.(2013)
MBH-IkB-a 31 2.64 3.09
Irs1 WT (F) C57BL/6 F 21 2.02 2.86 Selmanet al.(2009)
2/2(F) F 14 2.66 3.61
Irs2 WT C57BL/6J M:21 93 2.36 2.86 Taguchiet al.(2007)
F:30
Brain-specific +/2 M:27 65 2.81 3.34
F:60
Mif WT C57BL/6J3129/SvJ F 24 2.01 2.70 Harperet al.(2010)
2/2 F 39 2.45 3.51
mTOR WT 1293C57BL/6 M & F 34 2.13 3.14 Wuet al.(2013)
KO M & F 43 2.51 3.14
Myc WT (F) C57BL/6 F 37 2.23 2.86 Hofmannet al.(2015)
+/2(F) F 39 2.68 3.58
WT (M) M 42 2.41 3.00
+/2(M) M 42 2.66 3.26
rate of aging. Consequently, the simpler, nested Gompertz model was preferred (de Magalhães et al.2005). Besides, data were only analyzed from the onset of the exponential increase in mortality, though typically , 10% of animals were left out.
Statistical analysis
A “dummy variables” method was used to compare the
slopes of the hazard functions obtained through linear regression for the WT and test cohorts and a two-tailed Student’s t-test was applied to evaluate whether they were significantly different (P,0.05). Analysis was per-formed in SPSS version 22 (IBM) using our previous scripts (de Magalhães et al. 2005) (code available in the supplemental material and athttp://genomics.senescence.info/ software/demographic.html).
Data availability
The survival data used in this study is provided in the Sup-plemental Material, Tables S1 and S2 inFile S1. The SPSS code used is provided inFile S2.
Results
The Gompertz law of mortality describes the exponential in-crease in mortality rate with age. Modified versions of this function exist to model mortality deceleration observed at very young and very old ages; however, the simplest form was chosen tofit the mouse survivorship data in this study because the mouse
cohorts are often small (n,50). The basic Gompertz model is described by only two parameters, so is more suitable forfitting data from smaller sample sizes (Pletcher 2002) and increases the ease of comparing aging rates between cohorts. Since mouse longevity data are largely presented in publications as Kaplan– Meier survival curves, the life spans were divided into discrete time intervals and then linear regression was used to calculate age-specific mortality rates for each interval (seeMethods). This allowed an estimation of Gompertz parameters for each cohort that could be directly compared.
In this study, 54 previously published genetic manipula-tions that have been associated with alteramanipula-tions in mouse life span were analyzed; 30 manipulations previously reported as having a life span-extending effect (Table 1) and 24 that were previously reported as having a life span-reducing effect (Table 2). The aim of this study was to reassess genes that have been reported to regulate longevity in mice to ascer-tain which of them might exert this effect through regulat-ing the rate of agregulat-ing.
Analysis of life-extending gene manipulations
Of the 30 genetic manipulations previously reported as having life span-increasing effects, we found 13 genes to have a statistically significant effect on the demographic rate of aging (Table 3):BubR1,Cisd2,Dgat1,Fgf21,Ghrh,Gpx4,
hMTH1,Irs2,mTOR,Sirt1,Slc13a1,Surf1, andTert. How-ever, surprisingly only two of these genes (Cisd2andhMTH1) retarded the demographic rate of aging. Full survival data are provided in the supplemental material (Table S1 inFile S1).
Table 1,continued
Gene or protein Type Strain Gender n t50(yr) tmax(yr) Reference
PAPP-A WT C57BL63129SV/E M & F 21 1.84 2.44 Conover and Bale (2007)
2/2 M & F 20 2.64 3.11
Pten WT C57BL/6 M:49 112 2.17 2.92 Ortega-Molinaet al.(2012)
3CBA F:63
Pten-Tg M:32 64 2.44 3.21
F:32
RpS6K1 WT C57BL/6 M:26 49 2.23 3.00 Selmanet al.(2009)
F:23
2/2 M:19 48 2.64 3.40
F:29
RIIb WT C57BL/6 (males) M 20 2.42 2.79 Ennset al.(2009)
RIIB2/2 M 20 2.75 3.07
Sirt1 WT C57BL/6 M & F 31 2.30 3.01 Satohet al.(2013)
Brain-specific Tg M & F 34 2.56 3.11
Slc13a1 WT (M) C57BL/6J3129/SV M 21 1.93 2.60 Markovichet al.(2011)
Nas12/2(M) M 25 2.54 3.30
WT (F) F 34 1.68 2.50
Nas12/2(F) F 38 2.06 2.90
Surf1 WT BDF13cre M:23 48 1.78 NR Dell’agnelloet al.(2007)
F:25
2/2 M:21 43 2.17 2.48
F:22
Tert Sp53 C57BL/63DBA/2 M & F 68 2.13 3.09 Tomás-Lobaet al.(2008)
Sp53/TgTert M & F 56 2.36 3.22
Sp53/Sp16/SArf M & F 39 2.38 3.18
Sp53/Sp16/SArf/TgTert M & F 27 2.38 3.26
A few notable examples are worth emphasizing. Trans-genic expression ofCisd2in female mice produced persistent expression of the Cisd2 protein in contrast to levels in WT mice, which diminished with age (Wuet al.2012). Our
anal-ysis showed that this resulted in a nearly twofold higher MRDT compared to that of female WT controls, consistent with a difference between the Gompertz curve gradients (Figure 1A). This suggests thatCisd2regulates the demographic rate of
Table 2 Mortality and life span statistics of genetically altered mouse strains with shortened life span
Gene or protein Type Strain Gender n t50(yr) tmax(yr) Reference
Aag, Atm, Mgmt WT C57BL/6 M & F 37 2.03 2.87 Meiraet al.(2014)
Aag–/– M & F 29 1.80 2.50
Mgmt–/– M & F 50 1.92 2.77
Atm–/– M & F 19 0.56 1.37
Aag–/–Mgmt–/– M & F 31 1.67 2.71
ATR WT M & F 20 NR NR Murgaet al.(2009)
ATRs/s M & F 27 0.42 0.65
Brca1 WT 129O1a3C57BL/6J F 32 2.15 2.56 Jenget al.(2007)
+/2 F 26 1.94 2.53
Bub3 + Rae1 WT 129Sv/E3C57BL/6 N/A 70 2.08 NR Bakeret al.(2006)
+/2, +/2 N/A 100 1.84 NR
Casp2 WT C57BL/6 N/A 64 2.62 3.51 Zhanget al.(2007)
2/2 N/A 64 2.62 3.25
Cdc42 WT C57BL/6+/2129/Sv M & F 16 2.28 2.49 Wanget al.(2007)
2/2 M & F 21 1.09 2.50
Cisd2 WT C57BL/6 (B6) M & F 49 2.09 2.53 Chenet al.(2009)
Cisd22/2 M & F 16 1.28 2.15
Cisd2 WT C57BL/6 M 40 2.25 2.90 Wuet al.(2012)
+/– M 51 2.05 2.57
–/– M 27 1.76 2.32
WT F 25 2.27 2.50
+/– F 47 1.92 2.50
–/– F 49 1.83 2.94
DNA polb WT C57BL/6 M 60 2.54 3.19 Cabelofet al.(2006)
+/– M 67 2.54 3.19
Fgf-23 2/2 Sv129J M & F 15 0.12 0.26 Razzaqueet al.(2006)
Fn1 WT C57BL/6 M 39 2.43 NR Muroet al.(2003)
Fn1EDA2/2 M 53 1.93 NR
HtrA2/Omi mnd2/+;Tg C57BL/6J M & F 23 N/A N/A Kanget al.(2013)
mnd2/mnd2;Tg M & F 21 1.28 1.50
Htr1b WT N/A 21 2.58 3.14 Sibilleet al.(2007)
2/2 N/A 24 2.05 2.75
IKK-b MBH-GFP C57BL/6 M 23 2.41 2.91 Zhanget al.(2013)
N/Ikbkbl/l M 24 2.23 2.56
junD WT N/A M & F 35 1.91 2.41 Laurentet al.(2008)
JunD2/2 N/A M & F 35 1.66 2.17
Msh2 WT 129S/SvEvTac M & F 51 NR NR Weiet al.(2003)
2/2 M & F 32 0.58 0.92
Pasg 2/2 129/SvJ/C57BL/6J N/A 63 0.01 0.07 Sunet al.(2004)
Pparg WT F 25 2.35 2.68 Argmannet al.(2009)
Pparg22/2 F 26 2.14 2.62
Sirt7 WT C57Bl/63129Sv M 98 NR NR Vakhrushevaet al.(2008)
2/2 M 32 0.74 1.60
Socs2 WT C57BL/6J3FVB M & F 123 2.10 3.00 Casellas and Medrano (2008)
hg/hg M & F 146 1.33 2.59
Stub1 WT C57BL/63129SvEv M:82 82 2.08 NR Minet al.(2008)
F:84
2/2 M:58 128 0.89 NR
F:45
Trp63 WT K5CrePR1 NR 74 2.23 3.00 Keyeset al.(2005)
+/2 NR 104 1.74 2.25
Xrcc5 WT NR 47 2.04 2.40 Vogelet al.(1999)
Ku862/2 NR 89 0.79 1.75
Xrcc6 WT M & F 27 2.17 2.80 Liet al.(2007)
Ku702/2 M & F 43 0.69 1.45
Table 3 Gompertz parameters for genetically altered mouse strains with extended life span from a regression line calculated byln(Rm(t)) =
ln(R0) +at(seeMethods)
Gene or
protein Type Strain a aSE ln(R0) r2 MRDT (yr)
Adcy5 WT 129/SvJ-C57BL/6 3.87 0.94 29.61 0.71 0.18
2/2 5.95 0.34 217.20 0.97 0.12
Agrt1a WT C57BL/63129/SvEv 5.20 1.21 211.15 0.86 0.13
2/2 3.95 1.30 210.81 0.70 0.18
Arf/p53 WT C57BL/6J 2.88 0.32 27.59 0.94 0.24
s-Arf/p53 2.80 0.44 28.05 0.86 0.25
Atg5 WT C57BL/6 7.30 5.48 214.40 0.47 0.10
Atg5-Tg 8.92 1.31 221.54 0.82 0.08
BubR1a WT C57BL/6-SV129 1.62 0.16 25.42 0.92 0.43
mBubR1-Tg 2.61 0.097 27.48 0.93 0.27
Cat WT 4033 2.30 0.18 26.40 0.81 0.30
MCAT C57BL/6J 3.00 0.59 28.80 0.68 0.23
WT 4403 2.00 0.21 25.93 0.62 0.35
MCAT 2.20 0.20 27.41 0.78 0.32
Cisd2a WT male C57BL/6 7.67 2.86 217.79 0.71 0.09
Cisd2-Tg male 6.96 1.84 219.39 0.83 0.10
WT female 6.62 2.27 214.43 0.90 0.10
Cisd2-Tg female 2.40 0.59 27.10 0.74 0.29
Clk-1 WT 129Sv/J 3.09 0.64 26.05 0.89 0.22
+/2 2.49 0.92 25.95 0.64 0.28
Dgat1a WT C57BL/6J 1.92 0.53 25.12 0.66 0.36
2/2 3.56 0.20 29.63 0.99 0.19
Esp8 WT C57BL/6 1.50 0.22 23.70 0.73 0.46
2/2 1.98 0.18 25.15 0.81 0.35
FGF21a WT C57Bl/6J 1.82 0.35 25.66 0.82 0.38
FGF21-Tg 2.04 0.40 27.89 0.87 0.34
Ghrha WT C57BL/63129SV 1.31 0.18 23.55 0.90 0.53
KO 1.53 0.17 25.12 0.94 0.45
Gpx4a WT C57BL/6 3.11 1.08 29.18 0.73 0.22
+/– 5.43 0.72 215.77 0.95 0.13
hMTH1a WT C57BL/6 3.50 0.65 28.78 0.81 0.20
hMTH1-Tg 2.29 0.47 26.91 0.72 0.30
Htt WT 129/Sv- 2.30 1.01 26.03 0.56 0.30
DQ /DQ 1.80 0.51 25.19 0.81 0.39
Igf1 WT FVB 1.06 0.26 23.02 0.74 0.65
Igf1 1.35 0.25 24.43 0.77 0.51
IkB-a MBH-GFP C57BL/6 4.15 0.74 210.75 0.65 0.17
MBH-DN IB-a 4.43 0.76 212.86 0.62 0.16
Irs1 WT (female) C57BL/6 2.18 0.26 25.00 0.80 0.32
2/2(female) 1.94 0.31 26.45 0.71 0.36
Irs2a WT C57BL/6J 2.99 0.13 27.29 0.87 0.23
Brain-specific +/2 6.37 0.33 217.73 0.85 0.11
Mif WT C57BL/6J3129/SvJ 2.45 0.40 26.08 0.84 0.28
2/2 1.90 0.31 26.02 0.82 0.37
mTORa WT 1293C57BL/6 1.47 0.45 24.46 0.68 0.47
KO 2.41 0.15 26.94 0.98 0.29
Myc WT female C57BL/6 2.19 0.55 25.88 0.76 0.32
+/–female 3.19 1.05 29.64 0.70 0.22
WT male 2.53 0.21 27.06 0.96 0.27
+/–male 2.55 0.36 27.75 0.90 0.27
PAPP-A WT C57BL63129SV/E 2.33 0.35 25.28 0.71 0.30
2/2 2.67 0.32 27.39 0.80 0.26
Pten WT C57BL/63CBA 2.33 0.14 25.83 0.97 0.30
Pten-Tg 2.52 0.24 27.07 0.95 0.27
RpS6K1 WT C57BL/6 1.81 0.069 24.64 0.93 0.38
2/2 1.73 0.056 25.30 0.91 0.40
RIIb WT C57BL/6 (males) 3.00 0.31 27.68 0.85 0.23
RIIB2/2 3.55 0.34 210.09 0.88 0.20
Sirt1a WT C57BL/6 2.45 0.49 27.20 0.81 0.28
Brain-specific Tg 3.63 0.63 210.71 0.83 0.19
aging. However, the nature of the role ofCisd2in aging is con-fused by the fact that reduced expression ofCisd2in heterozy-gous and double-knockout female mice from the same study also resulted in a significantly increased MRDT (see Table 4), sug-gesting that reduced Cisd2expression also slowed the demo-graphic rate of aging.
Most genes examined did not impact on MRDT, and a few even reduced the MRDT. Of note, regarding Sirt1, a 33% reduction in MRDT was observed for transgenic mice with brain-specific overexpression of this gene. This is supported by a visible change in the slope of the Gompertz curve (Fig-ure 1B). It therefore appears that the increases in median and maximum life span reported (Satohet al.2013) are not mediated by a decrease in the rate of aging. Instead, it ap-pears that the longevity extension in this cohort occurred through delayed onset of the exponential increase in mor-tality rate. Likewise, mice constitutively overexpressing both the tumor suppressorp53and telomerase reverse tran-scriptase (Tert) exhibited enhanced 3-year survival rates compared to super-p53 mice expressing only the additional transgenic copy ofp53(Tomás-Lobaet al.2008). Interest-ingly, our analysis indicates that the MRDT of the former cohort was modestly reduced by 18% compared to that of the control mice, which suggests that the life-extending ef-fect ofTertoverexpression is due to a reducedR0rather than to a slower demographic rate of aging. By contrast, mice overexpressing Tertin addition top16, Arf, and p53 have a higher MRDT, although this difference was not statisti-cally significant (Table 3).
Analysis of genes reported to reduce life span and/or accelerate aging
Interventions that reduce life span by increasing the rate of aging would be expected to reduce the MRDT. Of the 24 genes previously reported as having life span-reducing effects, we found 15 to have a statistically significant effect on the de-mographic rate of aging (Table 4):Aag/Atm/Mgmt,Casp2,
Cisd2 (23 studies), Cdc42GAP, Fn1, Htr1b, IKK-b, JunD,
Pparg,Socs2, Stub1, Trp63,Xrcc5, andXrcc6. Five of these (Casp2,Fn1,IKK-b,JunD, andStub1) accelerated demographic
aging. Full survival data are provided in the supplemental ma-terial (Table S2 inFile S1).
As before, a few notable examples are worth highlighting. Mice carrying a double knockout ofCasp2exhibited a 54% lower MRDT than WT littermates (Figure 2A). Therefore, as initially reported by Zhanget al.(2007),Casp2accelerates the rate of aging in mice. Zhanget al.(2007) used several methods including a thorough detailing of the progression of age-related ailments (such as gradual hair and increased bone loss) to detail the rate of aging of theCasp2knockout and their WT littermates, and our new research (using statistical demographic methods) has drawn the same conclusions.
Another gene manipulation that significantly reduced MRDT involved IkB kinase-b(IKK-b), which is involved in the activation of NF-kB. NF-kB activity in the hypothalamus of mice increases with age and mice expressing constitutively active IKK-b in the mediobasal hypothalamus (MBH) ex-hibited shortened life spans (Zhanget al.2013). The MRDT for MBH-IKK-bmice was reduced by 21% compared to that of control mice. Thefitted Gompertz curves showed an in-creased gradient (Figure 2B), providing evidence that activated hypothalamic NF-kB promotes faster aging. As the authors note, this is interesting because it suggests that a single organ, the hypothalamus, is important in regulating aging of the whole animal.
As in life-extending interventions, most genes did not impact on MRDT and some even had an opposite effect than expected. For example,Xrcc62/2(also known asKu702/2) mice had shortened life spans compared to WT controls (Li
et al.2007). Fitting the survival data from this study produced mortality curves with visibly different starting ages (Figure 2C) and the MRDT of theXrcc62/2mice was 38% larger than that of the WT cohort. This points to a slower demographic rate of aging in theXrcc62/2mice. It should be noted that animals that died in the first 3 weeks were censored in the original study because Kumutant mice frequently do not survive to weaning age. Including these animals would have altered the survival plots and might therefore have impacted on the outcome of this analysis.
Table 3,continued
Gene or
protein Type Strain a aSE ln(R0) r2 MRDT (yr)
Slc13a1a WT (male) C57BL/6J3129/SV 1.79 0.37 24.34 0.83 0.39
Nas12/2(male) 1.70 0.47 25.02 0.72 0.41
WT (female) 0.87 0.13 22.95 0.86 0.80
Nas12/2(female) 1.69 0.29 24.31 0.85 0.41
Surf1a WT BDF13cre 2.19 0.39 24.81 0.86 0.32
2/2 3.41 0.47 27.82 0.96 0.20
TgTerta Sp53 C57BL/63DBA/2 2.74 0.33 26.51 0.95 0.25
Sp53a/TgTert 3.34 0.41 28.14 0.94 0.21
Sp53/Sp16/SArf 1.47 0.58 24.86 0.52 0.47
Sp53/Sp16/SArf/TgTert 2.08 0.65 27.24 0.77 0.33
a, age-specific exponential coefficient; ln(R0), nonexponential factor in mortality; MRDT, mortality rate doubling time as in 0:693=a;yr, year; WT, wild-type; Tg, transgenic; KO, knockout.
Finally, reassessment of the survival data of Htr1b2/2 mice showed that they have a 22% increased MRDT com-pared to WT controls. This can be seen as a slight difference in the slopes of the Gompertz curves (Figure 2D). Reduced longevity was reported in Htr1b2/2 mice (Sibille et al.
2007) and our results support the conclusion thatHtr1b
de-ficiency produces a significantly decreased demographic rate of aging; however, the cohorts used in this study were small (n= 21 for WT andn= 24 forHtr1b2/2). If we increase the period from which data were extracted for theHtr1b2/2mice and exclude outliers of the Gompertz curve, the difference in MRDT is no longer significant. This result highlights the differences that one can obtain in this type of analysis by changing subjective parameters, in particular for smaller cohorts.
Longevity effects are driven by aging-independent mortality
Looking at our data set as a whole (Table 1, Table 2, Table 3, and Table 4), it is clear that studies are highly variable. Of note, cohort size ranges from 10 to 146 animals. Moreover, while the SD of median life span (t50) was only 13% for life span-extending manipulations (range 1.68–3.18 years), for life span-reducing manipulations it was 39% (0.01–2.62 years range). For maximum life span (tmax), SD was 11% for life span-extending manipulations (range 2.14–3.61 years) and 33% (0.07–3.51 years range) for life span-reducing ma-nipulations. This is not surprising given that life-shortening manipulations can have greater effect sizes than life-extending manipulations, but it also introduces noise in demographic aging estimates, in particular for life span-shortening manipulations.
Even looking only at WT controls from the C57BL/6 strain (15 studies), the most common strain in our analysis, the range oft50was 1.74–2.63 years whiletmaxranged from 2.14 to 3.56. Whiletmaxis influenced by cohort size,
t50is not and, therefore, this substantial variation for WT mice of the same genetic background suggests that consid-erable variation is introduced by differences in animal
hus-bandry and stochastic factors. Relative SD foraand ln(R0) in C57BL/6 cohorts were, respectively, 57 and 42%.
We also investigated if, in life span-extending manipulations, there is a negative correlation between thet50of the controls and the life extension effects (measured as the percentaget50
increase in the experimental cohort). Indeed, there is a moder-ate (r2= 0.30) but statistically significant negative correlation (P-value = 0.002;n= 33), suggesting that effect sizes in lon-gevity experiments could be influenced by the short life span of the controls.
There was a strong negative correlation betweenaand ln(R0):
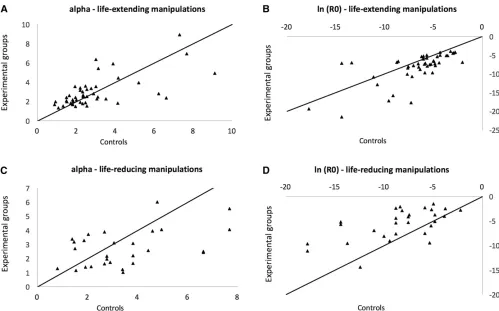
r2= 0.93 for life span-extending manipulations andr2= 0.53 (after removing Pasg, which is an outlier; see Table 4) for life span-reducing manipulations. As such, increases in aging-inde-pendent mortality tend to be accompanied by a slower demo-graphic aging rate, as observed before (de Magalhãeset al.2005). Combining earlier results (de Magalhãeset al.2005) with the current analysis allows greater power to evaluate the usefulness of demographic analysis in aging. Therefore, we employed a data set with 63 manipulations of longevity: 41 life span-extending plus 22 life span-reducing manipula-tions (note that for this analysis we excluded manipulamanipula-tions for which we lacked demographic aging parameters for con-trols, which resulted in the exclusion of six life-reducing inter-ventions from the previous analyses). Of note, we found that by and large an impact on longevity is caused by a change in the aging-independent mortality, which is observed both for life-extending (Figure 3, A and B) and life-reducing manipulations (Figure 3, C and D). And confirming the above-mentioned results, we observed that decreases in ln(R0) correlated with increases inafor life span-extending (r2= 0.64) and life span-reducing manipulations (r2= 0.64).
Discussion
The Gompertz function, used here tofit only the linear phase of the mortality trajectories, allowed for simple comparison
between studies as it is described by just two parameters. Although it has been found that more complex adaptations of the Gompertz function [e.g., the logistic model (Pletcher
et al.2000)] provide a betterfit for some whole-mortality
curves (de Magalhães et al. 2005; Yen et al. 2008), the sample sizes usually reported for mouse life span experi-ments are insufficiently large to apply these models with sufficient accuracy.
Table 4 Gompertz parameters for genetically altered mouse strains with shortened life span from a regression line calculated by
ln(Rm(t)) = ln(R0) +at(seeMethods)
Gene or protein Type Strain a aSE ln(R0) r2 MRDT (yr)
Aag, Atm, Mgmta WT C57BL/6 3.81 0.82 28.83 0.78 0.18
Aag–/–a 2.20 1.04 25.38 0.53 0.31
Mgmt–/– 3.08 0.50 27.65 0.86 0.23
Atm–/–a 2.21 1.03 22.39 0.48 0.31
Aag–/–Mgmt–/–a 1.66 0.41 24.38 0.65 0.42
ATR WT N/A N/A N/A N/A N/A N/A
ATRs/s 6.46 1.33 23.38 0.86 0.11
Brca1 WT 129O1a3C57BL/6J 4.59 0.36 210.01 0.98 0.15
+/2(female) 3.96 0.48 28.06 0.97 0.17
Bub3 + Rae1 WT 129Sv/E3C57BL/6 1.54 0.34 24.86 0.91 0.45
+/2, +/2 1.16 0.49 23.72 0.61 0.60
Casp2a WT C57BL/6 1.46 0.31 25.39 0.79 0.47
2/2 3.20 0.44 29.44 0.91 0.22
Cd42 GAPa WT C57BL/6+/2129/Sv 3.39 1.11 28.16 0.61 0.20
2/2 1.24 1.44 22.89 0.87 0.56
Cisd2a WT C57BL/6 (B6) 3.42 0.81 28.37 0.64 0.20
Cisd22/2 1.02 0.36 22.10 0.66 0.68
Cisd2a WT male C57BL/6 7.67 2.86 217.79 0.71 0.09
+/–malea 4.06 1.26 29.68 0.68 0.17
–/–male 5.56 1.11 211.06 0.86 0.12
WT female 6.62 2.27 214.43 0.90 0.10
+/–femalea 2.50 0.49 25.69 0.81 0.28
–/–femalea 2.44 0.40 25.16 0.84 0.28
DNA polb WT C57BL/6 3.06 0.59 29.42 0.79 0.23
+/– 3.11 0.65 29.11 0.82 0.22
Fgf-23 2/2 Sv129J 6.48 N/A 21.76 0.41 0.11
Fn1a WT C57BL/6 1.49 0.48 25.22 0.62 0.46
Fn1EDA2/2 2.73 0.56 26.01 0.82 0.25
Htr1ba WT 4.95 0.83 213.74 0.90 0.14
2/2 4.06 0.46 29.56 0.94 0.17
HtrA2/Omi mnd2/mnd2;Tg C57BL/6J N/A N/A N/A N/A N/A
mnd2/+;Tg 5.38 1.69 27.16 0.84 0.13
IKK-ba MBH-GFP C57BL/6 4.78 1.09 212.43 0.76 0.15
N/Ikbkbl/l 6.03 0.84 214.37 0.90 0.12
junDa WT N/A 2.67 0.77 25.85 0.75 0.26
JunD2/2 N/A 3.89 0.57 27.47 0.90 0.18
Msh2 WT 129S/SvEvTac N/A N/A N/A N/A N/A
2/2 1.69 N/A 22.69 0.26 0.41
Pasg 2/2 129/SvJ/C57BL/6J 64.15 N/A 22.55 0.75 0.01
Pparga WT 4.43 0.53 211.02 0.93 0.16
Pparg22/2 2.59 0.29 26.93 0.92 0.27
Sirt7 WT C57Bl/63129Sv N/A N/A N/A N/A N/A
2/2 2.16 22.01 0.71 0.32
Socs2a WT C57BL/6J3FVB 2.14 0.40 25.16 0.85 0.32
hg/hg 1.43 0.33 22.69 0.73 0.48
Stub1a WT C57BL/63129SvEv 0.80 0.40 23.78 0.44 0.87
2/2 1.31 0.44 22.46 0.59 0.53
Trp63a WT K5CrePR1 2.90 N/A 27.47 0.86 0.24
+/2 1.75 N/A 23.72 0.83 0.40
Xrcc5a WT 2.68 0.35 25.84 0.94 0.26
Ku862/2 1.63 0.38 22.34 0.70 0.43
Xrcc6a WT 1.92 0.30 24.98 0.89 0.36
Ku702/2 1.39 0.44 21.49 0.83 0.50
a, age-specific exponential coefficient; ln(R0), nonexponential factor in mortality; MRDT, mortality rate doubling time as in 0:693=a;yr, year; WT, wild-type; N/A, not applicable; Tg, transgenic.
Longevity is influenced by a number of factors, including age-independent mortality, age at the onset of senescence, and demographic rate of aging. In this study, we employed the Gompertz model to fit published mouse survival data and generate parameters that could be used to identify genes that influence the demographic rate of aging. Overall, only 7/54 genes were found to have a statistically significant effect on the demographic rate of aging as expected from longevity manipulations. These results suggest that only a relatively small proportion of interventions reported to affect longevity in mice do so through directly influencing the demographic rate of aging, in line with other, albeit smaller, studies (de Magalhães et al.2005; Yenet al.2008; Garrattet al.2016; Hughes and Hekimi 2016). Surprisingly, 20/54 genes had a statistically significant impact on the demographic rate of aging in the opposite direction than would be expected for the published longevity effects. One possible explanation is that many mutations impacted on various parameters affect-ing longevity in nonlinear ways, and indeed we observed that increases in aging-independent mortality correlated with a slower demographic aging rate. For instance,Sirt1deficiency extended life span but increased the demographic rate of aging; its effect appeared to be exerted instead by delaying the age of onset of mortality rate escalation. This highlights
the complex relationship between life span and the demo-graphic rate of aging. It is also possible that other confound-ing factors, like censored data or noise, in particular for smaller cohorts, influenced these results.
Another caveat of our approach concerns the number of mice used in some of the original studies, which ranged from 10 to 146 animals per cohort. While research reported here has attempted to compensate for this by using the Gompertz equation, which allows for small sample sizes, one cannot escape the low statistical power that accompanies such small sample sizes. Interestingly, caloric restriction has been shown to significantly retard the demographic rate of aging, but this was a large study with.200 animals in total (de Magalhães
et al.2005). Therefore, caution must be taken when interpret-ing some of the results detailed here from studies with small sample sizes. Indeed, we observed that, in smaller experimental cohorts, subjective decisions in estimating Gompertz parame-ters can significantly affect the results,e.g., forHtr1b2/2.
Potential caveats of our analysis include the subjectivity of deciding the time at which analysis should begin and problems in the reporting of mouse survival data. As reviewed in detail by Ladiges et al. (2009), mouse longevity studies should adhere to certain standards to provide useful data. These in-clude a sufficiently large cohort, high standards of
free animal husbandry to eliminate deaths from infectious disease, and separate reporting of male and female survival data. Unfortunately, life span data are often incompletely reported and, in many of the studies analyzed in this work, male and female data were not presented separately. Censor-ing of mice that died before a certain age in some studies may also have introduced noise into our results.
Our results provide insights regarding the role in aging of various genes. Of particular interest are thefindings concerning
Casp2andCisd2. We found thatCasp2deficiency increased the demographic rate of aging, which has not previously been pro-posed.Casp22/2mice had a similar median life span to WT and did not show elevated tumor incidence (Zhanget al.2007). Besides, our results indicate that persistent expression ofCisd2
significantly reduced the demographic rate of aging. Further investigation has since strengthened the case for Cisd2’s involvement in regulating the rate of aging by showing that it is involved in autophagy, mitochondrial function, and adipocyte differentiation (Wanget al.2014), showing that it may influence several pathways thought to be important for aging.
Conclusions
Overall, we performed a demographic analysis of 54 mouse studies in which genetic manipulations significantly extended
or reduced life span. We also combined our results with a previous report to perform an analysis of factors associated with longevity in mice. To our knowledge, this is the largest such study to date. Our main conclusions are: (1) most genetic manipulations of longevity in mice do so by modulating aging-independent mortality; (2) there is substantial variation in the life span of controls of the same strain across experiments; (3) studies in which the life span of the controls is short have a greater life span increase, emphasizing the importance of having adequate control groups; (4) mouse life span studies employing small cohorts can yield unreliable results; (5) life span-reducing experiments tend to be noisier and more difficult to analyze for demographic parameters than life-extending experiments; and (6) a greater aging-independent mortality is usually accompanied by a slower demographic aging rate.
Acknowledgments
GenAge is funded by a Wellcome Trust grant (104978/Z/ 14/Z) to J.P.d.M. Current work in our laboratory is also supported by the Leverhulme Trust and the Methuselah Foundation. L.T. was funded by a Wellcome Trust 4-year PhD studentship.
Literature Cited
Argmann, C., R. Dobrin, S. Heikkinen, A. Auburtin, L. Pouillyet al., 2009 Ppargamma2 is a key driver of longevity in the mouse. PLoS Genet. 5: e1000752. https://doi.org/10.1371/journal. pgen.1000752
Baker, D. J., K. B. Jeganathan, L. Malureanu, C. Perez-Terzic, A. Terzicet al., 2006 Early aging-associated phenotypes in Bub3/ Rae1 haploinsufficient mice. J. Cell Biol. 172: 529–540.https:// doi.org/10.1083/jcb.200507081
Baker, D. J., M. M. Dawlaty, T. Wijshake, K. B. Jeganathan, L. Malureanuet al., 2013 Increased expression of BubR1 protects against aneuploidy and cancer and extends healthy lifespan. Nat. Cell Biol. 15: 96–102.https://doi.org/10.1038/ncb2643
Barardo, D., D. Thornton, H. Thoppil, M. Walsh, S. Sharifi et al., 2017 The DrugAge database of aging-related drugs. Aging Cell 16: 594–597.https://doi.org/10.1111/acel.12585
Benigni, A., D. Corna, C. Zoja, A. Sonzogni, R. Latini et al., 2009 Disruption of the Ang II type 1 receptor promotes lon-gevity in mice. J. Clin. Invest. 119: 524–530.https://doi.org/ 10.1172/JCI36703
Cabelof, D. C., Y. Ikeno, A. Nyska, R. A. Busuttil, N. Anyangweet al., 2006 Haploinsufficiency in DNA polymerase beta increases can-cer risk with age and alters mortality rate. Cancan-cer Res. 66: 7460– 7465.https://doi.org/10.1158/0008-5472.CAN-06-1177
Casellas, J., and J. F. Medrano, 2008 Lack of Socs2 expression reduces lifespan in high-growth mice. Age (Dordr.) 30: 245– 249.https://doi.org/10.1007/s11357-008-9064-1
Chen, Y. F., C. H. Kao, Y. T. Chen, C. H. Wang, C. Y. Wu et al., 2009 Cisd2 deficiency drives premature aging and causes mi-tochondria-mediated defects in mice. Genes Dev. 23: 1183– 1194.https://doi.org/10.1101/gad.1779509
Conover, C. A., and L. K. Bale, 2007 Loss of pregnancy-associated plasma protein A extends lifespan in mice. Aging Cell 6: 727– 729.https://doi.org/10.1111/j.1474-9726.2007.00328.x
Dell’agnello, C., S. Leo, A. Agostino, G. Szabadkai, C. Tiveronet al., 2007 Increased longevity and refractoriness to Ca(2+)-depen-dent neurodegeneration in Surf1 knockout mice. Hum. Mol. Genet. 16: 431–444.https://doi.org/10.1093/hmg/ddl477
De Luca, G., I. Ventura, V. Sanghez, M. T. Russo, M. A. Ajmone-Cat et al., 2013 Prolonged lifespan with enhanced exploratory be-havior in mice overexpressing the oxidized nucleoside triphos-phatase hMTH1. Aging Cell 12: 695–705.https://doi.org/10.1111/ acel.12094
de Magalhães, J. P., 2005 Open-minded scepticism: inferring the causal mechanisms of human ageing from genetic perturbations. Ageing Res. Rev. 4: 1–22. https://doi.org/10.1016/j.arr.2004. 05.003
de Magalhães, J. P., and R. G. Faragher, 2008 Cell divisions and mammalian aging: integrative biology insights from genes that regulate longevity. BioEssays 30: 567–578. https://doi.org/ 10.1002/bies.20760
de Magalhães, J. P., J. A. Cabral, and D. Magalhaes, 2005 The influence of genes on the aging process of mice: a statistical assessment of the genetics of aging. Genetics 169: 265–274.
https://doi.org/10.1534/genetics.104.032292
de Magalhães, J. P., D. Wuttke, S. H. Wood, M. Plank, and C. Vora, 2012 Genome-environment interactions that modulate aging: powerful targets for drug discovery. Pharmacol. Rev. 64: 88– 101.https://doi.org/10.1124/pr.110.004499
Enns, L. C., J. F. Morton, P. R. Treuting, M. J. Emond, N. S. Wolf et al., 2009 Disruption of protein kinase A in mice enhances healthy aging. PLoS One 4: e5963 (erratum: PLoS One 5: DOI: 10.1371/annotation/c7cad2dc-1eca-487e-89ae-151a22d8a0b4).
https://doi.org/10.1371/journal.pone.0005963
Fernandes, M., C. Wan, R. Tacutu, D. Barardo, A. Rajput et al., 2016 Systematic analysis of the gerontome reveals links
between aging and age-related diseases. Hum. Mol. Genet. 25: 4804–4818.
Finch, C. E., 1990 Longevity, Senescence, and the Genome. The University of Chicago Press, Chicago.
Finch, C. E., and M. C. Pike, 1996 Maximum life span predictions from the Gompertz mortality model. J. Gerontol. A Biol. Sci. Med. Sci. 51: B183–B194. https://doi.org/10.1093/gerona/ 51A.3.B183
Finch, C. E., M. C. Pike, and M. Witten, 1990 Slow mortality rate accelerations during aging in some animals approximate that of humans. Science 249: 902–905. https://doi.org/10.1126/sci-ence.2392680
Garratt, M., S. Nakagawa, and M. J. Simons, 2016 Comparative idiosyncrasies in life extension by reduced mTOR signalling and its distinctiveness from dietary restriction. Aging Cell 15: 737– 743.https://doi.org/10.1111/acel.12489
Harper, J. M., J. E. Wilkinson, and R. A. Miller, 2010 Macrophage migration inhibitory factor-knockout mice are long lived and respond to caloric restriction. FASEB J. 24: 2436–2442.https:// doi.org/10.1096/fj.09-152223
Hayflick, L., 2000 The future of ageing. Nature 408: 267–269.
https://doi.org/10.1038/35041709
Hinkal, G., N. Parikh, and L. A. Donehower, 2009 Timed somatic deletion of p53 in mice reveals age-associated differences in tumor progression. PLoS One 4: e6654. https://doi.org/10.1371/ journal.pone.0006654
Hofmann, J. W., X. Zhao, M. De Cecco, A. L. Peterson, L. Pagliaroli et al., 2015 Reduced expression of MYC increases longevity and enhances healthspan. Cell 160: 477–488.https://doi.org/ 10.1016/j.cell.2014.12.016
Hughes, B. G., and S. Hekimi, 2016 Different mechanisms of lon-gevity in long-lived mouse and Caenorhabditis elegans mutants revealed by statistical analysis of mortality rates. Genetics 204: 905–920.https://doi.org/10.1534/genetics.116.192369
Jeng, Y. M., S. Cai-Ng, A. Li, S. Furuta, H. Chewet al., 2007 Brca1 heterozygous mice have shortened life span and are prone to ovarian tumorigenesis with haploinsufficiency upon ionizing ir-radiation. Oncogene 26: 6160–6166.https://doi.org/10.1038/ sj.onc.1210451
Kang, S., J. P. Louboutin, P. Datta, C. P. Landel, D. Martinezet al., 2013 Loss of HtrA2/Omi activity in non-neuronal tissues of adult mice causes premature aging. Cell Death Differ. 20: 259–269.https://doi.org/10.1038/cdd.2012.117
Kenyon, C. J., 2010 The genetics of ageing. Nature 464: 504–512 (erratum: Nature 467: 622).https://doi.org/10.1038/nature08980
Keyes, W. M., Y. Wu, H. Vogel, X. Guo, S. W. Lowe et al., 2005 p63 deficiency activates a program of cellular senescence and leads to accelerated aging. Genes Dev. 19: 1986–1999.
https://doi.org/10.1101/gad.342305
Ladiges, W., H. Van Remmen, R. Strong, Y. Ikeno, P. Treutinget al., 2009 Lifespan extension in genetically modified mice. Aging Cell 8: 346–352.
Lapointe, J., Z. Stepanyan, E. Bigras, and S. Hekimi, 2009 Reversal of the mitochondrial phenotype and slow devel-opment of oxidative biomarkers of aging in long-lived Mclk1+/2 mice. J. Biol. Chem. 284: 20364–20374.https://doi.org/10.1074/ jbc.M109.006569
Laurent, G., F. Solari, B. Mateescu, M. Karaca, J. Castel et al., 2008 Oxidative stress contributes to aging by enhancing pan-creatic angiogenesis and insulin signaling. Cell Metab. 7: 113– 124.https://doi.org/10.1016/j.cmet.2007.12.010
Li, H., H. Vogel, V. B. Holcomb, Y. Gu, and P. Hasty, 2007 Deletion of Ku70, Ku80, or both causes early aging without substantially increased cancer. Mol. Cell. Biol. 27: 8205–8214.https://doi.org/ 10.1128/MCB.00785-07
changes in cardiac intracellular Ca2+ homeostasis, protein dam-age and apoptotic protein expression. Aging Cell 6: 799–806.
https://doi.org/10.1111/j.1474-9726.2007.00343.x
Liu, X., N. Jiang, B. Hughes, E. Bigras, E. Shoubridge et al., 2005 Evolutionary conservation of the clk-1-dependent mech-anism of longevity: loss of mclk1 increases cellularfitness and lifespan in mice. Genes Dev. 19: 2424–2434. https://doi.org/ 10.1101/gad.1352905
Markovich, D., M. C. Ku, and D. Muslim, 2011 Increased lifespan in hyposulfatemic NaS1 null mice. Exp. Gerontol. 46: 833–835.
https://doi.org/10.1016/j.exger.2011.05.008
Matheu, A., A. Maraver, P. Klatt, I. Flores, I. Garcia-Cao et al., 2007 Delayed ageing through damage protection by the Arf/ p53 pathway. Nature 448: 375–379. https://doi.org/10.1038/ nature05949
Meira, L. B., J. A. Calvo, D. Shah, J. Klapacz, C. A. Moroski-Erkul et al., 2014 Repair of endogenous DNA base lesions modulate lifespan in mice. DNA Repair (Amst.) 21: 78–86. https://doi. org/10.1016/j.dnarep.2014.05.012
Min, J. N., R. A. Whaley, N. E. Sharpless, P. Lockyer, A. L. Portbury et al., 2008 CHIP deficiency decreases longevity, with accelera-ted aging phenotypes accompanied by altered protein quality control. Mol. Cell. Biol. 28: 4018–4025.https://doi.org/10.1128/ MCB.00296-08
Murga, M., S. Bunting, M. F. Montana, R. Soria, F. Muleroet al., 2009 A mouse model of ATR-Seckel shows embryonic replicative stress and accelerated aging. Nat. Genet. 41: 891–898.https://doi. org/10.1038/ng.420
Muro, A. F., A. K. Chauhan, S. Gajovic, A. Iaconcig, F. Porroet al., 2003 Regulated splicing of thefibronectin EDA exon is essen-tial for proper skin wound healing and normal lifespan. J. Cell Biol. 162: 149–160.https://doi.org/10.1083/jcb.200212079
Ortega-Molina, A., A. Efeyan, E. Lopez-Guadamillas, M. Munoz-Martin, G. Gomez-Lopezet al., 2012 Pten positively regulates brown adipose function, energy expenditure, and longevity. Cell Metab. 15: 382–394.https://doi.org/10.1016/j.cmet.2012.02.001
Pletcher, S. D., 2002 Mitigating the tithonus error: genetic anal-ysis of mortality phenotypes. Sci. SAGE KE 2002: pe14. Pletcher, S. D., A. A. Khazaeli, and J. W. Curtsinger, 2000 Why do
life spans differ? Partitioning mean longevity differences in terms of age-specific mortality parameters. J. Gerontol. A Biol. Sci. Med. Sci. 55: B381–B389. https://doi.org/10.1093/ger-ona/55.8.B381
Pyo, J. O., S. M. Yoo, H. H. Ahn, J. Nah, S. H. Hong et al., 2013 Overexpression of Atg5 in mice activates autophagy and extends lifespan. Nat. Commun. 4: 2300.https://doi.org/10.1038/ ncomms3300
Ran, Q., H. Liang, Y. Ikeno, W. Qi, T. A. Prollaet al., 2007 Reduction in glutathione peroxidase 4 increases life span through increased sensitivity to apoptosis. J. Gerontol. A Biol. Sci. Med. Sci. 62: 932– 942.https://doi.org/10.1093/gerona/62.9.932
Razzaque, M. S., D. Sitara, T. Taguchi, R. St-Arnaud, and B. Lanske, 2006 Premature aging-like phenotype infibroblast growth factor 23 null mice is a vitamin D-mediated process. FASEB J. 20: 720– 722.https://doi.org/10.1096/fj.05-5432fje
Satoh, A., C. S. Brace, N. Rensing, P. Cliften, D. F. Wozniaket al., 2013 Sirt1 extends life span and delays aging in mice through the regulation of Nk2 homeobox 1 in the DMH and LH. Cell Metab. 18: 416–430.https://doi.org/10.1016/j.cmet.2013.07.013
Schriner, S. E., N. J. Linford, G. M. Martin, P. Treuting, C. E. Ogburn et al., 2005 Extension of murine life span by overexpression of catalase targeted to mitochondria. Science 308: 1909–1911.
https://doi.org/10.1126/science.1106653
Selman, C., J. M. Tullet, D. Wieser, E. Irvine, S. J. Lingard et al., 2009 Ribosomal protein S6 kinase 1 signaling regulates mam-malian life span. Science 326: 140–144.https://doi.org/10.1126/ science.1177221
Sibille, E., J. Su, S. Leman, A. M. Le Guisquet, Y. Ibarguen-Vargas et al., 2007 Lack of serotonin1B receptor expression leads to age-related motor dysfunction, early onset of brain molecular aging and reduced longevity. Mol. Psychiatry 12: 1042–1056.
https://doi.org/10.1038/sj.mp.4001990
Streeper, R. S., C. A. Grueter, N. Salomonis, S. Cases, M. C. Levin et al., 2012 Deficiency of the lipid synthesis enzyme, DGAT1, extends longevity in mice. Aging (Albany N.Y.) 4: 13–27. Sun, L. Q., D. W. Lee, Q. Zhang, W. Xiao, E. H. Raabe et al.,
2004 Growth retardation and premature aging phenotypes in mice with disruption of the SNF2-like gene, PASG. Genes Dev. 18: 1035–1046.https://doi.org/10.1101/gad.1176104
Sun, L. Y., A. Spong, W. R. Swindell, Y. Fang, C. Hill et al., 2013 Growth hormone-releasing hormone disruption extends lifespan and regulates response to caloric restriction in mice. Elife 2: e01098.https://doi.org/10.7554/eLife.01098
Tacutu, R., T. Craig, A. Budovsky, D. Wuttke, G. Lehmann et al., 2013 Human ageing genomic resources: integrated databases and tools for the biology and genetics of ageing. Nucleic Acids Res. 41: D1027–D1033.https://doi.org/10.1093/nar/gks1155
Taguchi, A., L. M. Wartschow, and M. F. White, 2007 Brain IRS2 signaling coordinates life span and nutrient homeostasis. Sci-ence 317: 369–372.https://doi.org/10.1126/science.1142179
Tocchetti, A., C. B. Soppo, F. Zani, F. Bianchi, M. C. Gaglianiet al., 2010 Loss of the actin remodeler Eps8 causes intestinal defects and improved metabolic status in mice. PLoS One 5: e9468.
https://doi.org/10.1371/journal.pone.0009468
Tomás-Loba, A., I. Flores, P. J. Fernández-Marcos, M. L. Cayuela, A. Maraveret al., 2008 Telomerase reverse transcriptase delays aging in cancer-resistant mice. Cell 135: 609–622.https://doi. org/10.1016/j.cell.2008.09.034
Vakhrusheva, O., C. Smolka, P. Gajawada, S. Kostin, T. Boettger et al., 2008 Sirt7 increases stress resistance of cardiomyocytes and prevents apoptosis and inflammatory cardiomyopathy in mice. Circ. Res. 102: 703–710. https://doi.org/10.1161/CIR-CRESAHA.107.164558
Vogel, H., D. S. Lim, G. Karsenty, M. Finegold, and P. Hasty, 1999 Deletion of Ku86 causes early onset of senescence in mice. Proc. Natl. Acad. Sci. USA 96: 10770–10775. https:// doi.org/10.1073/pnas.96.19.10770
Wang, C. H., Y. F. Chen, C. Y. Wu, P. C. Wu, Y. L. Huang et al., 2014 Cisd2 modulates the differentiation and functioning of adipocytes by regulating intracellular Ca2+ homeostasis. Hum. Mol. Genet. 23: 4770–4785.https://doi.org/10.1093/hmg/ddu193
Wang, L., L. Yang, M. Debidda, D. Witte, and Y. Zheng, 2007 Cdc42 GTPase-activating protein deficiency promotes genomic instability and premature aging-like phenotypes. Proc. Natl. Acad. Sci. USA 104: 1248–1253.https://doi.org/10.1073/pnas.0609149104
Wei, K., A. B. Clark, E. Wong, M. F. Kane, D. J. Mazur et al., 2003 Inactivation of Exonuclease 1 in mice results in DNA mismatch repair defects, increased cancer susceptibility, and male and female sterility. Genes Dev. 17: 603–614. https:// doi.org/10.1101/gad.1060603
Wu, C. Y., Y. F. Chen, C. H. Wang, C. H. Kao, H. W. Zhuanget al., 2012 A persistent level of Cisd2 extends healthy lifespan and delays aging in mice. Hum. Mol. Genet. 21: 3956–3968.https:// doi.org/10.1093/hmg/dds210
Wu, J. J., J. Liu, E. B. Chen, J. J. Wang, L. Cao et al., 2013 Increased mammalian lifespan and a segmental and tissue-specific slowing of aging after genetic reduction of mTOR expression. Cell Rep. 4: 913–920.https://doi.org/10.1016/j.celrep.2013.07.030
Yan, L., D. E. Vatner, J. P. O’Connor, A. Ivessa, H. Ge et al., 2007 Type 5 adenylyl cyclase disruption increases longevity and protects against stress. Cell 130: 247–258.https://doi.org/ 10.1016/j.cell.2007.05.038
influence lifespan. Exp. Gerontol. 43: 1044–1051. https://doi. org/10.1016/j.exger.2008.09.006
Zhang, G., J. Li, S. Purkayastha, Y. Tang, H. Zhang et al., 2013 Hypothalamic programming of systemic ageing involv-ing IKK-beta, NF-kappaB and GnRH. Nature 497: 211–216.
https://doi.org/10.1038/nature12143
Zhang, Y., S. S. Padalecki, A. R. Chaudhuri, E. De Waal, B. A. Goins et al., 2007 Caspase-2 deficiency enhances aging-related traits in mice. Mech. Ageing Dev. 128: 213–221. https://doi.org/ 10.1016/j.mad.2006.11.030
Zhang, Y., Y. Xie, E. D. Berglund, K. C. Coate, T. T. He et al., 2012 The starvation hormone,fibroblast growth factor-21, ex-tends lifespan in mice. Elife 1: e00065.https://doi.org/10.7554/ eLife.00065
Zheng, S., E. B. Clabough, S. Sarkar, M. Futter, D. C. Rubinsztein et al., 2010 Deletion of the huntingtin polyglutamine stretch enhances neuronal autophagy and longevity in mice. PLoS Genet. 6: e1000838.https://doi.org/10.1371/journal.pgen.1000838