Sub-metering Prototype Design for Low
Power Distribution Systems- Part 1
Ranjana Oram, Raghavendra M Bhat, Sucheta S Rao, Nivedita N 1, Dr. P Meena 2
Final year B.E, Department of Electrical & Electronics, B.M.S College of Engineering, Bengaluru, India 1
Associate Professor, Department of Electrical & Electronics, B.M.S College of Engineering, Bengaluru, India 2
ABSTRACT: Technological advancement has led to many methodologies to reduce the gap between demand and supply of electric power and hence saving. Achieving energy security by holistic planning requires a quality energy monitoring system at the distribution end which addresses issues related to power quality and consumption. This paper presents the need for an effective sub-metering system to apprise utility managers on the real time power situation, using sensor technology and web-based Graphic User Interface to schedule and manage flexible loads from any remote location. Results obtained on the successful implementation of algorithms for effective measurement of parameters are presented.
KEYWORDS: Power Monitoring System, Sub-metering, GUI, Two-part tariff.
I. INTRODUCTION
Electricity Tariff rates are structured based on the type of consumer. Most bulk consumers are charged based on two-part tariff as given by expression (1).
- (1)
Where, p = charge per KVA of maximum demand = fixed charges.
Maximum demand is 75% of contracted demand or recorded maximum demand, whichever is higher.
= time of day Tariff 6am to 6pm; = time of day Tariff 6pm to 10pm; = time of day Tariff 10pm to 6am.
The bulk consumer has to pay the fixed charges irrespective of the consumption. Heavy penalty is levied on the consumer on overshooting the contracted maximum demand. Also, different rates are levied for consumption during On-peak and Off-peak periods. Consumer incurs a penalty when the power factor drops below 0.9. The terms and conditions are given by Karnataka Electricity Regulatory Commission [1]. The consumer does not receive any prior notification to keep the above mentioned parameters in check. Details of overshoot, on-peak period power consumption, power factor etc. are known only when the monthly bill arrives. In such a scenario, a sub-metering unit capable of monitoring, displaying the consumption, highlighting various situations such as the occurrence of low power factor, low voltage, maximum demand reaching the contracted demand, unbalance of load, overloading of the phases would certainly come in handy for efficient load scheduling and management.
II. BACKGROUND
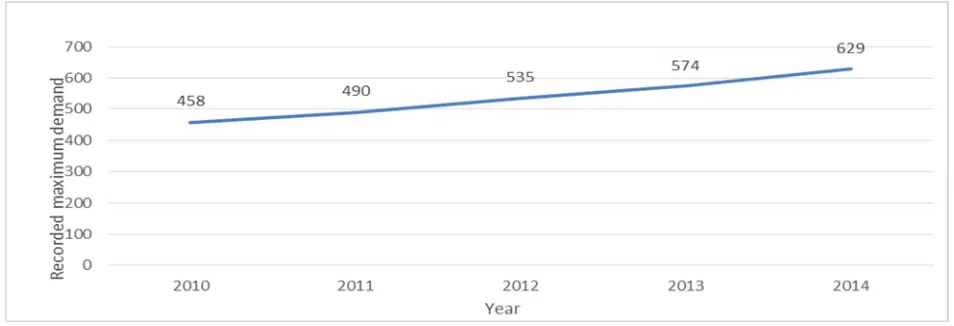
guidelines given by BESCOM [1] for this consumer is 650 KVA, exceeding which heavy penalty is levied. The utility managers suggest that, in the summer months, the utility supply voltage drops leading to a corresponding rise in current and consequently a significant rise in KVA. As shown in Figure 1, the maximum demand rose to 629 KVA in the year 2014. A mechanism therefore is necessary to avoid further rise in maximum demand in the following years. A real time Power Monitoring System, installed at the load end would help monitor the maximum demand to keep it within the contracted demand and avoid penalty. It would also help in identifying the loads contributing to the increased power during the peak period. Such a system would not only help monitor and control the maximum demand but would also prove to be helpful for better load scheduling as per time of day tariff [1] and monitor the True Power Factor (TPF).
III.REAL -TIME POWER MONITORING SYSTEM The benefits of a real-time power monitoring system are -
• Better energy management and conservation
A better knowledge of how energy is used within a facility allows consumers to identify an array of prospects to improve efficiency, minimize wastage, and reduce energy consumption.
• Predict behaviour of loads - load profiling
Power consumption trends can forecast and notify the appropriate people when discrete equipment parameters may be exceeded, allowing users to plan ahead instead of facing an unscheduled shutdown.
• Make more energy conscious decisions
Peak demand charges are expensive. Bulk consumers can benefit from utilizing energy during off-peak hours and thus reduce their electricity costs.
• Incorporate automation and manage systems
Power monitoring systems can provide alarms to alert customers to manage and monitor devices. A smart power monitoring unit can even automate systems as per requirement.
The overall block diagram of a prototype that has been designed with the intent of gathering data of current and voltage of single phase loads such as fans, tube lights, Compact Fluorescent Lamps (CFL), Light Emitting Diode (LED) bulb, etc. and subsequently calculate other parameters using this data is presented in Figure 2. The device comprises of algorithms for frequency measurement and dynamic measurement of the energy consumed by various connected loads. The voltage and current sensors used have their outputs sent to a Digital Signal Processor (DSP), which calculates power, True Power Factor, Total Harmonic Distortion (THD) and frequency in real time. Each device is connected to a certain Analog-to-Digital Converter (ADC) pin of the DSP, through a sensor and is thus identified. The device ID,
current, voltage, frequency, active power, total harmonic distortion and true power factor values are sent to Arduino which has a Real Time Clock (RTC) module connected to it for the purpose of providing time stamp to the data. GSM module is used for communication and to upload data onto a cloud. Information from the cloud is retrieved, converted into a spread-sheet and consequently used to obtain a graphical representation of the power consumption of different devices, which is available on a URL for easy access from any location. The GUI is such that it enables the user to view real-time plots of the parameters chosen, view total consumption during a certain selected time period, and get information on the remaining life of loads connected so that prior arrangements for replacement can be made. An overall block diagram of the unit is as shown in Figure 2.
Figure 2: Overall Block Diagram of Power Monitoring Unit
For better understanding, the functional block diagram of the data acquisition and processing unit is as shown in Figure 3. The function of calculating other parameters through the values received from current and voltage sensors is done by implementing the algorithms in the processor and these values are subsequently passed to Arduino, where data receives a time stamp.
The further scope of work includes communicating results calculated by the DSP to the Arduino and consequently uploading it onto the cloud periodically using the GSM module. Retrieved data will be displayed on a URL for easy access by the consumer. There is also provision to send selected data such as ID of device consuming maximum power during on-peak hours, device producing high THD, TPF value, etc. to the utility manager in the facility. This information would help the utility manager in scheduling loads better and to run the flexible loads during off-peak hours (to minimize the energy charges), cut-off high THD producing machinery when possible and also identify whether the installed power factor correction equipment (capacitor banks) are functioning as desired. This database can be further analysed and used by utilities or consumers to incorporate methods to minimize losses due to harmonics, to predict life-time of devices, predict energy consumption at a different point in time if the same conditions prevail etc. The consumer bills can also be forecast since the usage hours and consumption are known.
IV.ALGORITHMS
Voltage and current parameters are obtained using sensors which are connected to the ADC pins of the DSP. Each of these values are sampled at a rate of 20KHz. Calibration of sensors has been done to obtain the actual current and voltages from the values given by ADC. A moving window is used to calculate the RMS values. Other parameters are obtained as follows –
FREQUENCYCALCULATIONALGORITHM
The frequency measurement algorithm needs a three phase signal which has to be split into alpha and beta components which are 90° apart.
For implementation in single phase, the two signals, alpha and beta can be obtained by the following steps: Keep the original signal as alpha component.
Pass the signal through an all pass filter to get the beta component.
The alpha and beta components are passed through a low pass filter having transfer function
Figure 4: Nature of Output Signals when Passed Through Low Pass Filter
Nature of the output signals obtained when passed through low pass filter is as shown in Figure 4.
It is observed from figure 4 that, not only do the output signals obtained have the same amplitudes, but they also have the same phase shifts with respect to the input signal. Now using the identities, we get
- Equation 1
Equation 2
TRUE POWER FACTOR CALCULATION ALGORITHM
The theory considered for finding the true power factor involves instantaneous p-q Theory [3].
First, the voltage and current signals are passed through an all pass filter (for 90° shift). We take the original voltage or current signal as the Alpha component and the output of the all pass filter as the Beta component.
Instantaneous power,
Therefore,
Instantaneous active power Instantaneous reactive power
All the algorithms were implemented and verified in Simulink environment.
V. RESULTS
Preliminary results achieved upon the implementation of frequency measurement and true power factor calculation algorithms, for an LED bulb as load, in Code Composer Studio (CCS) are as shown in Figure 5.
Figure 5: Results Calculated by Digital Signal Processor for LED Bulb
Figure 6: Power Consumption Parameters of LED Given By Mixed Domain Oscilloscope
VI.CONCLUSION &SCOPE
The need for a sub-metering system in a low power distribution network is justified and the complete design of the prototype with features for measurement of various parameters explained. The results obtained show the successful implementation of the algorithms for measurement of various alternating current parameters such as RMS Voltage, RMS current, average power, frequency and true power factor. They match with that obtained from a standard recording device such as a Mixed Domain Oscilloscope. The parameters gathered can be analysed further and extended for automated control of loads, such as switch-off of flexible loads during on-peak period and scheduling switch-on of various loads in such a way that the net KVA is well below the contracted demand. With the growing trend in the use of Solar Energy as part of the Smart Grid or otherwise, DC parameter sensing is of importance. This power monitoring system can also be used to sense DC parameters with additional DC current and voltage sensors.
ACKNOWLEDGEMENTS
The authors acknowledge the support received from Technical Education Quality Improvement Program (TEQIP) –II for this work.
REFERENCES
[1] Karnataka Electricity Regulatory Commission “Tariff Order 2015 of BESCOM”: 2nd March 2015