ABSTRACT
SYED, SAMMIUDDIN. Influence of Weld Sequence on the Seismic Failure of Welded Steel Moment Connections in Building Structures. (Under the Direction of Dr. Tasnim Hassan and Dr. Emmett Sumner.)
Over a decade of research activities after the Northridge earthquake have developed
modified designs of welded steel moment connections (WSMCs) with improved ductility
performance. Various modifications have been made, since then, to weld access hole and weld
details towards improvement of structural performance with emphasis on global parameters such
as drift, strength and stability. However the recent research by Castiglioni demonstrates that new
designs of WSMCs may still fail in a brittle manner. While test results on the new connections
demonstrate significant improvement with regards to ductility, little work has been done to fully
understand the localized failure mechanism of WSMCs. Previously a study at NC State by
Lu(2003) demonstrated that the localized failure mechanism and fatigue life of welded piping
joints is directly influenced by the welding procedure and welding sequence. Hence this current
research makes an effort to investigate the influence of weld sequence on the seismic failure of
WSMCs. Further an attempt is made to demonstrate a correlation between the localized failure
mechanism and global structural performance.
The primary goal of this research is to observe and understand the local behavior of the
WSMCs through analysis and a set of structural experiments on specially designed tee-joint
specimen and full-scale welded joints. A tee-joint specimen consists of a short section of bottom
beam flange welded to the column flange on both ends using a complete joint penetration weld.
Further a tee-joint specimen yields two set of data for analysis when compared to that of
full-scale joint. Two different types of weld sequences are employed in the fabrication of the test
addition, the cyclic loading tests performed on full-joint welded steel moment connections with
weld sequences similar to that of the tee-joints for understanding the relationship between the
local and global responses. Finite element simulations of the full-scale WMSCs are conducted
using ANSYS with Chaboche and multi-linear material models. These pretest analyses are
utilized to develop the loading protocol for the experimental program.
Both the full-joint and tee-joint specimens showed brittle failures when subjected to
constant amplitude cyclic loading. It is also observed that the fatigue cracks in all the
experiments occurred at the weld toe of the complete joint penetration weld. Recorded strain data
from the strain gages located near the complete joint penetration welds demonstrated the
presence of ratcheting. This observation is further supported by the symmetric strain response
(no ratcheting) in the strain gages located away from the welded joint. This strain ratcheting
response may also influence the formation of cracks near the welds leading to the brittle failure
of the WSMCs. The two tee-joint and full-scale specimens have shown varied fatigue life
indicating the affect of weld sequence used in their fabrication. In conclusion, this research
investigates local and global failure responses of welded steel moment connections with different
Influence of Weld Sequence on the Seismic Failure of Welded Steel
Moment Connections in Building Structures
by
Sammiuddin Q. Syed
A thesis submitted to the Graduate Faculty of North Carolina State University
in partial fulfillment of the requirements for the Degree of
Master of Science
Civil Engineering
Raleigh, North Carolina
2009
APPROVED BY:
Dr. Tasnim Hassan Dr. Emmett. A. Sumner
Chair of Advisory Committee Co-Chair of Advisory Committee
BIOGRAPHY
Sammiuddin Quadri Syed was born on 9th December 1983 in Al-Khobar, Saudi Arabia. He
grew up in Hyderabad, India. He graduated from Indian Institute of Technology, Roorkee in
May 2006 with a bachelor’s degree in Civil Engineering. Upon graduation, he joined North
Carolina State University to pursue his Master’s degree in July 2006. After completing his
Master’s Degree in December 2008, he is working towards his Doctoral degree in Structural
ACKNOWLEDGEMENTS
I would like to thank the members of my committee, Dr. Tasnim Hassan and Dr. Emmett
Sumner for their support and guidance through this project. I would also like to thank the
Civil Engineering Department at NC State University for funding. In addition, SteelFab
deserves acknowledgement for donating the steel specimens, Buckner Steel Erection for
welding services, and the National Science Foundation for funding this research project. This
would not have been possible without the assistance of Jerry Atkinson, Greg Lucier and
Chemin Lee in day to day laboratory activities and Bill Dunleavy for computer and
TABLE OF CONTENTS
LIST OF FIGURES ... vii
LIST OF TABLES ... xix
1. INTRODUCTION ... 1
1.1 Background ... 1
1.2 Structural Behavior of Welded Steel Moment Frames (WSMFs) ... 4
1.3 Testing of Welded Steel Moment Frame (WSMF) Connections ... 9
1.4 Design Modifications for Improved Ductility ... 12
1.5 Low-Cycle Fatigue ... 19
1.6 Motivation ... 21
1.7 Test Specimen and Experiments ... 28
2. EXPERIMENTAL INVESTIGATION – PHASE I ... 30
2.1 Introduction ... 30
2.2 Test Specimens ... 32
2.2.1 Bottom Beam Flange Test Specimen Conceptualization ... 32
2.2.2 Welding Procedure & Welding Details ... 35
2.3 Test Set-up and Instrumentation ... 49
2.4 Loading History ... 54
2.5 Basic Test Results ... 55
3. EXPERIMENTAL INVESTIGATION –PHASE II ... 63
3.1. Test Specimen ... 63
3.1.1 Description of the Test Specimen ... 63
3.1.3 Welding Procedure & Welding Details ... 66
3.2 Instrumentation ... 72
3.3 Test Set-up ... 77
3.4 Loading History ... 79
3.5 Basic Test Results ... 80
3.5.1 Data Reduction and Calculations ... 80
3.5.2 Global Performance of the full-joint welded steel moment connection ... 85
3.5.3 Local Performance of the full-joint welded steel moment connection ... 89
4. DISCUSSION OF RESULTS ... 91
4.1 Test Results of Bottom Beam Flange Tee Joint Specimen. ... 91
4.1.1 Global Behavior of the bottom beam flange tee joint specimen ... 91
4.1.2 Local Behavior of the bottom beam flange tee joint specimen ... 99
4.2 Test Results of Full Joint Welded Steel Moment Connection ... 106
4.2.1 Global behavior of full joint welded steel moment connection ... 106
4.2.2 Local behavior of full joint welded steel moment connection ... 117
4.3 Effect of weld sequence on the fatigue life ... 123
4.4 Comparison of local behavior of the bottom beam flange tee joint specimens ... 126
4.5 Comparison of local behavior of full joint welded steel moment connections ... 131
5. OBSERVATIONS, RECOMMENDATIONS, AND CONCLUSIONS ... 138
5.1 Observations ... 138
5.2 Recommendations ... 141
5.3 Conclusions ... 142
REFERENCES ... 144
APPENDIX A: TEST RESULTS OF T-CA-A-1A/B ... 150
APPENDIX A: TEST RESULTS OF T-CA-A-1A/B ... 150
APPENDIX B: TEST RESULTS OF T-CA-A-2A/B ... 161
APPENDIX C: TEST RESULTS OF MC-CA-B-J1 ... 170
APPENDIX D: TEST RESULTS OF MC-CA-A-J2... 191
APPENDIX E: ANALYTICAL INVESTIGATION... 213
APPENDIX F: COMPARISION OF TEE JOINT TEST RESULTS ... 229
APPENDIX G: COMPARISION OF FULL JOINT TEST RESULTS ... 239
APPENDIX H: WELDING DETAILS AND TEMPERATURE MEASUREMENTS ... 250
LIST OF FIGURES
Fig. 1.1 – Beam-column connection fractures during 1994 Northridge earthquake ... 3
Fig. 1.2 – Plastic hinge development in steel beams [FEMA350] ... 5
Fig. 1.3 – Common zone of fracture initiation in beam-to-column connections ... 6
Fig. 1.4 Crack Types during 1994 Northridge earthquake [Miller, 1998] ... 7
Fig. 1.5 – Sketch of a typical welded steel moment connection ... 13
Fig. 1.5 – Sketch of pre-Northridge connection ... 15
Fig. 1.6 – Sketch of post-Northridge connection ... 15
Fig. 1.7 – Radius cut reduced beam section (RBS) moment connection ... 17
Fig. 1.8 – Finite element results by Castiglioni [2005] ... 26
Fig. 2.1 – Top and bottom flange welding passes ... 32
Fig. 2.2 – Conceptualization of the bottom flange tee joint specimen ... 33
Fig. 2.3 – Bottom beam flange tee joint specimen ... 34
Fig. 2.4 – Photograph of a typical bottom beam flange tee joint specimen ... 35
Fig. 2.5 – Welding Sequence A ... 37
Fig. 2.6 –Welding Sequence B ... 38
Fig. 2.7 – Example of weld access hole and backing bar ... 39
Fig. 2.8 – Complete joint penetration groove weld placed to join the bottom beam flange to the column flange ... 41
Fig. 2.9 – Complete bottom beam flange tee joint ... 41
Fig. 2.10 – Welding sequence for bottom beam flange tee joint specimens ... 43
Fig. 2.11 – Alternate welding sequence for bottom beam flange tee joint specimens tested in Phase-I by Royster, 2007 ... 43
Fig. 2.12 Sketch showing the weld sequence of bottom tee beam flange in T-CA-A-2A/B .. 45
Fig. 2.14 – Bottom beam flange tee joint test setup... 50
Fig. 2.15 – Photograph of actual beam flange tee joint specimen test setup ... 50
Fig. 2.16 – Potentiometers (POTs) and LVDT’s on bottom flange tee joint specimen ... 52
Fig. 2.17 – Strain gage locations ... 53
Fig. 2.18 Sketch of the constant loading history on the Specimen T-CA-A-2A/B ... 57
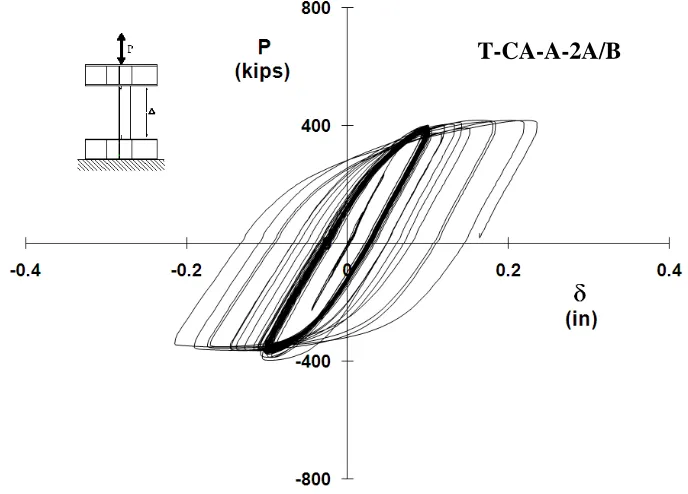
Fig. 2.19 T-CA-A-2A/B load-displacement response ... 57
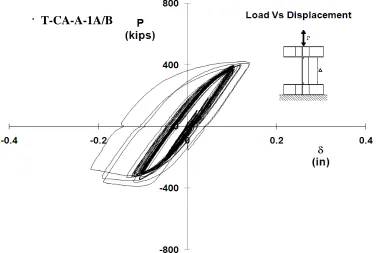
Fig. 2.20 Sketch of the constant loading history on the Specimen T-CA-A-1A/B ... 58
Fig. 2.21 T-CA-A-1A/B load-displacement response ... 58
Fig. 2.22 Load-strain plot of strain gage T-CA-A-1A SG-R2-O-4 ... 59
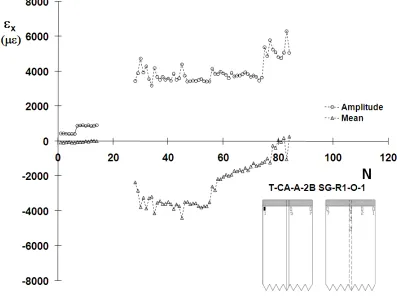
Fig. 2.23 T-CA-A-1B SG-R1-O-1 mean strain and strain amplitude plot... 60
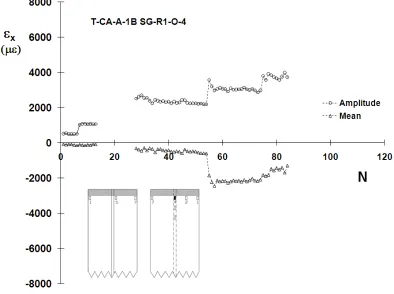
Fig. 2.24 T-CA-A-1B SG-R1-O4 mean strain and strain amplitude plot ... 61
Fig. 3.1 – Sketch of the full-scale exterior welded steel moment connection ... 64
Fig. 3.2 – Sketch of the weld access hole deigned as per AISC Seismic Design Provision ... 65
Fig. 3.3 – Comparison of sketch of weld access hole designed and fabricated ... 65
Fig. 3.4 Sketch showing the weld sequence of top and bottom flange in MC-CA-B-J1 ... 68
Fig. 3.5 Sketch showing the weld sequence of top and bottom flange in MC-CA-A-J2 ... 70
Fig. 3.6 Sketch showing the location of the instruments in the test set up ... 73
Fig.3.7 Strain gage location on the top and bottom beam flange. ... 75
Fig.3.8 Strain gage location on the column flange joining the beam ... 76
Fig. 3.9 – Full scale beam column joint specimen test setup ... 78
Fig. 3.10– 3D view of full scale beam column joint specimen test setup ... 79
Fig. 3.11 Sketch showing the location of the instruments in the test set up ... 82
Fig. 3.12 Sketch showing the components of the total rotation of the joint ... 83
Fig.3.13 Sketch of the constant loading history on the Specimen MC-CA-B-J1 ... 85
Fig.3.15 Moment-total rotation response of MC-CA-B-J1 ... 87
Fig.3.16 Load-beam tip displacement response of MC-CA-A-J2 ... 88
Fig.3.17 Moment-total rotation response of MC-CA-A-J2 ... 88
Fig. 3.18 MC-CA-B-CTF-SG-R1-O-4 mean strain and strain amplitude plot ... 89
Fig. 3.19 MC-CA-B-BTF-SG-R1-O-2 mean strain and strain amplitude plot ... 90
Fig. 4.1 Sketch of the constant loading history on the Specimen T-CA-A-1A/B ... 92
Fig.4.2 Cracks in the beam flange of Specimen T-CA-A-1A/B at the weld-metal interface at end 1B (grounded to the floor) ... 94
Fig.4.3 Load – Displacement Plots of Specimen T-CA-A-1A/B for various loading phases 95 Fig. 4.4 Sketch of the constant loading history on the Specimen T-CA-A-2A/B ... 96
Fig.4.5 Cracks in the reinforcing fillet weld of Specimen T-CA-A-2A/B at end 2A (attached to the spreader beam) ... 97
Fig.4.6 Load – Displacement Plots of Specimen T-CA-A-2A/B for various loading phases 98 Fig. 4.8 Strain Means and Amplitudes of T-CA-1A SG-R1-O-2 ... 102
Fig. 4.9 – Strain amplitudes and means for T-CA-A-1B SG-R1-O-1 ... 103
Fig. 4.10 Strain Means and Amplitudes of T-CA-2B SG-R1-I-5 ... 104
Fig. 4.11 Strain Means and Amplitudes of T-CA-2B SG-R1-O-1 ... 104
Fig. 4.12 Strain Means and Amplitudes of T-CA-2A SG-R1-I-1 ... 105
Fig.4.13 Sketch of the constant loading history on the Specimen MC-CA-B-J1 ... 107
Fig4.14 Cracks in the Reinforcing Fillet Weld of bottom beam flange of MC-CA-B-J1 .... 108
Fig4.15 Cracks in the weld-base metal interface of top beam flange of MC-CA-B-J1 ... 109
Fig. 4.16 Rupture of the top flange in MC-CA-B-J1 initiated at the flattened portion of the weld access hole ... 109
`Fig.4.17 Moment-total rotation plots of specimen MC-CA-B-J1 ... 111
Fig. 4.19 Sketch of the constant loading history on the Specimen MC-CA-A-J2 ... 113
Fig.4.20 Rupture in the top beam flange of MC-CA-A-J2 ... 114
Fig.4.21 Moment-total rotation plots of specimen MC-CA-A-J2 ... 115
Fig.4.22 Moment-plastic rotation plots of specimen MC-CA-A-J2 ... 116
Fig.4.23 Strain mean and amplitude of MC-CA-B-BTF-SG-R1-I-2 ... 118
Fig.4.25 Strain mean and amplitude of MC-CA-B-BTF-SG-R1-I-6 ... 119
Fig.4.26 Strain mean and amplitude of MC-CA-B-BTF-SG-R1-I-3 ... 119
Fig.4.27 Strain mean and amplitude of MC-CA-B-CBF-SG-R1-O-4 ... 120
Fig.4.28 Strain mean and amplitude of MC-CA-B-BBF-SG-R3-O-4 ... 121
Fig.4.29 Strain mean and amplitude of MC-CA-A-BTF-SG-R1-I-6 ... 122
Fig.4.30 Strain mean and amplitude of MC-CA-A-CFB-SG-R1-O-4 ... 122
Fig. 4.31 – Comparison of sketch of weld access hole designed and fabricated ... 125
Fig. 4.32 – Opposite ratcheting trends observed in the gage T-CA-A/B-1A SG-R1-O-4 .... 128
Fig. 4.33 – Opposite ratcheting trends observed in the gage T-CA-A/B-2A SG-R1-O-4 .... 128
Fig. 4.34 – Similar ratcheting trend observed in the gage T-CA-A/B-2A SG-R1-O-1 ... 129
Fig. 4.35 –No ratcheting and similar behavior observed in the T-CA-A/B-2B SG-R3-O-4 130 Fig. 4.36–Comparison of Strain amplitude and means of MC-CA-A/B-BBF-SG-R4-O-4 . 132 Fig. 4.37–Comparison of Strain amplitude and means of MC-CA-A/B-BBF-SG-R4-O-4 . 132 Fig.4.38–Comparison of Strain amplitude and means of MC-CA-A/B-BBF-SG-R4-O-4 .. 133
Fig. 4.39– Opposite ratcheting trends observed in the gage located on outside of center of beam flange ... 134
Fig. 4.40–Comparison of Strain amplitudes and means of MC-CA-A/B-BTF-SG-R1-I-6 .. 134
Fig. 4.44–Comparison of Strain amplitudes and means of MC-CA-A/B-CBF-SG-R1-O-2 137
Fig. A.1 – Displacement history for T-CA-A-1A/B ... 151
Fig. A.2 – Load-displacement response for T-CA-A-1A/B ... 151
Fig. A.3 – Phase 1 load-displacement response for T-CA-A-1A/B ... 152
Fig. A.4 – Phase 2 load-displacement response for T-CA-A-1A/B ... 152
Fig. A.5 – Phase 3 load-displacement response for T-CA-A-1A/B ... 153
Fig. A.6 – Phase 3 load-displacement response for T-CA-A-1A/B ... 153
Fig. A.7 – Phase 3 load-displacement response for T-CA-A-1A/B ... 154
Fig. A.8 – Load amplitudes and means for T-CA-A-1A/B ... 154
Fig. A.9 – Displacement amplitudes and means for T-CA-B-1A/B ... 155
Fig. A.10 – Strain amplitudes and means for T-CA-A-1A SG-R1-O-2 ... 155
Fig. A.11 – Strain amplitudes and means for T-CA-A-1A SG-R1-O-4 ... 156
Fig. A.12 – Strain amplitudes and means for T-CA-A-1A SG-R2-O-4 ... 156
Fig. A.13 – Strain amplitudes and means for T-CA-A-1A SG-R3-O-4 ... 157
Fig. A.14 – Strain amplitudes and means for T-CA-A-1B SG-R3-O-4 ... 157
Fig. A.15 – Strain amplitudes and means for T-CA-A-1B SG-R1-O-1 ... 158
Fig. A.16 – Strain amplitudes and means for T-CA-A-1B SG-R1-O-2 ... 158
Fig. A.17 – Strain amplitudes and means for T-CA-A-1B SG-R1-O-4 ... 159
Fig. A.18 – Strain amplitudes and means for T-CA-A-1B SG-R1-I-1 ... 159
Fig. A.19 – Strain amplitudes and means for T-CA-A-1B SG-R1-I-5 ... 160
Fig. B.1 – Displacement history for T-CA-A-2A/B ... 162
Fig. B.2 – Load-displacement response for T-CA-A-2A/B ... 162
Fig. B.3 – Phase 1 load-displacement response for T-CA-A-2A/B ... 163
Fig. B.4 – Phase 2 load-displacement response for T-CA-A-2A/B ... 163
Fig. B.6 – Phase 3 load-displacement response for T-CA-A-2A/B ... 164
Fig. B.7 – Load amplitudes and means for T-CA-A-2A/B ... 165
Fig. B.8 – Displacement amplitudes and means for T-CA-B-2A/B ... 165
Fig. B.9 – Strain amplitudes and means for T-CA-A-2A SG-R1-O-4 ... 166
Fig. B.10 – Strain amplitudes and means for T-CA-A-2A SG-R2-O-4 ... 166
Fig. B.11 – Strain amplitudes and means for T-CA-A-2A SG-R1-I-1 ... 167
Fig. B.12 – Strain amplitudes and means for T-CA-A-2B SG-R3-O-4 ... 167
Fig. B.13 – Strain amplitudes and means for T-CA-A-2B SG-R1-I-1 ... 168
Fig. B.14 – Strain amplitudes and means for T-CA-A-2B SG-R1-O-4 ... 168
Fig. B.15 – Strain amplitudes and means for T-CA-A-2B SG-R2-O-4 ... 169
Fig. B.16 – Strain amplitudes and means for T-CA-A-2B SG-R1-I-5 ... 169
Fig. C.1 – Displacement history for MC-CA-B-J1 ... 171
Fig. C.2 – Load displacement response of MC-CA-B-J1 ... 171
Fig. C.3 – Phase 1 load-displacement response of MC-CA-B-J1 ... 172
Fig. C.4 – Phase 2 load-displacement response of MC-CA-B-J1 ... 172
Fig. C.5 – Phase 3 load-displacement response of MC-CA-B-J1 ... 173
Fig. C.6 – Phase 4 load-displacement response of MC-CA-B-J1 ... 173
Fig. C.7 –Moment-total rotation response of MC-CA-B-J1 ... 174
Fig. C.8 –Moment-total beam rotation response of MC-CA-B-J1 ... 174
Fig. C.9 –Moment-total column rotation response of MC-CA-B-J1 ... 175
Fig. C.10 –Moment-total panel zone rotation response of MC-CA-B-J1 ... 175
Fig. C.11 –Moment-total plastic rotation response of MC-CA-B-J1 ... 176
Fig. C.12 –Moment-beam plastic rotation response of MC-CA-B-J1 ... 176
Fig. C.13 –Moment-column plastic rotation response of MC-CA-B-J1 ... 177
Fig. C.15 – Strain amplitudes and means for MC-CA-B-J1-BTF-SG-R1-I-1 ... 178
Fig. C.16 – Strain amplitudes and means for MC-CA-B-J1-BTF-SG-R1-I-2 ... 178
Fig. C.17 – Strain amplitudes and means for MC-CA-B-J1-BTF-SG-R1-I-3 ... 179
Fig. C.18 – Strain amplitudes and means for MC-CA-B-J1-BTF-SG-R1-I-5 ... 179
Fig. C.19 – Strain amplitudes and means for MC-CA-B-J1-BTF-SG-R1-I-6 ... 180
Fig. C.20 – Strain amplitudes and means for MC-CA-B-J1-BBF-SG-R1-O-1 ... 180
Fig. C.21 – Strain amplitudes and means for MC-CA-B-J1-BBF-SG-R2-O-4 ... 181
Fig. C.22 – Strain amplitudes and means for MC-CA-B-J1-BBF-SG-R3-O-4 ... 181
Fig. C.23 – Strain amplitudes and means for MC-CA-B-J1-BBF-SG-R4-O-4 ... 182
Fig. C.24 – Strain amplitudes and means for MC-CA-B-J1-BBF-SG-R5-O-4 ... 182
Fig. C.25 – Strain amplitudes and means for MC-CA-B-J1-BBF-SG-R6-O-4 ... 183
Fig. C.26 – Strain amplitudes and means for MC-CA-B-J1-BBF-SG-R1-I-1 ... 183
Fig. C.27 – Strain amplitudes and means for MC-CA-B-J1-BBF-SG-R1-I-2 ... 184
Fig. C.28– Strain amplitudes and means for MC-CA-B-J1-BBF-BGA-R1-I-3 ... 184
Fig. C.29 – Strain amplitudes and means for MC-CA-B-J1-BBF-BGT-R1-I-3 ... 185
Fig. C.30 – Strain amplitudes and means for MC-CA-B-J1-BBF-SG-R1-I-6 ... 185
Fig. C.31 – Strain amplitudes and means for MC-CA-B-J1-CBF-SG-R1-O-1 ... 186
Fig. C.32 – Strain amplitudes and means for MC-CA-B-J1-CBF-SG-R1-O-2 ... 186
Fig. C.33 – Strain amplitudes and means for MC-CA-B-J1-CBF-SG-R1-O-4 ... 187
Fig. C.34 – Strain amplitudes and means for MC-CA-B-J1-CBF-SG-R1-O-6 ... 187
Fig. C.35 – Strain amplitudes and means for MC-CA-B-J1-CTF-SG-R1-O-1 ... 188
Fig. C.36 – Strain amplitudes and means for MC-CA-B-J1-CTF-SG-R1-O-2 ... 188
Fig. C.37 – Strain amplitudes and means for MC-CA-B-J1-CTF-SG-R1-O-4 ... 189
Fig. C.38 – Strain amplitudes and means for MC-CA-B-J1-CTF-SG-R1-O-4 ... 189
Fig. C.40 – Displacement amplitudes and means for MC-CA-B-J1 ... 190
Fig. D.1 – Displacement history for MC-CA-A-J2 ... 192
Fig. D.2 – Load-displacement response for MC-CA-A-J2 ... 192
Fig. D.3 – Phase 1 load-displacement response for MC-CA-A-J2 ... 193
Fig. D.4 – Phase 2 load-displacement response for MC-CA-A-J2 ... 193
Fig. D.5 – Phase 3 load-displacement response for MC-CA-A-J2 ... 194
Fig. D.6 –Moment-total rotation response of MC-CA-A-J2 ... 194
Fig. D.7 –Moment-total beam rotation response of MC-CA-A-J2 ... 195
Fig. D.8 –Moment-total column rotation response of MC-CA-A-J2 ... 195
Fig. D.9 –Moment-total panel zone rotation response of MC-CA-A-J2 ... 196
Fig. D.10 –Moment-total plastic rotation response of MC-CA-A-J2 ... 196
Fig. D.11 –Moment-beam plastic rotation response of MC-CA-A-J2 ... 197
Fig. D.12 –Moment-column plastic rotation response of MC-CA-A-J2 ... 197
Fig. D.13 –Moment- panel zone plastic rotation response of MC-CA-A-J2 ... 198
Fig. D.14 – Load amplitudes and means for MC-CA-A-J2 ... 198
Fig. D.15 – Displacement amplitudes and means for MC-CA-A-J2 ... 199
Fig. D.16 – Strain amplitudes and means for MC-CA-A-J2BTF-SG-R1-I-1 ... 199
Fig. D.17 – Strain amplitudes and means for MC-CA-A-J2BTF-SG-R1-I-5 ... 200
Fig. D.18 – Strain amplitudes and means for MC-CA-A-J2-BTF-SG-R1-I-6 ... 200
Fig. D.19 – Strain amplitudes and means for MC-CA-A-J2-BBF-SG-R1-O-1 ... 201
Fig. D.20 – Strain amplitudes and means for MC-CA-A-J2-BBF-SG-R1-O-2 ... 201
Fig. D.21 – Strain amplitudes and means for MC-CA-A-J2-BBF-SG-R1-O-4 ... 202
Fig. D.22 – Strain amplitudes and means for MC-CA-A-J2-BTF-SG-R3-O-4 ... 202
Fig. D.23 – Strain amplitudes and means for MC-CA-A-J2-BBF-SG-R4-O-4 ... 203
Fig. D.25 – Strain amplitudes and means for MC-CA-A-J2-BBF-SG-R6-O-4 ... 204
Fig. D.26 – Strain amplitudes and means for MC-CA-A-J2-BBF-SG-R1-I-1 ... 204
Fig. D.27 – Strain amplitudes and means for MC-CA-A-J2-BBF-SG-R1-I-2 ... 205
Fig. D.28 – Strain amplitudes and means for MC-CA-A-J2-BBF-SG-R1-I-3 ... 205
Fig. D.29 – Strain amplitudes and means for MC-CA-A-J2-BBF-SG-R1-I-5 ... 206
Fig. D.30 – Strain amplitudes and means for MC-CA-A-J2-BBF-SG-R1-I-5 ... 206
Fig. D.31 – Strain amplitudes and means for MC-CA-A-J2-BBF-SG-R1-I-6 ... 207
Fig. D.32 – Strain amplitudes and means for MC-CA-A-J2-BTF-SG-R4-O-4 ... 207
Fig. D.33 – Strain amplitudes and means for MC-CA-A-J2-BTF-SG-R5-O-4 ... 208
Fig. D.34 – Strain amplitudes and means for MC-CA-A-J2-BTF-SG-R6-O-4 ... 208
Fig. D.35 – Strain amplitudes and means for MC-CA-A-J2-CTB-SG-R1-O-1 ... 209
Fig. D.36 – Strain amplitudes and means for MC-CA-A-J2-CTB-SG-R1-O-2 ... 209
Fig. D.37 – Strain amplitudes and means for MC-CA-A-J2-CTB-SG-R1-O-4 ... 210
Fig. D.38 – Strain amplitudes and means for MC-CA-A-J2-CTB-SG-R1-O-6 ... 210
Fig. D.39 – Strain amplitudes and means for MC-CA-A-J2-CFT-SG-R1-O-1 ... 211
Fig. D.40 – Strain amplitudes and means for MC-CA-A-J2-CFT-SG-R1-O-2 ... 211
Fig. D.41 – Strain amplitudes and means for MC-CA-A-J2-CFT-SG-R1-O-4 ... 212
Fig. D.42 – Strain amplitudes and means for MC-CA-A-J2-CFT-SG-R1-O-6 ... 212
Fig. E.1 – Idealized welded steel moment connection test setup ... 214
Fig. E.2 – True stress-strain plots of A992 beam, A572 Gr,50 column and E70 weld used in the multi linear model for ANSYS simulation ... 216
Fig. E.3 – Experimental and Simulated response of the rising curve of 1.2% cyclic coupon test of A992 material with Chaboche parameters ... 217
Fig. E.5 – Experimental and Simulated response of the four different displacement controlled
hysteresis loops of A572 Gr.50 material with Chaboche parameters. ... 218
Fig. E.6 – Finite element mesh of welded steel moment connection test setup ... 220
Fig. E.7 – Close up view of the mesh near beam-column connection ... 220
Fig. E.7 – SAC Loading Protocol with increasing amplitudes ... 222
Fig. E.7 – Monotonic Loading Response of the full-joint welded connection simulation ... 223
Fig. E.8 – Monotonic Loading Response of the full-joint welded connection simulation ... 223
Fig. E.9 – Cyclic Loading Response of the full-joint welded connection simulation ... 225
Fig. E.10 – Buckling of beam flanges during the cyclic loading simulation of WSMCs ... 226
Fig. E.10 – Axial strain distribution across the width of the flange ... 227
Fig. E.11 – Axial strain variation near the weld with loading amplitude ... 228
Fig. F.1 – Comparison of Strain amplitudes and means for T-CA-A/B-1A-SG-R1-O-2 ... 230
Fig. F.2 – Comparison of Strain amplitudes and means for T-CA-A/B-1A-SG-R1-O-4 ... 230
Fig. F.3 – Comparison of Strain amplitudes and means for T-CA-A/B-1A-SG-R1-O-7 ... 231
Fig. F.4 – Comparison of Strain amplitudes and means for T-CA-A/B-1A-SG-R2-O-4 ... 231
Fig. F.5 – Comparison of Strain amplitudes and means for T-CA-A/B-1A-SG-R3-O-4 ... 232
Fig. F.6 – Comparison of Strain amplitudes and means for T-CA-A/B-1A-SG-R3-O-4 ... 232
Fig. F.7 – Comparison of Strain amplitudes and means for T-CA-A/B-1B-SG-R1-O-4 ... 233
Fig. F.8 – Comparison of Strain amplitudes and means for T-CA-A/B-1B-SG-R1-O-7 ... 233
Fig. F.9 – Comparison of Strain amplitudes and means for T-CA-A/B-1B-SG-R2-O-4 ... 234
Fig. F.10 – Comparison of Strain amplitudes and means for T-CA-A/B-1B-SG-R1-O-5 ... 234
Fig. F.11 – Comparison of Strain amplitudes and means for T-CA-A/B-1B-SG-R1-O-1 ... 235
Fig. F.12 – Comparison of Strain amplitudes and means for T-CA-A/B-2A-SG-R1-O-4 ... 235
Fig. F.13 – Comparison of Strain amplitudes and means for T-CA-A/B-2A-SG-R2-O-4 ... 236
Fig. H.2 Sketch showing the weld sequence of top and bottom flange in T-CA-B-2A/B .... 256
Fig. H.3 Sketch showing the weld sequence of top and bottom flange in T-CA-B-3A/B .... 257
Fig. H.4 Sketch showing the weld sequence of top and bottom flange in T-CA-B-4A/B .... 258
Fig. H.5–Temperature profile during welding of bottom beam flange of MC-CA-A-J2 ... 260
Fig. H.6–Temperature profile during welding of top beam flange of MC-CA-A-J2 ... 260
Fig. H.7–Temperature profile during welding of top beam flange of MC-CA-B-J2 ... 261
Fig. H.8–Temperature profile during welding of bottom beam flange of T-CA-A-1A ... 261
Fig. H.9–Temperature profile during welding of bottom beam flange of T-CA-A-1B ... 262
Fig. H.10–Temperature profile during welding of bottom beam flange of T-CA-B-2A ... 262
LIST OF TABLES
INFLUENCE OF WELD SEQUENCE ON THE SEISMIC FAILURE OF
WELDED STEEL MOMENT CONNECTIONS IN BUILDING
STRUCTURES
CHAPTER 1
INTRODUCTION
1.1 BackgroundAn earthquake is the result of a sudden release of energy in the Earth's crust that
creates seismic waves. Since the beginning of 20th Century there have been major
Earthquakes. Every earthquake provides new lessons for the earthquake engineering
profession. For many years, the basic intent of the building code seismic provisions has been
to provide buildings with an ability to withstand intense ground vibrations without collapse,
but potentially with significant structural damage. In order to accomplish this, one of the
basic principles inherent in modern code provisions is to encourage the use of building
configurations, structural systems, materials and details that are capable of ductile behavior.
A structure is said to behave in a ductile manner if it is capable of withstanding large
inelastic deformations without significant degradation in strength, and without the
development of instability and collapse.
Starting in the 1960s, engineers began to regard welded steel moment-frame buildings
as being among the most ductile systems. Many engineers believed that steel moment-frame
buildings were essentially invulnerable to earthquake-induced structural damage and thought
that should such damage occur, it would be limited to ductile yielding of members and
connections. Earthquake-induced collapse was not believed possible [FEMA 350]. It was
strength and development of instability. Partly as a result of this belief, many large
industrial, commercial and institutional structures employing steel moment-frame systems
were constructed, particularly in the western United States. However, The Northridge
earthquake of January 17, 1994 challenged this paradigm.
In 1988, a prescriptive moment connection design for seismic applications was
adopted by the Uniform Building Code (UBC) based on the research performed by Popov
and Stephen [FEMA 350]. This was later adopted by 1992 AISC Seismic Provisions and
other building codes. The connection was supposed to result in ductile, plastic behavior due
to the formation of a plastic hinge in the beam at the face of the column or in the column
panel zone or by a combination of both. This connection failed to meet its seismic demands
during the Northridge Earthquake in 1994. It was observed that when the hinge developed in
the panel zone, the resulting column deformation resulted in large secondary stresses on the
beam flange to column flange joint which led to brittle failure of the flange connection
[FEMA 350]. When the plastic hinge formed in the beam at the face of the column, large
inelastic strains occurred in and adjacent to the weld metal and the surrounding heat affected
zone, and led to brittle failure [FEMA 350].
The Northridge earthquake of January 17, 1994 with a magnitude of 6.7 struck
southern California on January 17, 1994 at approximately 4:30 a.m. Though it lasted for only
15 seconds, it injured 9,000+ people and left 51 dead along with a $20-40 billion loss of
property ["Northridge Earthquake" 2005]. Many buildings were either severely damaged and
deemed unsafe to occupy or moderately damaged and authorized for "limited use." Though
unexpected cracks at the welded steel moment connections (WSMC). The damaged
buildings ranged from one to 26 stories tall, some still under construction while others were
nearly three decades old. These brittle fractures were observed in the weld between the
bottom beam flange and the column flange as shown in Fig. 1.1(a). In some cases, the cracks
continued through the column flange right above the weld as shown in Fig. 1.1(b). Similar
connection failures were observed in WSMF following the Kobe Earthquake. Discovery of
these unanticipated brittle fractures of framing connections, often with little associated
architectural damage, was alarming to engineers and the building industry. The discovery
also caused some concern that similar, but undiscovered, damage may have occurred in other
buildings affected by past earthquakes. Later investigations confirmed such damage in a
limited number of buildings affected by the 1992 Landers, 1992 Big Bear and 1989 Loma
Prieta earthquakes [FEMA 355E].
a. Fracture at Fused Zone b. Fracture through Column Flange
1.2 Structural Behavior of Welded Steel Moment Frames (WSMFs)
The strength of WSMF relies on the relative strength of the beam as compared to the
column to develop a 'strong column, weak beam' relationship. As the structure is subjected to
lateral forces, the rectangular panels in the structure tend to form parallelograms (Fig. 1.2).
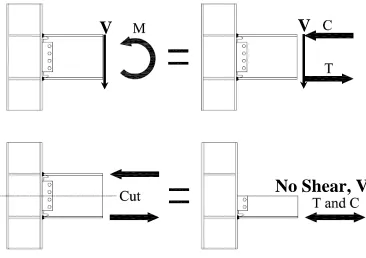
The most severe stresses in the connection assembly occur where the beam joins to the
column. Unfortunately, this is also the weakest location in the assembly. At this location,
bending moments and shear forces in the beam must be transferred to the column through the
combined action of the welded joints between the beam flanges and column flanges and the
shear tab. The combined section properties of these elements, for example the cross sectional
area and section modulus, are typically less than those of the connected beam. As a result,
stresses are locally intensified at this location. However, the connection is assumed to be
strong and ductile enough that the lateral forces will be absorbed in the floor beam, causing
displacement to occur in this region. Steel moment-frame buildings are anticipated to
develop their ductility through the development of yielding in beam-column assemblies at the
beam-column connections. This yielding may take the form of plastic hinging in the beams
(or, less desirable, in the columns), plastic shear deformation in the column panel zones, or
through a combination of these mechanisms (Fig 1.2). The WSMFs, however, did not behave
Fig. 1.2 – Plastic hinge development in steel beams [FEMA350]
In contradiction to the popular belief, brittle factures initiated in the connection at low
levels of plastic demands, and in some cases, the structure remained in the elastic range of
motion during the Northridge and Kobe Earthquakes [FEMA 350]. It was thought that the
pre-Northridge WSMF connections would be capable of sustaining large plastic rotations
without significant strength degradation. The fractures observed typically initiated at the
complete joint penetration (CJP) weld between the bottom beam flange and the column
flange (Fig. 1.3). The cracks propagated along different paths depending on individual joint
configuration [FEMA 350]. The other types of damages observed were mainly failure of
anchor bolts, overall buckling of lateral bracing members leading to local buckling, in some
cases fractures of their ends, and last but not least, crack in the welded beam-to-column
connections [Mazzolani and Piluso, 1997]. According to Federal Emergency Management
Agency (FEMA) and the SAC Joint Venture consisting of Structural Engineers Association
h l’ l Plastic hinges Undeformed frame
of California (SEA), Applied Technology Council (ATC) and California Universities for
Research in Earthquake Engineering (CUREe), the typical WSMF beam-to-column
connection used prior to the Northridge Earthquake had a number of features that rendered it
susceptible to brittle failure.
The damage during Northridge earthquake was typically confined to the lower
flange-to-beam portion of the connection and the top beam flange-to-column flange remained intact
(Fig.1.4). In some cases, the bolted shear tab experienced sheared bolts, tears through the tab
between the bolt holes or tears of the fillet weld from the column face. This type of damage
to the shear tab, however, occurred only in the presence of damage to the bottom beam
flange. The top flanges generally remained intact; this was attributed to the influence of the
slab which generated some composite strengthening to the connection.
Fig. 1.4 Crack Types during 1994 Northridge earthquake [Miller, 1998]
Fig 1.4illustrates eight types of cracks that have been observed in buildings. Of the
eight, seven have their point of initiation at the intersection of the bottom side of the bottom
beam flange to the column flange. This is in the area where the fusible steel backing
intersects the column and beam. Early investigations of the Northridge Earthquake
connection failures identified a number of fractures that appeared to be due to a lack of
through thickness strength of the column flange material [FEMA 350, Miller 1998].
Through thickness strength is critical in large column sections with thick flanges (greater
than 1”) causing Type E, F and G fracture in column flange and web as shown in the Fig 1.4.
After rolling, the thickness of the flange affects the rate of cooling and the strength as the
center cools much slower than the outside faces. After more extensive investigation, it was
identified that most fractures initiated in defects in the complete joint penetration weld root
instead of a result of low through thickness strength in the beam flange causing Type A, B
and C fractures in the weld metal as shown in Fig. 1.4. Base metal toughness is important in
connection. The k-area in wide flanged rolled sections, the intersection of the flange and the
web, has low toughness and may therefore be prone to cracking as a result of welding
operations. Thus, it was recommended that fabricators exercise extreme care when welding
in, near, or to the k-area. Preheat temperatures, pre-welding cleaning, and welding passes
should be executed with precision in order to ensure that the weld is high quality. The basic
configuration of the connection makes it difficult to detect hidden defects at the root of the
welded beam-flange-to-column-flange joints. The backing bar, which was typically left in
place following weld completion, restricts visual observation of the weld root. It has also
been suggested that weld backing bars and runoff tabs should be removed following the
completion of the complete joint penetration welds, and a reinforcing fillet weld should be
placed on the bottom of the beam flange in place of the backing. [FEMA 350]
Further, several other researchers found that under constant, small amplitude tests
where the beam doesn’t develop its full plastic moment capacity, the connection is
susceptible to brittle fractures near the weld metal and heat affected zone [Castiglioni 2005].
Brittle fractures were also observed in connections with strong panel zones prior to the
development of the plastic moment in the beam [Han, et al. 2006].
The investigations concerning the causes of damage in steel buildings during the
Northridge earthquake have given rise to a wide discussion within the international scientific
community. The lack of ductility displayed in the pre-Northridge WSMC prompted research
by FEMA as well as the SAC Joint Venture. The SAC Joint Venture focused research efforts
on many different areas of the welded moment connection. Weld metal matching, base metal
effects, continuity plates, column flange thickness, panel zone deformations, reduced beam
section details, weld access hole details, and column flange through-thickness fractures have
all been investigated. Solutions to overcome the lack of ductility displayed by the connection
are discussed later in section 1.4.
1.3 Testing of Welded Steel Moment Frame (WSMF) Connections
Over the past four decades, academic and industry researchers have tested a variety of
WSMF connections to gauge their expected performance under cyclic lateral loads. These
efforts have involved both physical testing of beam-column joints and theoretical analytical
modeling. Much of the research showed the potential pitfalls of welded construction in
severe earthquake conditions. Interestingly, the observed failures often were considered
insignificant aberrations, or were addressed in the authors’ conclusions as avoidable simply
through proper field inspection. From Popov’s work in 1969 to Engelhard’s in 1993,
fractures at welded joints have been shown to limit the ductility of steel moment frames
[FEMA 355E]. A brief summary of the previous research is tabulated in Table 1.1. Analyses
of the test data used in developing the pre-Northridge connection indicated significant failure
rates during the test programs [Bertero, Anderson, & Krawinkler 1994]. In one series of tests,
the first 6 specimens “failed very abruptly” in the weld or the heat affected zone (HAZ) of
Table 1.1 Milestones in Research of WSMF prior to Northridge Earthquake
Ref.
Date Researcher
# of
tests Description of tests Results
1959
Graham, Sherbourne, and Khabbaz
13
Monotonic gravity tests on fully-welded specimens with 16WF
beams and 8WF or 12WF columns, with emphasis on moment-rotation curves. Did not
address lateral loading. Overall program also included 11 direct pull tests to simulate the tension beam flange pulling on the column
flange.
In all of these, yielding progressed into the
column web, and column flanges were
visibly bent before cracks developed at the
mid-length of the butt weld. As late as the 1989 Ninth Edition, the
AISC specification cited these tests (and
Popov and Pinkney, 1969) in support of welded beam flanges.
1965 Bouwkamp & Clough Popov and Franklin Beedle NA 4 1
In-situ vibration studies of actual steel moment frame buildings to calibrate actual and theoretical period and damping calculations.
Tested beam-column joints with welded flanges or flange plates
(8WF20 beams).
Constructed and tested three story mockup under two cycles of
reverse loading
All showed good ductility with ultimate
failure of welded flanges in weld
1965 Bertero and
Popov 10
Tested the ductility and fatigue resistance of 4-inch deep beams without beam-column connections.
Identified ductility ratios at beam flange bucking and at beam web tearing. Led to recommendations for
compact section requirements.
1969 Popov and Pinkney 24
Static cyclic tests on a variety of beam-column joints (8WF20
beams).
Most of them achieved good ductility, Failures
in welds at beam column joints were observed. Warning made to provide high quality joints to avoid
Table 1.1 Continued
Ref.
Date Researcher
# of
tests Description of tests Results
1972
Bertero, Popov and Krawinkler
2
Tests focused on panel zone deformation (8WF
column, 10B and 14B beams).
Results led to code change to require stiff panel zones. Found that excessive panel zone deformations can lead to kinking at beam flanges
and subsequent weld failure
1972 1973 Popov and Stephen Popov and Bertero 8
Evaluated plastic rotation ductility in beam-column joints (W12 column, W18
and W24 beams) with FCAW E70T-4 welds.
All specimens achieved plastic rotation of .02 to .06 radians but four
of five with bolted welds failed with abrupt fracture. Authors remark on
overall excellent ductility of the WSMF connection. 1985 Popov, Amin, Louie and Stephen 8
Tested one-half size mockups of joints designed for 47-story building with emphasis on panel zone behavior (W18
beams).
Of eight tests only two did not fail in a brittle manner and only three
exceeded 2% plastic rotation. Authors conclude that the adequacy of the connection has been validated.
1987 1988 Popov and Tsai Tsai and Popov 18
Tests evaluated a number of connection details (W18 and W21 beams).
Of the eight specimens typical of Northridge practice, only four achieved beam plastic rotations greater than .01 radians. Two worst performers used E70T-4 electrodes made by an inexperienced welder.
Authors note that weld and fabrication quality are important
factors in overall performance.
1991 Anderson and Linderman 15
Focus on repair of nominal weld cracks associated
with expected ductile performance.
Seven initial specimens tested to failure and eight tests of various
repairs (W16 beams). Initial specimens all failed at less than .03
radians total (elastic + plastic) rotation, several with
Northridge-type fractures. 1993 Schneider, Roeder and Carpenter 5
Tested weak column-strong girder joints (W12
and W14 beams).
Concluded that high ductility can be achieved and that the anticipated excellent performance of WSMF’s is
Table 1.1 Continued
1993 and Husain Engelhard 8
Focus on supplementary web welds with W21 and W24
beams.
Only one of eight tests exceeded 1.5% plastic rotation, with failures
initiating in bottom flange welds. Authors conclude that large variability in performance was of much greater concern than the web
weld issue
1.4 Design Modifications for Improved Ductility
The various parts of welded unreinforced flange-bolted-web (WUF-B) connection
which is commonly used in the construction of WSMF are as shown in the Fig 1.5. Region 1
is the top and bottom flange complete joint penetration groove welds and weld access holes.
Region 2 is the shear tab that is welded to the column flange and bolted to the beam web.
Region 3 is the continuity plates that are parallel to the beam flanges and welded to the
column flanges and the column web. Region 3 is also the doubler plate which lies in the
plane of the column web in the column panel zone, the region between the continuity plates.
It is welded in place with fillet welds on the top and bottom and complete joint penetration
welds on the sides.
Many of the cracks in pre- and post-Northridge connections can be traced back to
stress concentrations in the beam-to-column joint [Barsom, et al. 1999]. Fabrication by
welding may result in stress concentrations in the fabricated joint. Stress concentration may
be caused by the geometry of the welded component or by various imperfections and
crack-like discontinuities in the base metal, weld metal, or heat affected zone (HAZ) [Barsom and
Rolfe, 1999; Barsom and Vecchio, 1997]. These locations usually correspond to fatigue
joint penetration groove welds and at areas where fusion does not occur, behave like cracks
and, depending on the geometry of the weldment, can cause crack initiation and propagation
from the weld root [Barsom and Rolfe, 1999; Barsom and Vecchio, 1997].
Fig. 1.5 – Sketch of a typical welded steel moment connection
The unwelded portion between the backing bar and the column flange acts as a
pre-existing crack (region 1 in Fig. 1.5) and hence the backing bar in the pre-Northridge
connection creates a severe stress concentration. This pre-existing crack promotes earlier
crack initiation and propagation [Nakashima, et al. 1998]. In the post-Northridge connection,
the backing bar has been removed and a reinforcing fillet weld has been placed, as shown in
Fig. 1.6, to eliminate these cracks. This reduces the stress concentration in region 1 in Fig.
the rotational capacity of the connection [Barsom, et al. 1999]. Finite element analysis of
welded joints performed by Chi, et al. (1997) also has shown that the backing bar does create
some notch effect. However, it is far more significant when the backing is left in place since
it obscures the effective detection of significant flaws that may be present in the weld root.
These flaws represent a far more severe notch effect than the backing bar itself. Thus, it is
recommended that the backing bar be removed from the beam bottom flange weld joints to
allow identification and correction of weld root flaws [FEMA 350].
The areas where weld imperfections and weld geometry can cause stress
concentrations that may initiate and propagate fatigue cracks are as shown by the regions 2
and 3 in Figs. 1.5 and 1.6. The majority of fatigue cracks in welded members initiate at a
weld toe or weld termination (weld start and stop) where stress concentrations are high and
weld discontinuities may be present [Barsom, et al. 1999]. Regions 4 and 5 in Figs. 1.5 and
1.6 are fatigue crack initiation sites corresponding to the weld access hole. Region 4 is the
intersection of the beam web and flange at the weld access hole, while region 5 refers to the
roughness of the flame cut weld access hole surface. The severity of the beam-to-web
intersection increases as the angle, Ө, increases and as the radius, r, decreases. A rougher
flame cut surface can also lead to higher stress concentrations. Tests conducted by
Nakashima, et al. [1998] showed that cracks initiated and propagated from the toe of the
conventional weld access hole. The design configuration and geometry of welded
beam-to-column joints also produces high triaxial stresses at the midlength of the complete joint
large defects at the midlength of the weld between the beam bottom flange and the column
flange, where the stresses are the most severe. [Barsom, et al. 1999]
Fig. 1.5 – Sketch of pre- Fig. 1.6 – Sketch of post- Northridge connection Northridge connection
Ricles, et al (2000) conducted a finite element study on nine different configurations
to attend to the failures induced by the stress concentrations. The various variables that were
considered in their investigation included the length of the hole, the length of the flat portion
of the hole, slope of the access hole, and the radius of the access hole. As a consequence of
this study the geometry of the weld access hole was optimized to reduce stress
concentrations. Subsequently, they tested several full scale welded steel moment connections
to failure using the modified weld access hole geometry. No failures occurred at the
Welded steel moment connection fractures from the Northridge earthquake were also
caused by low the weld-to-column interface, however it does not offer any benefit at the
weld-to-beam flange interface where yielding concentrates in the heat affected zone [Dong,
et al. 1999]. The heat affected zone is the portion of base metal that is subjected to high
temperatures during welding, high enough to produce microstructural changes without
melting. The properties of the heat affected zone depend on the base metal, the number of
weld passes, and the welding conditions employed, thus the mechanical properties of the heat
affected zone can vary considerably from point to point. The influence of the base metal
material property changes induced by welding has not drawn much attention yet.
Since the 1994 Northridge Earthquake, a variety of new moment connection designs
to improve the ductility for seismic resistant steel frames have been developed. Among these,
the Reduced Beam Section (RBS) moment connection, also known as the “dogbone”
connection [Plumier 1990] rapidly gained lot of popularity, as it is proved to be economical
providing ductile and reliable performance. Fig. 1.7 depicts a typical RBS moment
Fig. 1.7 – Radius cut reduced beam section (RBS) moment connection
In an RBS connection, portions of the beam flanges are selectively trimmed in the
region adjacent to the beam-to-column connections. Various shapes of the cutouts are
possible, including a constant cut [Engelhard et al 1996 and 1998]; a tapered cut [Chen et al
1996, Zekioglu et al 1997, Iwankiw et al 1996, Uang 1997], a radius cut[Engelhard et al 1996
and 1998, Popov 1998, Tremblay 1997 and Uang 1998] and others. The RBS forces yielding
and hinge formation to occur within the reduced beam section of the beam and limits the
moment that can be developed at the face of the column. By reducing the demands on the
beam flange groove welds and the surrounding base metal regions, the RBS reduced the
possibility of fractures occurring in this vulnerable region. Although the RBS essentially
weakens the beam, its impact on the overall lateral strength and stiffness of a steel moment
frame is generally small. [Engelhard 1999, Deierlein, et al. 1999] Test specimens
incorporating the RBS have exhibited good overall performance with no fractures occurring
significantly reduce inelastic strain demand at critical locations near the beam flange welds
[Engelhard, et al. 2000]. However, some of the European tests have demonstrated problems
with the RBS beam-column connection. Failures have been observed in the welds due to
high stress concentrations, thus RBS is not considered as an acceptable solution by many
[Mazzolani 2000]. The RBS moment connection also results in lower capacity of the beam
due to the reduction in the moment of inertia and hence the section moduli at the reduced
beam section. This could lead to larger members, thus higher material costs. In addition,
because the flanges are cut to form the RBS, the beam is not as stable laterally as the uncut
beam would be. As a result, special attention must be paid to lateral bracing of the flanges at
the reduced beam section. While the RBS connection has shown promise as a means to
eliminate the fatigue cracks at the complete joint penetration welds, this approach to a
solution only treats the symptom of the problem. It eliminates the groove welds as the
weakest link in the connection and creates a failure in the RBS. It does not attempt to
understand or alleviate the fatigue crack problem in welded steel moment connections.
In order to assure plastic hinging, and ductile behavior, a strong column-weak beam
design should be employed [FEMA 350]. The prequalified connection used prior to
Northridge was presumed to result in the formation of a plastic hinge in the beam at the face
of the column or in the column panel zone or as a combination of the two [FEMA 350].
Welded moment connections should be configured to either force the inelastic action, plastic
hinging, away from the face of the column, where performance is less dependent on materials
and workmanship, or employ optimum welded joint design and quality assurance measures.
the beam flanges being welded [FEMA 350]. The majority of successful tests on welded
moment connections have been conducted using either 58 or 70 ksi weld metal, compared to
50 ksi yield strength for typical structural steel [FEMA 350].
1.5 Low-Cycle Fatigue
Aseismic design of steel structures requires, generally, the selection of the energy
dissipation mechanisms, which can be characterized by the combination of stable hysteretic
response and key behavioral parameters of the relevant parts of the skeletal frame. The
energy dissipation capabilities of the whole system basically depend on the hysteretic
behavior of its individual components, such as members andjoints. Structural collapse under
seismic actions is a complex phenomenon generally caused by the interaction of different
effects, namely global and local buckling, cyclic hardening and softening, failure of the
connection, low-cycle fatigue and fracture.However, since structural behavior under seismic
events is usually characterized by small number of cycles, only a few of which involve large
excursions in the plastic range, and the failure under such conditions is conventionally
referred as a “low-cycle fatigue” failure [Bernuzzi et al., 1997]. Japanese researchers Takashi
et al., (2005) investigated the fatigue life of welded beam-column joints with and without the
backing bar and reported low-cycle crack initiation under constant amplitude loading. The
fatigue life of non-backing bar welded connection deteriorated to about 10% to 25% of these
for backing bar [Takashi et al., 2005]. Ten years of research after the Northridge earthquake
have developed modified designs of WSMCs [FEMA-350, FEMA-353]. Most of the
preexisting cracks at backing bars) and weld defects (undercut, voids, slugs and low fracture
toughness) [EERI, 1995]. The design recommendations include removing the backing bar,
back gouging and depositing fillet weld in place of the backing bar, using high toughness
weld materials, modifying the weld access hole, and strengthening the panel zone with
continuity and doubler plates [FEMA 350, FEMA 353, Stojadinovic, et al. 2000, Lee et al.
2000, Ricles, et al., 2000, Lee et al. 2005]. These improvements, however, introduce new
types of low-cycle fatigue crack-induced failures [Barsom and Pellegrino, 1999, Yu et al.,
2000, Uang et al., 2000, Lee et al., 2005]. The failure analysis of the post-Northridge
connection tests conducted at the University of Michigan and Lehigh University
demonstrated that fatigue cracks were initiated either near the bottom weld access hole or the
beam flange weld toe [Barsom and Pellegrino, 1999]. In the University of Michigan tests
89% of the connections showed crack initiation near the weld access hole and 50% showed
crack initiation at the weld toe. In the Lehigh tests, 80% of the fatigue cracks were initiated at
the weld toe. Research needs on weld interface field conditions and low-cycle fatigue failure
mechanisms are identified in the recent commentary on FEMA 350 by the SEAoC
Seismology Committee [SEAoC, 2002], but the issues have not yet drawn much attention.
Research by the European community has also demonstrated localized, low cycle fatigue
fracture mechanisms and concluded that an “exhaustive understanding of the low-cycle
fatigue strength of steel members and joints” is required [Mazzolani, 2000].Connection
failures in the Japanese tests [Nakashima, et al., 1998] occurred at the beam flange weld toe.
However, little work has been done to understand the local failure mechanisms of the welded
failures are initiated from localized, low cycle fatigue cracks near the welds [Barsom, et al.
1999]. One of the objectives of this research is to investigate the influence of local fatigue
mechanisms on inducing brittle failure of welded steel moment connections.
1.6 Motivation
Given that the current engineering trend is moving towards “Performance–Based”
design which emphasizes that the structural design of the structure should meet the inelastic
seismic demands with a reliable global and local performance [Yun et al., 2002, Seismology
Committee, 1999]. It is essential that the cause and mechanism of local failure of welded
steel moment frames (WSMFs) be understood along with the global failure mechanism to
allow WSMFs effectively and reliably meet the seismic demands. Extensive efforts have
been made in providing the guidelines for the design in Steel Construction Manuals
considering the global performance of the structure. However, no emphasis is laid on the
basic correlation between localized member behavior and global structural performance. The
local condition at one location will not dictate the performance of a structure; whereas the
local condition of many structural members does dictate the performance of the entire
structure [Rodgers, et al. 2006]. While many design procedures can predict the performance
of a global structural parameter under prescribed load conditions, those same procedures do
not attempt to correlate these quantities with local structural performance. This is not a
shortcoming of the current guidelines and design procedures; however it is a limitation on
our knowledge of local failure conditions. Post-Northridge researchers have mainly
the brittle failures at the local level were not uncovered. More than ten years of research after
the Northridge earthquake have developed modified designs of welded steel moment frames
(WSMFs) [FEMA-350, FEMA-353]. While test results on the new connections demonstrated
significant improvement with regard to ductility, many post-Northridge welded steel moment
connections (WSMCs) exhibited failure initiated from low-cycle fatigue cracks near the
beam flange weld toe [Suita et al., 1998, Barsom 1999, Stojadinovic, et al., 2000, Ricles et
al., 2000, Yu et al., 2000, Uang et al., 2000]. The weld toe fatigue crack initiation motivated
several investigations on weld material and the outcome was the recommendation of using
high toughness weld material. However, the reason for the weld toe fatigue crack initiation
(covers the major part of the total life) in the post-Northridge design has yet to be
investigated in a rational manner. The Structural Engineers Association of California
(SEAoC) Seismology Committee emphasizes the importance of localized failures, as
indicated in their commentary and recommendation on FEMA 350 [SEAoC, 2002]. The
SEAoC committee identified research needs on weld interface field conditions and low-cycle
fatigue failure mechanisms towards developing fully rational design guidelines. Another
important aspect of characterizing the local failure mechanism is that a steel structure that did
not crack during an earthquake even may not always be safe for continued operation. It may
however accumulate enough fatigue damage due to repeated yielding and may fail
subsequently under service loading or another event.
A research program at NC State demonstrated that the welding sequence, thereby the
welding residual stress, has significant influence on fatigue crack initiation at the weld toe of
sequence, fatigue life can be increased by as much as 90%. The influence of residual stress
on fatigue crack initiation at the weld toe in WSMCs was speculated [Mohr, 1999] but the
failure mechanism is yet to be investigated for WSMCs. Due to the complexity involved in
residual stress calculation, most analyses either do not consider residual stresses or use
simplified methods of analysis [Chi et al., 1997, Matos and Dodds, 2002]. However, Dong
and his coworkers [SAC/BD-99/04] did include detailed residual stress analysis in their
investigations. Their calculations demonstrated that the magnitude of residual stresses in
some locations can be greater than the yield stress of the material. They performed fracture
analysis for crack propagation of preexisting cracks at the backing bars and demonstrated
that the triaxial residual stress greatly reduced the plastic deformation and thus induced
brittle fracture.
The NC State study under the supervision of Hassan explored the weld toe failure
mechanism of piping joints [Lu, 2003, Humphreys, 2004]. A set of cyclic tests on stainless
steel (SS) 304L piping welded joints was conducted. The prescribed loading in the test was
displacement controlled and symmetrical, thus the strain responses measured at the weld toe
of the butt weld joint were expected to be symmetrical. However, the recorded axial strain
gradually increased with each cycle. This phenomenon is known as ratcheting or cyclic
creep. Using our current knowledge base, we cannot explain the strain ratcheting observed
under a displacement-controlled loading. Ratcheting is known to occur in metallic materials
as they undergo inelastic cyclic loading, along the directions of force-controlled loading.
displacement-controlled loading could be influenced by residual stresses near the welded
joints.
In conjunction with the ratcheting phenomenon discovered in the welded piping
joints, welding procedure played a key role in the fatigue life of the joint [Lu, 2003]. Two
different welding procedures were investigated by Lu [2003] for piping joints: quarter circle
welding and full circle welding. For the full circle welding procedure, the joint was welded
in one continuous pass around the outside of the pipe. For the quarter circle welding, the
pipe was welded in four passes that spanned only one quarter of the pipe’s circumference in
each step in a symmetrical manner. The joints were then tested to failure. Each welded joint
failed where the stress concentration was the highest, at the top or bottom toe of the weld.
The full circle welded piping joint was subjected to 300 cycles before failure, whereas the
quarter circle welded joint was subjected to 560 cycles. This same study [Lu, 2003] also
demonstrated the effect of welding on increasing ratcheting strain rate which was attributed
to the presence of residual stress in the piping joint. Different amounts of residual stress
were also shown to be related to the weld sequence. Therefore, the welding procedure can
have a significant effect on the residual stress and thus the fatigue life of a joint.
Ratcheting is known to be demonstrated by metallic materials under inelastic cyclic
loading, along the directions of force-controlled loading – steady or fluctuating [Hassan and
Kyriakides, 1994]. Hence, it is anticipated that the occurrence of ratcheting at the welded
piping joints under displacement-controlled loading could be influenced by its residual
stresses and/or the heterogeneous dislocation substructures. A similar strain response at
recorded axial strains on beam flange in the vicinity of beam-column welded connection at
the first yielding and the end of the cyclic tests, and demonstrated a significant increase in the
accumulated axial strain. The amount of strain accumulated decreases with distance from the
weld interface. They reported both brittle mode fracture and progressive local plastic strain
and hardness increase, it seems like ratcheting response might be contributing factor for the
brittlie failures observed in Northridge. These two observations on localized failures are the
primary sources of motivation of this current research, in which the local failure mechanism
and its influence on the global seismic response of welded steel moment frames is
investigated through and integrated experimental study.
Castiglioni (2005) observed the influence of loading history on the seismic
performance of welded steel moment connections. He conducted several full scale tests on
welded steel moment connections with varying constant amplitude loadings. He observed
through analysis that below a certain amplitude, the majority of the strain accumulates in the
weld resulting in a brittle failure. This observation corresponds to his experimental results.
Table 1 shows that the specimens C3-30, C3-50A, and C3-50B subjected to small amplitudes
failed in a brittle manner. Loads larger than that amplitude, caused the beam to buckle, thus
strain accumulated in the buckled region in the following cycles and a ductile failure
occurred in specimens C3-100, C3-125A, and C3-125B (Table 1). The intermediate
amplitude test, C3-75, failed under a combination of these two mechanisms (Table 1). Fig.
(a) Small amplitude cycles (b) Large amplitude cycles
Fig. 1.8 – Finite element results by Castiglioni [2005]
Each displays the ratcheting phenomena, the accumulation of strain with cycles under
displacement-controlled loading. Fig. 1.8(a) represents the strains when the joint is subjected
to small amplitude cycles. Strain accumulates in the weld rather than in the beam. Fig.
1.8(b) depicts strains from a large amplitude cycle. Once the plastic hinge forms after the
first cycle, the strain in the weld is relieved, while strain accumulates in the plastic hinge in
the beam [Castiglioni, 2005].
Table 1.2 – Summary of Castiglioni [2005] Test Results
Rotation Yield Rotation Ductility Cycles to Failure
Amplitude (θy, 10-6 rad.) Ratio Failure, N Mode
(Δθ, 10-6 rad.) (Δθ/θy)
C3-30 30 11.3 2.7 52 Brittle
C3-50A 50 11.5 4.3 8 Brittle
C3-50B 50 11.3 4.4 10 Brittle
C3-75 75 11.6 6.5 28 Mixed
C3-100 100 10.7 9.4 15 Ductile
C3-125A 125 11.4 11.0 12 Ductile
C3-125B 125 12.0 10.5 7 Ductile