ABSTRACT
PHILLIPS, BRIAN DAVID
. Methods to Predict the Lateral Effect of a Drainage Ditchon Adjacent Wetland Hydrology. (Under the direction of Dr. R. Wayne Skaggs).
Four methods were studied to predict the lateral effect of a drainage ditch on wetland
hydrology – a field method based on threshold drainage conditions, long-term simulations in
both DRAINMOD and WATRCOM, and the approximate method (also known as the Skaggs
Method). As defined in this study, the lateral effect is the width of a strip of land drained
such that it no longer meets the wetland hydrologic criterion as set forth in the U.S. Army Corps of Engineers Wetland Delineation Manual.
Three years (2002 – 2004) of data were collected at field sites located at the Mildred
Woods mitigation site in Edgecombe County, North Carolina and the ABC mitigation site
located in Beaufort County, North Carolina. Hourly water table depths were recorded at
several locations on transects perpendicular to one drainage ditch (1.2 m depth) at Mildred
Woods and a shallow ditch (0.9 m depth) and deep ditch (1.3 m depth) at the ABC site.
Rainfall was recorded at each site and temperature data were collected from nearby weather
stations.
DRAINMOD simulations were performed for a 54-year period for each ditch to
determine the threshold drain spacing, i.e. a spacing associated with water table fluctuations
that would just barley satisfy the wetland hydrologic criterion in one half of the years. Next
DRAINMOD was used with the threshold ditch spacing and depth along with recorded
rainfall data for 2002-2004 to predict the maximum consecutive duration that the water table
for each year the estimated lateral effect was 41 m for Mildred Woods, <3.75 m for the ABC
shallow ditch, and 12 m for the ABC deep ditch.
DRAINMOD and WATRCOM were calibrated for each study transect by comparing
model predicted water table depths and observed water table depths. The calibrated models
were then used to simulate water table depths at each observation well for a 54-year period,
and the results were analyzed to determine the distance from the ditch where the criterion
was satisfied in exactly one-half of the years. Based on these simulation results the lateral
effect was estimated to be 38.6 m for Mildred Woods, <3.75 m for the ABC shallow ditch,
and 18.0 m for the ABC deep ditch. Simulation results with WATRCOM estimated a lateral
effect of 41.5 m for Mildred Woods, and 8.9 m and 20.3 m ABC shallow and deep ditches,
respectively.
Results of the approximate method estimated the lateral effect to be 42.6 m for the
ditch at the Mildred Woods site. This was close to the values obtained from the observed
data and the two simulation models. A lateral effect of 14.1 m was estimated for the ABC
deep ditch using the approximate method. This value is slightly larger than obtained from
the field data, 12 m, 3.9 m less than the value predicted by DRAINMOD, and 6.2 m less than
the value predicted by WATRCOM. The approximate method estimated a lateral effect of
the ABC site shallow ditch of 7.2 m, 1.7 m less than that predicted by WATRCOM, which is
METHODS TO PREDICT THE LATERAL EFFECT OF A
DRAINAGE DITCH ON ADJACENT WETLAND
HYDROLOGY
By
BRIAN DAVID PHILLIPS
A thesis submitted to the Graduate Faculty of North Carolina State University
In partial fulfillment of the Requirements for the Degree of
Master of Science
BIOLOGICAL AND AGRICULTURAL ENGINEERING
Raleigh, NC
2006
APPROVED BY:
___________________________ ___________________________ Dr. R. Wayne Skaggs
Chair of Advisory Committee
Dr. George M. Chescheir Member of Advisory Committee
___________________________ Dr. Michael J. Vepraskas
DEDICATION
To Mom and Dad
Without their love and support during my long academic journey, in no way would I have accomplished so much or developed in to the person I am today.
BIOGRAPHY
Brian D. Phillips was born March 16, 1974 to David and Barbara Phillips. Both
parents grew up in the town of Concord, NC. His dad received his B.S. in Mechanical
Engineering from NCSU in 1972 and is currently the Deputy Supervisor of Shipbuilding
and Repair for the US Navy in Jacksonville, FL. His mom works as an office manager
for a real estate appraiser. Both parents are still happily married and enjoy all the time
they can spare at the beach in Florida.
Brian spent the first 20 years of his life in Newport News, VA. He graduated high
school in 1992 and attended Christopher Newport University from 1992- 1994. He then
spent several years living in the suburbs of Washington DC, and he spent several
semesters attending George Mason University.
He moved to North Carolina in the summer of 1998, enrolled at NCSU in the
spring of 2000, and began working towards his B.S. in Biological and Agricultural
Engineering. Along the route to receiving his B.S., Brian was able to achieve many
successes. He served as President of the NCSU student branch of the American Society
of Agricultural Engineers and the Biological and Agricultural Engineering honor society,
Alpha Epsilon. He received numerous scholarships and awards including the College of
Engineering Senior Award for Leadership.
After graduating Summa Cum Laude in 2003, Brian went on to pursue his M.S. in
Biological and Agricultural Engineering under the direction of Dr. R. Wayne Skaggs.
While there, he worked on developing methods to predict the lateral effect of drainage
ACKNOWLEDGEMENTS
This work is a product of the North Carolina Agricultural Research Service, N.C.
State University, Raleigh. The study was supported by a contract with the North Carolina
Department of Transportation (CTE/NCDOT project No. HWY-0871 and
HWY-2005-21).
I would like to thank first my committee chair, Dr. R. Wayne Skaggs. I
approached Dr. Skaggs about pursuing a M.S. under his direction at the beginning of my
final undergraduate semester. Knowing that I would receive his teaching and mentoring
was the deciding factor for entering into the NC State graduate program. It never ceases
to amaze me at the breadth and command of his knowledge in the areas of agriculture and
environmental engineering. I have had the pleasure of attending conferences and
presentations with Dr. Skaggs, and I am always impressed by the respect others extend to
him.
Dr. Skaggs exhibited extreme patience and generosity during the three years of
my Master’s work. He allowed flexibility in my work schedule and promoted
independence in completing tasks. Completing my thesis took several months longer
than originally planned. Again, Dr. Skaggs was very patient and supportive, and I never
felt he had lost faith in my ability to successfully complete the work.
representatives at the NCDOT. Dr. Skaggs also allowed me to do a DRAINMOD
teaching session at a firm in Raleigh. I look forward to continuing to work on the lateral
effect projects as a research engineer under Dr. Skaggs’ direction. I also look forward to
modeling myself after his image. Although those shoes can never be filled, it is a highly
desirable goal.
I owe thanks to Dr. George “Chip” Chescheir for serving as a committee member
and for all his help along the way to completing this study. Chip was instrumental in
Chapter two of this study and in assisting in the DRAINMOD modeling of my field sites.
I remember Chip sitting with me for several hours during the first attempts at calibration
modeling. Chip’s command of DRAINMOD and his understanding of drainage
processes were greatly appreciated. I also owe thanks to Chip for getting to me a copy of
RAINSIM and for fielding a multitude of general questions about the study and other
projects.
I would like to thank Dr. Michael Vepraskas. Dr. Vepraskas served as the minor
representative on my committee. I first met Dr. Vepraskas in the fall of 2003 while
taking his wetland soils class. I was impressed by his knowledge of wetland soils and by
his dynamic presence in the classroom. Although we only met a few times during my
Master’s program, I am thankful for his constructive input to this study.
Dr. John Parsons passed away during the fall semester of 2005. His passing was a
tremendous loss to the department and to the engineering community. I am very
fortunate to have known Dr. Parsons as a professor during my undergraduate days and to
his help, my knowledge of and efficiency using WATRCOM would not be at the current
level.
Without the next two people, my life in the field and the management of data
would have been very difficult. Wilson Huntley and Jay Frick installed equipment on my
study sites in late 2001, and they continued to monitor the sites until I took over in the
summer of 2003. When I received the data sets from Jay, all spreadsheets for rainfall and
water table were up to date saving me an enormous amount of time compiling early
project data. Jay was also there along the way to answer questions I had regarding the
measurement data. Wilson was always my go to guy for anything related to the field.
Need logger batteries, see Wilson. Need parts for field equipment, see Wilson. Wilson
was also with me to collect soils cores, to perform auger hole tests, and to drill down to
find the impermeable layers. He also showed me how to perform soil tests in the lab. I
am indebted to Jay and Wilson for their help with the study sites and data management.
My good friend, Chad Poole, has been there since my first undergraduate
semester in BAE. It would be easy to argue that my strength as a student and as an
engineer is due in large part to our friendship, our ability to work together, and our
invigorating conversations about life and academics. I place a very high value on my
friendship with Chad. Chad has also been my officemate during the past three years, and
I would like to also thank Dr. Glen Fernandez for providing help with the
DRAINMOD model. Although, Dr. Fernandez left the department at the inception of my
Master’s program, he was always available via phone or email.
To the staff of the BAE department, I say thank you for helping me with the little
things and the big things (paychecks). Thank you for your patience and for working hard
to solve my problems that arose during the past three years. In particular, I would like to
acknowledge Kathy Logan, Heather Gordon, Dorothy Lee, Sherry Li, and Kristel Page.
Finally, I would like to thank the late Dr. Francis J. Hassler for endowing a
fellowship I was fortunate to receive during the 2003-2004 academic year. I had the
pleasure of meeting his wife, Mrs. Oneta Hassler, during an awards banquet for the BAE
department. She is a very wonderful person who insisted on hugging the students rather
than shaking their hands. I am very thankful for the financial support provided by the
TABLE OF CONTENTS
LIST OF TABLES... xi
LIST OF FIGURES... xiii
CHAPTER 1: WETLANDS AND THE LATERAL EFFECT OF ROADSIDE DRAINAGE DITCHES ... 1
INTRODUCTION ... 1
WETLANDS ... 1
HYDROLOGY... 4
HYDROLOGIC CRITERION... 5
HYDROLOGIC MODELING... 6
LATERAL EFFECT ... 8
INTRODUCTION... 8
CURRENT METHODS OF CALCULATING LATERAL EFFECT... 9
APPROXIMATE METHOD MODEL DESCRIPTION... 9
OBJECTIVES... 10
CHAPTER 2: FIELD STUDY... 11
STUDY SITE DESCRIPTION... 11
THE MILDRED WOODS SITE... 14
THE ABCSITE... 16
Shallow Ditch... 17
Deep Ditch ... 17
WEATHER AND HYDROLOGY ... 18
PRECIPITATION... 18
Mildred Woods... 18
ABC Site... 23
TEMPERATURE... 27
Mildred Woods... 27
ABC Site... 28
SUMMARY... 51
CHAPTER 3: HYDROLOGY SIMULATIONS USING DRAINMOD AND WATRCOM... 52
INTRODUCTION ... 52
DRAINMOD MODEL DESCRIPTION... 52
WATER BALANCE... 53
SUBSURFACE DRAINAGE... 55
SURFACE DRAINAGE... 56
EVAPOTRANSPIRATION... 57
INFILTRATION... 59
INPUT PARAMETERS... 59
WATRCOM MODEL DESCRIPTION ... 59
WATER BALANCE... 60
SUBSURFACE DRAINAGE... 61
SURFACE DRAINAGE... 62
EVAPOTRANSPIRATION... 62
INFILTRATION... 63
INPUT PARAMETERS... 64
MODELING INPUT DATA... 64
WEATHER... 64
SOIL PROPERTIES... 65
DRAINMOD SIMULATIONS ... 67
STATISTICAL MEASURES... 67
MILDRED WOODS SITE CALIBRATIONS... 69
ABCSITE CALIBRATIONS... 76
Shallow Ditch... 76
Deep Ditch ... 81
DRAINMODLONG TERM SIMULATION RESULTS... 86
DRAINMODLIMITATIONS... 88
WATRCOM SIMULATIONS... 89
STATISTICAL MEASURES... 89
MILDRED WOODS SITE CALIBRATIONS... 89
ABCSITE CALIBRATIONS... 93
Shallow Ditch... 93
Deep Ditch ... 97
WATRCOMLONG TERM SIMULATION RESULTS... 102
WATRCOMLIMITATIONS... 104
SUMMARY... 104
CHAPTER 4: TESTING THE APPROXIMATE METHOD ... 107
INTRODUCTION ... 107
THEORY... 107
INPUT PARAMETERS... 110
EXAMPLE... 111
CALCULATIONS OF LATERAL EFFECT METHOD FOR FIELD SITES... 113
DISCUSSION... 114
LATERAL EFFECT METHOD LIMITATIONS... 116
SUMMARY... 116
REFERENCES ... 118
APPENDICES ... 123
APPENDIX 1 : DRAINMOD SOIL FILES ... 124
APPENDIX 2 : WATRCOM INPUT FILES ... 127
L
IST OF TABLESChapter 2
TABLE 1. PHYSICAL DIMENSIONS OF DRAINAGE DITCH AT MILDRED WOODS MITIGATION SITE. ... 15
TABLE 2. PHYSICAL DIMENSIONS OF SHALLOW DITCH AT THE ABCMITIGATION SITE... 17
TABLE 3. PHYSICAL DIMENSIONS OF DEEP DITCH AT THE ABCMITIGATION SITE. ... 18
TABLE 4. MONTHLY RAINFALL (MM) AT THE MILDRED WOODS SITE. ... 19
TABLE 5. MONTHLY RAINFALL (MM) AT THE ABCSITE. ... 23
TABLE 6. MONTHLY TEMPERATURE (ºC) AT TARBORO,NC... 28
TABLE 7. MONTHLY TEMPERATURE (ºC) AT BELHAVEN,NC... 29
TABLE 8. SUMMARY OF RESULTS FOR LATERAL EFFECT AT DRAINAGE DITCHES BASED ON 3 YEARS OF OBSERVATIONS. ... 50
Chapter 3 TABLE 1.FINAL DRAINMOD CALIBRATION PARAMETERS FOR MILDRED WOODS. ... 71
TABLE 2.DRAINMOD CALIBRATION STATISTICAL RESULTS FOR MILDRED WOODS. ... 71
TABLE 3. FINAL DRAINMOD CALIBRATION PARAMETERS FOR ABC SITE SHALLOW DITCH. ... 77
TABLE 4. DRAINMOD CALIBRATION STATISTICAL RESULTS FOR ABC SITE SHALLOW DITCH. ... 77
TABLE 5. FINAL DRAINMOD CALIBRATION PARAMETERS FOR ABC SITE DEEP DITCH. ... 82
TABLE 6. DRAINMOD CALIBRATION STATISTICAL RESULTS FOR ABC SITE DEEP DITCH... 83
TABLE 7. DRAINMOD LONG TERM SIMULATION RESULTS. ... 87
TABLE 8. WATRCOM CALIBRATION STATISTICAL RESULTS FOR MILDRED WOODS... 90
TABLE 9. WATRCOM CALIBRATION STATISTICAL RESULTS FOR ABC SITE SHALLOW DITCH. ... 93
TABLE 10. WATRCOM CALIBRATION STATISTICAL RESULTS FOR ABC SITE DEEP DITCH. ... 98
Chapter 4
TABLE 1. APPROXIMATE METHOD INPUTS FOR MILDRED WOODS SITE. ... 111
TABLE 2. INPUTS AND RESULTS FOR CALCULATING LATERAL EFFECT OF DRAINAGE DITCH ON FIELD SITES BY APPROXIMATE METHOD. ... 113
L
IST OFF
IGURESChapter 1
FIGURE 1. SCHEMATIC OF HIGHWAY DITCH SHOWING THE LATERAL EFFECT OF THE DITCH ON WETLAND
HYDROLOGY... 8
CHAPTER 2 FIGURE 1. GENERALIZED VIEW OF A TRANSECT OF WELLS... 12
FIGURE 2. IMAGE OF PULLEY/FLOAT RECORDING SYSTEM SHOWING THE PULLEY, POTENTIOMETER, AND THE DATA LOGGER... 13
FIGURE 3. ARIEL PHOTOGRAPH OF MILDRED WOODS FIELD SITE (1998IR) ... 15
FIGURE 4. ARIEL PHOTOGRAPH OF ABC FIELD SITE (1998IR) ... 16
FIGURE 5. CUMULATIVE RAINFALL FOR MILDRED WOODS SITE (2002 THROUGH 2004)... 19
FIGURE 6. MONTHLY RAINFALL AND LONG TERM AVERAGE RAINFALL FOR MILDRED WOODS SITE... 20
FIGURE 7. MONTHLY, LONG TERM AND 30TH AND 70TH PERCENTILE RAINFALL FOR2002 AT MILDRED WOODS SITE... 21
FIGURE 8. MONTHLY, LONG TERM AND 30TH AND 70TH PERCENTILE RAINFALL FOR 2003 AT MILDRED WOODS SITE... 22
FIGURE 9. MONTHLY, LONG TERM AND 30TH AND 70TH PERCENTILE RAINFALL FOR 2004 AT MILDRED WOODS SITE... 22
FIGURE 10. CUMULATIVE RAINFALL FOR ABCMITIGATION SITE (2002 THROUGH 2004) ... 24
FIGURE 11. MONTHLY RAINFALL AND LONG TERM AVERAGE RAINFALL FOR ABCMITIGATION SITE... 24
FIGURE 12. MONTHLY, LONG TERM, AND 30TH AND 70TH PERCENTILE RAINFALL FOR 2002 AT ABC MITIGATION SITE... 25
FIGURE 13. MONTHLY, LONG TERM, AND 30TH AND 70TH PERCENTILE RAINFALL FOR 2003 AT ABC MITIGATION SITE... 26
FIGURE 14. MONTHLY, LONG TERM, AND 30TH AND 70TH PERCENTILE RAINFALL FOR 2004 AT ABC MITIGATION SITE... 26
FIGURE 15. MONTHLY, LONG TERM, AND 30TH AND 70TH PERCENTILE RAINFALL FOR 2005 AT ABC MITIGATION SITE... 27 FIGURE 16. OBSERVED DAILY WATER TABLE DEPTHS IN WELLS ALONG A TRANSECT PERPENDICULAR TO THE
SHOWN. ALSO SHOWN IS THE WATER LEVEL IN THE DITCH, EXPRESSED AS A DEPTH BELOW THE SOIL SURFACE AT THE TOP OF THE BANK... 30 FIGURE 17. OBSERVED DAILY WATER TABLE DEPTHS IN WELLS ALONG A TRANSECT PERPENDICULAR TO THE
DITCH AT THE MILDRED WOODS SITE FOR 2003. DISTANCES OF THE WELLS FROM THE DITCH ARE SHOWN. ALSO SHOWN IS THE WATER LEVEL IN THE DITCH, EXPRESSED AS A DEPTH BELOW THE SOIL SURFACE AT THE TOP OF THE BANK... 31
FIGURE 18. OBSERVED DAILY WATER TABLE DEPTHS IN WELLS ALONG A TRANSECT PERPENDICULAR TO THE DITCH AT THE MILDRED WOODS SITE FOR 2004. DISTANCES OF THE WELLS FROM THE DITCH ARE SHOWN. ALSO SHOWN IS THE WATER LEVEL IN THE DITCH, EXPRESSED AS A DEPTH BELOW THE SOIL SURFACE AT THE TOP OF THE BANK... 32
FIGURE 19. BEAVER DAM AT MILDRED WOODS SITE LATE 2003... 33
FIGURE 20. WATER TABLE DEPTHS OBSERVED ON SPECIFIC DATES IN WELLS ALONG A TRANSECT PERPENDICULAR TO THE DITCH AT THE MILDRED WOODS SITE IN 2003. DISTANCES OF THE WELLS FROM THE DITCH ARE SHOWN. ALSO SHOWN IS THE WATER LEVEL IN THE DITCH, EXPRESSED AS A DEPTH BELOW THE SOIL SURFACE AT THE TOP OF THE BANK... 34 FIGURE 21. OBSERVED DAILY WATER TABLE DEPTHS IN WELLS ALONG A TRANSECT PERPENDICULAR TO THE
SHALLOW DITCH AT THE ABCMITIGATION SITE FOR 2002. DISTANCES OF THE WELLS FROM THE DITCH ARE SHOWN. ALSO SHOWN IS THE WATER LEVEL IN THE DITCH, EXPRESSED AS A DEPTH BELOW THE SOIL SURFACE AT THE TOP OF THE BANK... 36
FIGURE 22. OBSERVED DAILY WATER TABLE DEPTHS IN WELLS ALONG A TRANSECT PERPENDICULAR TO THE SHALLOW DITCH AT THE ABCMITIGATION SITE FOR 2003. DISTANCES OF THE WELLS FROM THE DITCH ARE SHOWN. ALSO SHOWN IS THE WATER LEVEL IN THE DITCH, EXPRESSED AS A DEPTH BELOW THE SOIL SURFACE AT THE TOP OF THE BANK... 37
FIGURE 23. OBSERVED DAILY WATER TABLE DEPTHS IN WELLS ALONG A TRANSECT PERPENDICULAR TO THE SHALLOW DITCH AT THE ABCMITIGATION SITE FOR 2004. DISTANCES OF THE WELLS FROM THE DITCH ARE SHOWN. ALSO SHOWN IS THE WATER LEVEL IN THE DITCH, EXPRESSED AS A DEPTH BELOW THE SOIL SURFACE AT THE TOP OF THE BANK... 38 FIGURE 24. WATER TABLE DEPTHS OBSERVED ON SPECIFIC DATES IN WELLS ALONG A TRANSECT
PERPENDICULAR TO THE SHALLOW DITCH AT THE ABCMITIGATION SITE IN 2003. DISTANCES OF THE WELLS FROM THE DITCH ARE SHOWN. ALSO SHOWN IS THE WATER LEVEL IN THE DITCH, EXPRESSED AS A DEPTH BELOW THE SOIL SURFACE AT THE TOP OF THE BANK... 39
SURFACE AT THE TOP OF THE BANK... 42
FIGURE 28. WATER TABLE DEPTHS OBSERVED ON SPECIFIC DATES IN WELLS ALONG A TRANSECT PERPENDICULAR TO THE DEEP DITCH AT THE ABCMITIGATION SITE IN 2003. DISTANCES OF THE WELLS FROM THE DITCH ARE SHOWN. ALSO SHOWN IS THE WATER LEVEL IN THE DITCH, EXPRESSED AS A DEPTH BELOW THE SOIL SURFACE AT THE TOP OF THE BANK... 43
FIGURE 29. OBSERVED AND PREDICTED NUMBER OF CONSECUTIVE DAYS WHEN WATER TABLE WAS WITHIN 30 CM OF THE SURFACE DURING THE GROWING SEASON PLOTTED BY YEAR FOR THE MILDRED WOODS SITE. THRESHOLD CONDITIONS REPRESENT THE NUMBER OF DAYS IN EACH YEAR FOR A SITE THAT BARELY SATISFIES THE WETLAND HYDROLOGIC CRITERION... 45
FIGURE 30. OBSERVED CONSECUTIVE NUMBER OF DAYS WITH WATER TABLE WITHIN 30 CM OF SURFACE AS A FUNCTION OF DISTANCE FROM DITCH AT THE MILDRED WOODS SITE. THRESHOLD (TH) VALUES ARE THE NUMBER OF CONSECUTIVE DAYS THAT A SITE BARELY SATISFIES THE CRITERION WOULD HAVE IN EACH YEAR. ... 46
FIGURE 31. OBSERVED AND PREDICTED NUMBER OF CONSECUTIVE DAYS WHEN WATER TABLE WAS WITHIN 30 CM OF THE SURFACE DURING THE GROWING SEASON PLOTTED BY YEAR FOR THE SHALLOW DITCH AT THE ABC SITE. THRESHOLD CONDITIONS REPRESENT THE NUMBER OF DAYS IN EACH YEAR FOR A SITE THAT BARELY SATISFIES THE WETLAND HYDROLOGIC CRITERION... 48
FIGURE 32. OBSERVED AND PREDICTED NUMBER OF CONSECUTIVE DAYS WHEN WATER TABLE WAS WITHIN 30 CM OF THE SURFACE DURING THE GROWING SEASON PLOTTED BY YEAR FOR THE DEEP DITCH AT THE ABC SITE. THRESHOLD CONDITIONS REPRESENT THE NUMBER OF DAYS IN EACH YEAR FOR A SITE THAT BARELY SATISFIES THE WETLAND HYDROLOGIC CRITERION... 49
FIGURE 33. OBSERVED CONSECUTIVE NUMBER OF DAYS WITH WATER TABLE WITHIN 30 CM OF SURFACE AS A FUNCTION OF DISTANCE FROM DITCH AT THE DEEP DITCH AT THE ABC SITE. THRESHOLD (TH) VALUES ARE THE NUMBER OF CONSECUTIVE DAYS THAT A SITE BARELY SATISFIES THE CRITERION WOULD HAVE IN EACH YEAR... 50
CHAPTER 3 FIGURE 1. SCHEMATIC OF DRAINAGE SYSTEM DESCRIBED IN DRAINMOD ... 53
FIGURE 2. SCHEMATIC OF WATER FLOWS SIMULATED IN WATRCOM(ADOPTED FROM PARSONS AND TRETTIN,2001)... 60
FIGURE 3.WATER TABLE PLOT FOR DRAINMOD CALIBRATION AT MILDRED WOODS 7.5 M WELL... 73
FIGURE 4.WATER TABLE PLOT FOR DRAINMOD CALIBRATION AT MILDRED WOODS 15 M WELL... 73
FIGURE 5.WATER TABLE PLOT FOR DRAINMOD CALIBRATION AT MILDRED WOODS 30 M WELL... 74
FIGURE 6.WATER TABLE PLOT FOR DRAINMOD CALIBRATION AT MILDRED WOODS 45 M WELL... 74
FIGURE 7.WATER TABLE PLOT FOR DRAINMOD CALIBRATION AT MILDRED WOODS 60 M WELL... 75
FIGURE 9. WATER TABLE PLOT FOR DRAINMOD CALIBRATION AT ABCSHALLOW DITCH 3.75 M WELL. 78
FIGURE 10. WATER TABLE PLOT FOR DRAINMOD CALIBRATION AT ABCSHALLOW DITCH 7.5 M WELL. 79
FIGURE 11. WATER TABLE PLOT FOR DRAINMOD CALIBRATION AT ABCSHALLOW DITCH 11.25 M WELL
... 79
FIGURE 12. WATER TABLE PLOT FOR DRAINMOD CALIBRATION AT ABCSHALLOW DITCH 15 M WELL.. 80
FIGURE 13. WATER TABLE PLOT FOR DRAINMOD CALIBRATION AT ABCSHALLOW DITCH 22.5 M WELL80 FIGURE 14. WATER TABLE PLOT FOR DRAINMOD CALIBRATION AT ABCSHALLOW DITCH 30 M WELL.. 81
FIGURE 15. WATER TABLE PLOT FOR DRAINMOD CALIBRATION AT ABCDEEP DITCH 7.5 M WELL... 83
FIGURE 16. WATER TABLE PLOT FOR DRAINMOD CALIBRATION AT ABCDEEP DITCH 15 M WELL... 84
FIGURE 17. WATER TABLE PLOT FOR DRAINMOD CALIBRATION AT ABCDEEP DITCH 22.5 M WELL... 84
FIGURE 18. WATER TABLE PLOT FOR DRAINMOD CALIBRATION AT ABCDEEP DITCH 30 M WELL... 85
FIGURE 19. WATER TABLE PLOT FOR DRAINMOD CALIBRATION AT ABCDEEP DITCH 45 M WELL... 85
FIGURE 20. WATER TABLE PLOT FOR DRAINMOD CALIBRATION AT ABCDEEP DITCH 60 M WELL... 86
FIGURE 21. WATER TABLE PLOT FOR WATRCOM CALIBRATION AT MILDRED WOODS 15 M WELL... 90
FIGURE 22. WATER TABLE PLOT FOR WATRCOM CALIBRATION AT MILDRED WOODS 30 M WELL... 91
FIGURE 23. WATER TABLE PLOT FOR WATRCOM CALIBRATION AT MILDRED WOODS 45 M WELL... 91
FIGURE 24. WATER TABLE PLOT FOR WATRCOM CALIBRATION AT MILDRED WOODS 60 M WELL... 92
FIGURE 25. WATER TABLE PLOT FOR WATRCOM CALIBRATION AT MILDRED WOODS 90 M WELL... 92
FIGURE 34. WATER TABLE PLOT FOR WATRCOM CALIBRATION AT ABC DEEP DITCH 22.5 M WELL... 100
FIGURE 35. WATER TABLE PLOT FOR WATRCOM CALIBRATION AT ABC DEEP DITCH 30 M WELL... 100
FIGURE 36. WATER TABLE PLOT FOR WATRCOM CALIBRATION AT ABC DEEP DITCH 45 M WELL... 101
FIGURE 37. WATER TABLE PLOT FOR WATRCOM CALIBRATION AT ABC DEEP DITCH 60 M WELL... 101
CHAPTER 4 FIGURE 1. PREDICTED MIDPOINT WATER TABLE DRAWDOWN FOR THRESHOLD DITCH SPACINGS OF 5NORTH CAROLINA SOILS. RESULTS ARE FOR A DITCH DEPTH OF 120 CM AND SURFACE STORAGE OF S=2.5 CM. TIME FOR WATER TABLE DRAWDOWN OF 25 CM (T25) IS APPROXIMATELY 6.4 DAYS FOR ALL SOILS (AFTER SKAGGS ET AL.,2005). ... 108
C
HAPTER1:
W
ETLANDS AND THEL
ATERAL EFFECT OFR
OADSIDED
RAINAGED
ITCHESIntroduction
The valuable functions of wetlands have become widely acknowledged. Mitsch
and Gooselink (2000a) grouped the values of wetlands in to three main categories:
population – e.g. waterfowl, timber, fish; ecosystem- e.g. flood mitigation, storm
abatement; and biosphere – e.g. nitrogen and phosphorus cycle. Highway construction
adjacent to wetlands is often unavoidable. Roadside drainage systems associated with
these highways can affect the adjacent wetland hydrology. When wetland hydrologic
impact/loss is unavoidable, compensatory mitigation is required (MOA
NCDENR/USACE, 1998). The hydrologic impact of drainage ditches on these adjacent
wetland is of importance in quantifying losses and calculating mitigation fees
(WRP/EEP, 2006). That is, a sound method of quantifying the lateral effect of a roadside
ditch is required to complete the mitigation permit process, where lateral effect is defined
as the width of a strip of land drained such that it no longer meets the wetland hydrologic
criterion (USACE, 1987). An approximate method was developed by Skaggs et al.
concluded that a wetland can be defined as follows:
“A wetland is an ecosystem that depends on constant or recurrent, shallow inundation or saturation at or near the surface of the substrate. The minimum essential characteristic of a wetland are recurrent , sustained inundation or saturation at or near the surface and the presence of physical, chemical, and biological features reflective of recurrent , sustained inundation or saturation. Common diagnostic features of wetlands are hydric soils and hydrophytic
vegetation. These features will be present except where specific physiochemical, biotic, or anthropogenic factors have removed them or prevented their
development” (NRC, 1995).
Wetlands can be areas that receive direct overland flow, groundwater discharge or are
purely driven by local precipitation, such as a Pocosin (Richardson, 2003; Skaggs et al.
1991). Geographically, wetlands can vary from depressional areas, i.e. Carolina bays
(Sharitz, 2003; Lide et al., 1995), coastal lowlands subject to flooding, to interstream
divides. The common property of all wetlands is the frequency of saturation or
inundation. Wetland benefits to society and to ecosystems have been studied extensively.
Benefits include, but are not limited to, waterfowl and wildlife habitat, flood control and
attenuation, ground and surface water remediation and water quality enhancement,
wastewater treatment, and shoreline protection.
There are approximately 103 million acres of wetlands in the United States (Dahl
and Johnson, 1991). Approximately 6 million acres of these wetlands are located in
North Carolina; with approximately 95% residing east of I-95 (Dahl and Allord, 1997).
Mitsch and Gooselink (2000b) estimate that 53% of the original wetlands in the United
States have been lost, primarily for agricultural uses. The conflict between the rights of
landowners and the responsibility of public and ecological protection has led to several
404 of the Clean Water Act (CWA). Through section 404 the federal government
regulates wetlands by controlling discharge of dredged or fill materials into wetlands.
The United States Army Corps of Engineers (COE), under authority of the
Environmental Protection Agency (EPA), enforces compliance with Section 404 of the
CWA (33 CFR 320). In 1987, the COE’s Environmental Laboratory issued a Wetlands
Delineation Manual, commonly referred to as the 87 Manual, (USACE, 1987) as a guide
to define a jurisdictional wetland. A wetland is defined in the 87 Manual as follows:
“Those areas that are inundated or saturated by surface or ground water at a frequency and duration sufficient to support, and that under normal circumstances do support, a prevalence of vegetation typically adapted for life in saturated soil conditions. Wetlands generally include swamps, marshes, bogs, and similar areas”.
The 87 Manual delineation procedures state that a wetland must possess three main
parameters: wetland hydrology, hydric soils, and a dominance of hydrophytic vegetation.
Wetland hydrology is the most difficult parameter to quantify and the most important
parameter in wetland development (Owen, 1995; NRC, 2001). In order to determine the
existence of wetland hydrology from on-site measurements, long-term water table data
are required. Often these records are either unavailable or are available for only short
durations. Therefore, regulatory judgment as to whether a site meets the jurisdictional
hydric soil indicators does not necessarily indicate the presence of a wetland, because
wetland hydrology and hydrophytic plants must also be present. Relict conditions,
retaining features of a hydric soil, can remain on a site 30 years after removal of wetland
hydrology (Richardson and Vepraskas, 2001). Nor does the presence of some
hydrophytic plants indicate a wetland. The 87 Manual dictates that a prevalence of
hydrophytic vegetation occur in order to satisfy the wetland plant criteria. This value can
be difficult to quantify. The presence of hydrophytic vegetation is determined by site
visits. Procedures for determining dominant vegetation can be found in the 87 Manual.
Janisch and Molstad (2004) gives an overview of the procedure of hydrophytic vegetation
wetland delineation methodology and states:
“To determine dominant plant species, all species present at each data point, starting with the most abundant, were ranked in decreasing order for each stratum. Those species that cumulatively exceed 50% of the dominance for each stratum, plus any additional species making at least 20% of the total dominance measure qualified as dominant species.”
Hydrology
The hydrology of a wetland is the most significant factor in wetland development.
Hydrology influences the vegetation on a site and the chemical interactions that
determine whether hydric soils will be developed or sustained. Wetland hydrology is
usually the most difficult parameter of the criterion to quantify. This difficulty can lie in
the inability to fully measure hydrologic parameters or in errors associated with those
measurements (LaBaugh, 1986). Cole and Brooks (2000) stated that “…developing an
understanding of wetland hydrology that is free from site-specific constraints remains one
the primary driving force in the formation and maintenance of wetlands, wetland
hydrology has become a research area of high importance.” The hydrologic processes
that determine the saturation / inundation regime of a wetland are determined by inputs
and losses. Clearly defining the magnitude of the components of a water budget (water
balance) for a specific wetland is a mathematical relationship that is often difficult to
quantify. Additions to a wetland are mostly precipitation, groundwater discharge,
overland flow, and subsurface flow (i.e. ditches). Losses from a wetland are mostly
evapotranspiration (ET), groundwater recharge, or surface outflow. A wetland water
balance can be defined as follows:
P + SI + GI – ET – SO- GO = ΔSTORO [1] where P = precipitation, SI = surface flow in, GI = subsurface flow in, GO = subsurface
outflow, ET = evapotranspiration, and ΔSTORO = the change in water stored.
Dooge (1975) suggested breaking the component of surface flow into fluxes due to
streamflow and nonchannelized flow.
Hydrologic Criterion
For the purposes of this study, the wetland hydrologic criterion will be based on
air temperature of 28F in the fall (50% probability of recurrence). Data for the growing
season length can be found in published Natural Resources Conservation Service (NRCS)
county soil surveys or from the internet at the NRCS Water and Climate Center.
“Normally” is defined for this purpose by the COE as occurring on average in one-half or
more of the years tested. The continuous period (5% to 12.5%) is generally taken as 5%
for determination of presence of wetlands in North Carolina.
Although long-term water table fluctuations in a wetland may meet the required
criterion definition, year-to-year variability makes it difficult to determine wetland
hydrologic status. Due to annual variations in weather, a site may fail to meet the
wetland hydrology criterion during one year or during a period of two or more
consecutive years. Attempts to qualify a site as a jurisdictional wetland based on
short-term hydrologic records can fail to provide accurate results. Point data, data taken at one
or several times, of ground water levels will not provide adequate reliability as to the
presence of wetland hydrology. Shaffer et al. (2000) suggest that a minimum of once
daily water table measurements are required to accurately determine whether a site meets
the hydrologic criterion.
Hydrologic Modeling
Of importance to this research is the effect of losses to wetland hydrology due to
human disturbance. In particular, the influence of drainage ditches on adjacent wetland
hydrology. In equation [1], this is considered a subsurface loss. Drainage ditches are
used to manage water levels in an effort to, among other things, improve crop yields,
the losses due to drainage ditches, the ability to simulate subsurface water movement is
required. Water balance simulation models have been developed to predict effects of
drainage systems on trafficability and crop yields (Skaggs, 1999; Evans and Fausey,
1999). Examples are DRAINMOD (Skaggs, 1978) and WATRCOM (Parsons et al.,
1991a), which are commonly used to predict the effect of ditches on water table
fluctuations. DRAINMOD was developed to predict the response of the water table due
to surface and subsurface water management options (conventional drainage, controlled
drainage, subirrigation). Of interest was the water table response at a point midway
between two ditches (or tile drains). WATRCOM was developed to predict water table
response to a system of irregular spaced drainage ditches. Other water balance models
have been developed specifically to predict the hydrology of wetlands. Restrepo et al.
(1998) integrated a wetland simulation model for MODFLOW that adjusted overland
flow and ET for wetlands. FLATWOODS (Sun et al., 1998) and WETLANDS (Mansell
et al., 2000) were developed to examine the hydrologic impact of silviculture practices in
forested wetlands in the lower Southeast United States. All hydrologic models attempt to
quantify the components of water balance equation [1] for a particular point on the
landscape or for a generalized area. Differences exist among the various models in the
numerical methods for calculating subsurface water fluxes in the saturated and
Lateral Effect
Introduction
Drainage systems can impact adjacent lands. When drainage ditches are located
adjacent to wetlands, the hydrology of the wetland will likely be modified to some extent.
The lateral effect of a drainage ditch, as shown in Figure 1, will be defined as follows:
“The width of a strip of land which is drained such that it no longer satisfies the wetland hydrologic criterion.”
Lateral Effect
Wetland Highway
Water Tab
le
Restrictive Layer
Figure 1. Schematic of highway ditch showing the lateral effect of the ditch on wetland hydrology
It is important to note that this definition defines the lateral effect purely based on
the hydrologic impact of the drainage ditch as it relates to the jurisdictional wetland
hydrologic criterion. Non-hydrological methods of determining the lateral effect have
been explored. Hayes and Vepraskas (2000) proposed a method to determine the lateral
effect of a drainage ditch based on Fe mass concentrations. Their research showed that
subsurface drainage due to the ditch caused a migration of Fe masses in a direction
transect leading away from the ditch, one can predict the lateral effect of the ditch. It
must be noted that the definition of lateral effect, as it applies to this study, is solely
based on the influence on the hydrology of the adjacent wetland hydrology. Analysis of
the influence of a drainage ditch on modifications to the functional values of the wetland
is neither analyzed nor researched in the scope of this thesis.
Current Methods of Calculating Lateral Effect
One method that has been used to determine the lateral effect of a roadside
drainage ditch on adjacent wetland hydrology is based on the “Scope and Effect Guide”
for North Carolina hydric soils (NRCS, 1998). The guide groups together soils of similar
soil properties and estimates the lateral effect of a particular drainage ditch depth / soil
group combination. The method is based on the ellipse equation for flow to parallel
drains with several simplifying assumptions. It does not consider the fact that the lateral
effect of a single ditch is less than that of parallel drains. Effects of surface depressional
storage are neglected in the guide.
saturated profile with the water table coincident with the surface. DRAINMOD
simulation analyses showed that sites barely satisfying the wetland hydrologic criterion
will have drainage intensities that provide water table drawdown from the surface to a
depth of 25 cm in a specific time. This threshold draw down time, T25, was found to
depend moderately on ditch depth but was nearly constant among soils having a wide
range of profile transmissivities and drainable porosities. T25 was found to depend
strongly on surface depressional storage, decreasing as surface storage increased. T25
also depended strongly on location, which affects both the growing season and weather
variables. Once the T25 values are determined, published solutions for water table
drawdown due to a single drain (Skaggs, 1976) can be used to estimate the lateral effect
of a drainage ditch or subsurface drain on wetland hydrology. This method is currently
being employed by the NCDOT to predict the lateral impact of borrow pits. The purpose
of this study was to test the validity of the method.
Objectives
1. Collect water table, climate, and soil data from three well transects located near
drainage ditches adjacent to wetlands.
2. Determine the lateral effect (location of boundary between upland and wetland
conditions) for each transect, based on field data.
3. Predict the lateral effect of the drainage ditches using long term simulations with
calibrated models
4. Compare lateral effects predicted by the approximate (Skaggs) method with
values determined from field data and from long term calibrated model
C
HAPTER2:
F
IELDS
TUDYStudy Site Description
Field testing of the method was conducted at two wetland mitigation sites in
Eastern North Carolina. These sites are managed by the North Carolina Department of
Transportation’s Office of Natural Environment. The first study site is located in
Edgecombe County at Mildred Woods Mitigation Site (NCDOT Natural System Unit
Monitoring Report 2001 Mildred Woods, 2001; 35.87 N, 77.48 W), approximately five
kilometers east of Tarboro. The second study site is located in the town of Pinetown,
Beaufort County at the ABC Mitigation Site (NCDOT Natural System Unit Monitoring
Report 2002 ABC, 2002; 35.62 N, 76.86 W).
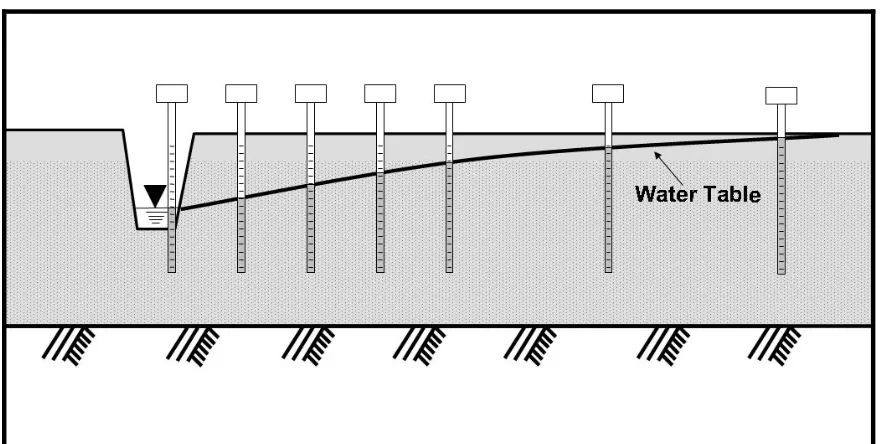
Transects of seven water table wells were installed perpendicular to drainage
ditches at the sites. A graphical depiction of the wells along a generalized transect is
shown in Figure 1. Two transects were installed at the ABC site and one transect was
installed at the Mildred Woods site. Lengths of the transects and distances between the
wells vary depending on the ditch dimensions and the soil type adjacent to each ditch.
Both sites were instrumented in late 2001 with data collection beginning at the start of
Figure 1. Generalized view of a transect of wells
Five of the seven water table wells were equipped with automatic recording
mechanisms and the water levels in the remaining two wells were measured manually.
Both manual and recording wells were used to determine water table depth. The wells
consisted of slotted 4-inch diameter PVC pipe installed to a depth of 1.5 to 2.0 meters.
Weatherproof boxes were placed atop recording wells. Elevations, in reference to the
ditch bottom, were recorded at the top of the well and at ground surface.
The recording mechanisms consist of a float/counterweight pulley system coupled
to a potentiometer (Figure 2). Voltages through the potentiometer were monitored and
recorded by a data logger (Onset Computer Corporation HOBO H8 Logger) on an hourly
basis. Water table depth was determined by a calibrated relationship between water table
Figure 2. Image of pulley/float recording system showing the pulley, potentiometer, and the data logger
Collection of data from the field involved visiting each site on a regular basis,
usually every two to four weeks depending on weather conditions. Depth to the water
table was measured manually and recorded at each of the seven wells on each transect.
and measured water table depth for each recording water table well. These calibration
equations were then used to convert the hourly measured voltage data to hourly water
table depths.
One manual rain gage and one recording rain gage were located at each study site.
The fifteen centimeter (six inch) diameter recording tipping bucket rain gage (Onset
Computer Corporation) was calibrated to 0.254 mm (0.01 inch) depth of precipitation per
tip. The time of each tip of the bucket was recorded by a logger (Onset Computer
Corporation HOBO Event Logger). During each field visit, the manual rain gage was
read and then reset and the data from the automatic recording rain gage downloaded. The
reading from the manual rain gage was compared to the total rainfall recorded by the
automatic rain gage and the data adjusted as necessary.
The Mildred Woods Site
The Mildred Woods Mitigation Site was constructed in 1995 and is approximately
240 hectares (NCDOT Natural System Unit Monitoring Report 2001 Mildred Woods,
2001). One transect of wells was installed on the site as shown in Figure 3. The drainage
ditch runs north to south at the location of the transect. The ditch dimensions at that point
are shown in Table 1. Transect wells are located at 0 (located in the ditch), 7.5, 15, 30,
45, 60, and 90 meters away from the ditch. The wells located at 7.5 and 90 meters were
manual observation wells (i.e. no recording mechanism). Wells located at 0, 15, 30, 45,
Table 1. Physical dimensions of drainage ditch at Mildred Woods Mitigation Site.
Mildred Woods Site
Top Width 9.1 m
Bottom Width 6.1 m
Depth 1.2 m
Side Slopes 2:1
Profile Depth 4.8 m
Normal Depth Water in Ditch 0.9 m
drained soil. Auger hole tests to determine lateral hydraulic conductivity (van Beers,
1970) were performed on site in March 2004. Soil cores were collected in April 2004 to
determine soil-water characteristics (soil water retention curves) and vertical hydraulic
conductivity (Klute, 1986).
The ABC Site
The ABC Mitigation Site was constructed in 2001 and is approximately 75
hectares (NCDOT Natural System Unit Monitoring Report 2002 ABC, 2002). As part of
the field testing of the method, two transects of wells were installed on the site as shown
in Figure 4. Two main ditches are located on the ABC site. A shallow ditch is located on
the western edge and runs north to south. A deeper ditch is located on the Northern side
and runs east to west.
Shallow Ditch
Observation wells on a perpendicular to the shallow ditch were at 0 (in the
ditch), 3.75, 7.5, 11.25, 15, 22.5, and 30 meters away from the ditch. The well located 30
meters was a manual well (i.e. no recording mechanism). The remaining wells were
instrumented with recording mechanisms. Dimensions of the shallow ditch are listed in
Table 2.
Table 2. Physical dimensions of shallow ditch at the ABC Mitigation Site.
ABC Site Shallow Ditch
Top Width 2.3 m
Bottom Width 1 m
Depth 0.9 m
Side Slopes 6 : 7
Profile Depth 6.4 m
Normal Depth Water in Ditch 0.8 m
Deep Ditch
Observation wells on the deep ditch transect were at 0 (in the ditch), 7.5, 15, 22.5,
30, 45, and 60 m away from the deep ditch. The wells located at 7.5, 60 meters were
Table 3. Physical dimensions of deep ditch at the ABC Mitigation Site.
ABC Site Deep Ditch
Top Width 4 m
Bottom Width 1.3 m
Depth 1.3 m
Side Slopes 1 : 1
Profile Depth 6.4 m
Normal Depth Water in Ditch 1.25 m
The dominant soil series in the transect areas is Leaf (fine, mixed, active, thermic
Typic Albaquults). The Leaf series is a poorly drained soil. Auger hole tests to
determine lateral hydraulic conductivity (van Beers, 1970) were performed on site in
March 2004. Soil cores were collected in April 2004 to determine soil-water
characteristics (soil water retention curves) and vertical hydraulic conductivity (Klute,
1986).
Weather and Hydrology
Precipitation
Mildred Woods
The annual rainfall for the study period ranged from 1110 mm in 2004 to 1418
mm in 2003 (Table 4, Figures 5 and 6). Annual rainfall for 2002 was somewhat larger
than the long-term average annual rainfall (1157 mm) measured at the COOP weather
station in Tarboro, NC. Year-to-year variability of rainfall for each month was greater on
example, rainfall for July ranged from 65 mm in 2004 to 216 mm for 2002 compared to
the long-term average of 113 mm. High year-to-year variability of monthly rainfall
amounts is typical for Eastern North Carolina and this variability causes difficulty in
determining hydrological status of wetlands.
Table 4. Monthly rainfall (mm) at the Mildred Woods Site.
Jan Feb Mar April May June July Aug Sept Oct Nov Dec Annual Mildred Woods
2002 139 38 108 36 32 62 216 140 136 171 116 96 1290 2003 45 131 97 151 135 44 148 191 207 104 44 122 1418 2004 29 80 53 73 125 152 65 244 126 54 79 31 1110
Avg
(3yrs) 71 83 86 87 97 86 143 191 156 110 80 83 1272 Avg
(30yrs) 108 90 107 78 95 95 113 122 125 81 65 78 1157
2002- 2004 Cumulative Daily Rainfall Mildred Woods Mitigation Site, Edgecombe County, North Carolina
600 800 1000 1200 1400 1600
mulat
ive Rainf
a
ll (
m
m
)
2003
2002 - 2004 Monthly Rainfall
Mildred Woods Mitigation Site, Edgecombe County, North Carolina
0 50 100 150 200 250 Janu ary Febr uary Ma
rch April May
June July Augu st Sep tem ber Oct ober Nove mbe r Dece mb er Month Ra inf a ll ( m m) 2002 2003 2004 Average
Figure 6. Monthly rainfall and long term average rainfall for Mildred Woods site
Short-term wetland determinations often define normal rainfall during a given
month as any rainfall amount between the 30th and 70th percentiles for that month (see Figures 7 to 9) (Sprecher and Warne, 2000). Hunt et al. (2001) showed that defining
normal rainfall in this way, and using observed water table data during months satisfying
this definition for normal rainfall, resulted in errors that were biased toward defining
wetland sites as upland. For example, as shown in Figure 8, the July 2003 rainfall was
greater than the 70th percentile and would be considered wetter than normal month. However, the water table at the farthest well from the ditch only recorded a water table
that was within 30 cm of the surface for 5 consecutive days. Therefore if a determination
of wetland hydrology would have been made during this month, the site would have been
are included in this study, but results indicate that the hydrologic status of a potential
wetland site should be based on long-term water table records and/or projections.
2002 Monthly Rainfall
Mildred Woods Mitigation Site, Edgecombe County, North Carolina
0 50 100 150 200 250 Janu ary Febr uary Marc h
April May June July Augu st Septe mber Oct ober Nove mb er Dece mb er Month Ra inf a ll ( m m) 2002 Average 30th Percentile 70th percentile
2003 Monthly Rainfall
Mildred Woods Mitigation Site, Edgecombe County, North Carolina
0 50 100 150 200 250 Janu ary Febr uary Ma
rch April May
June July Augu st Septe mber Oct ober Nove mb er Dece mb er Month Ra inf a ll ( m m) 2003 Average 30th Percentile 70th percentile
Figure 8. Monthly, long term and 30th and 70th percentile rainfall for 2003 at Mildred Woods site
2004 Monthly Rainfall
Mildred Woods Mitigation Site, Edgecombe County, North Carolina
0 50 100 150 200 250 300 Janu ary Febr uary Marc h Apri l
May Jun e July Augu st Septe mbe r Oct ober Nove mbe r Dece mb er Month R a in fal l (mm) 2004 Average 30th Percentile 70th percentile
ABC Site
The annual rainfall for the study period ranged from 1098 mm in 2004 to 1556
mm in 2003 (Table 5, Figure 10). Annual rainfall for two of the three years was below
the long-term average annual rainfall (1226 cm) measured at the COOP weather station
in Belhaven, NC. As at the Mildred Woods site, year-to-year variability of rainfall for
each month was greater on a percentage basis than year-to-year variability of annual
rainfall (Figure 11). For example, rainfall for September ranged from 89 mm in 2002 to
252 mm in 2003 compared to the long-term average of 129 mm. September is typically a
month with high year-to-year variability of monthly rainfall amounts since it is in the
peak of the hurricane season.
Table 5. Monthly rainfall (mm) at the ABC Site.
Jan Feb Mar April May June July Aug Sept Oct Nov Dec Annual ABC
2002 122 50 167 70 56 72 75 145 89 104 125 96 1171 2003 19 121 111 141 222 34 174 133 252 107 72 170 1556 2004 44 98 52 104 95 150 46 196 132 47 90 46 1098 2005 60 58 131 93 116 84 -- -- -- -- -- -- -- Avg (3
or 4 yrs)
61 58 131 115 122 85 98 158 157 86 96 104 1275
Avg
2002 - 2005 Cumulative Daily Rainfall
ABC Mitigation Site, Beaufort County, North Carolina
0 200 400 600 800 1000 1200 1400 1600 1800
0 50 100 150 200 250 300 350
Day of Year
Cum u lat ive Rain fall ( m m ) 2003 2004 2002 2005 AVERAGE
Figure 10. Cumulative rainfall for ABC Mitigation site (2002 through 2004)
Monthly Rainfall
ABC Mitigation Site, Beaufort County, North Carolina
0 50 100 150 200 250 Janu ary Feb
ruary March Apri l
May Jun e July Aug ust Sep tem ber Octo ber Novemb er Dece mber Month R a in fa ll (m m) 2002 2003 2004 2005 Average
Figures 12 to 15 show comparisons of monthly rainfall to long-term averages as well as
the 30th and 70th percentiles
2002 Rainfall
ABC Mitigation Site, Beaufort County, North Carolina
0 50 100 150 200 250 Janu ary Febr uary Marc h
April May June July Augu st Septe mber Oct ober Nove mb er Dece mb er Month Ra inf a ll ( m m) 2002 Average 30th Percentile 70th percentile
2003 Rainfall
ABC Mitigation Site, Beaufort County, North Carolina
0 50 100 150 200 250 300 Janu ary Febr uary Ma
rch April May
June Ju ly Augu st Septe mber Oct ober Nove mb er De cemb er Month Ra inf a ll ( m m) 2003 Average 30th Percentile 70th percentile
Figure 13. Monthly, long term, and 30th and 70th percentile rainfall for 2003 at ABC Mitigation site
2004 Rainfall
ABC Mitigation Site, Beaufort County, North Carolina
0 50 100 150 200 250 Janu ary Febr uary Ma
rch April May
June July Augu st Septe mber Oct ober No vemb er Dece mb er Month Ra inf a ll ( m m) 2004 Average 30th Percentile 70th percentile
2005 Rainfall
ABC Mitigation Site, Beaufort County, North Carolina
0 20 40 60 80 100 120 140
January February March April May
Month
R
a
in
fal
l (mm)
2005 Average 30th Percentile 70th percentile
Figure 15. Monthly, long term, and 30th and 70th percentile rainfall for 2005 at ABC Mitigation site
Temperature
Mildred Woods
On site temperature was not recorded for this project. Temperature data were
required for simulation purposes and were obtained from the COOP weather station in
Table 6. Monthly temperature (ºC) at Tarboro, NC.
Jan Feb Mar April May June July Aug Sept Oct Nov Dec Tarboro, NC
2002 Max 11.7 14.4 17.3 24.3 26.1 31.2 32.2 32.1 28.0 21.8 15.3 10.5 Min -0.6 0.5 4.0 10.1 12.2 18.7 20.8 20.1 18.2 12.3 3.9 -0.8 2003 Max 7.0 10.3 17.5 20.2 24.2 28.9 30.5 30.6 27.2 21.4 20.8 11.7 Min -3.3 -0.2 5.8 8.7 14.4 18.4 20.9 21.7 16.9 9.7 7.3 -1.0 2004 Max 8.9 10.3 17.5 22.2 28.1 29.5 31.4 28.9 26.9 21.6 18.8 12.3 Min -2.8 -0.8 4.1 8.7 16.8 19.4 21.6 19.5 17.6 11.3 5.5 -0.8 Avg
(3yrs)
Max 9.2 11.7 17.4 22.2 26.1 29.9 31.4 30.5 27.4 21.6 18.3 11.5
Min -2.2 -0.2 4.6 9.2 14.5 18.8 21.1 20.4 17.6 11.1 5.6 -0.9 Avg
(30yrs) Max 10.0 11.5 16.1 20.8 25.3 29.2 31.3 30.6 27.7 22.4 17.2 12.2 Min -2.1 -1.5 2.7 6.9 12.9 17.6 20.3 19.3 15.7 8.7 3.4 -0.2
ABC Site
On site temperature was not recorded for this project. Again, temperature data
were required for simulation purposes and were collected from the COOP weather station
in Belhaven, NC. Monthly averages for the study years and for the long-term period
(1971 to 2000) are shown in Table 7. As expected, variability exists for each month
when compared to long-term averages. Analyses of data past May of 2005 were not
Table 7. Monthly temperature (ºC) at Belhaven, NC.
Jan Feb Mar April May June July Aug Sept Oct Nov Dec Belhaven, NC
2002 Max 14.2 15.6 19.4 24.2 26.1 30.1 31.8 31.3 27.9 22.7 16.8 11.6 Min 2.0 2.6 5.9 12.0 13.7 19.1 21.7 20.6 18.8 13.5 5.5 1.1 2003 Max 9.1 12.0 19.1 21.2 24.7 29.3 31.3 30.6 27.6 22.4 21.8 12.5
Min -1.6 1.2 7.1 9.9 15.0 19.8 22.4 22.5 17.2 10.8 8.1 0.1 2004 Max 10.4 11.5 17.4 22.8 28.9 30.1 31.5 28.6 27.3 22.7 18.5 13.5
Min -1.3 0.4 4.6 10.4 17.8 20.4 21.8 19.5 18.5 11.3 6.0 1.5 2005 Max 12.2 13.2 14.9 21.7 24.8 -- -- -- -- -- -- --
Min 1.5 1.6 3.5 9.3 12.5 -- -- -- -- -- -- --
Avg
(3yrs) Max 11.5 13.1 17.7 22.5 26.1 29.7 31.5 30.2 27.6 22.6 19.0 12.5 Min 0.2 1.5 5.3 10.4 14.8 19.7 22.0 20.9 18.2 11.9 6.5 0.9 Avg
(30yrs) Max 11.7 13.8 17.8 23.0 26.4 29.9 31.8 30.7 28.2 23.0 18.4 13.2 Min 0.9 2.4 5.5 10.0 14.6 19.1 21.4 20.4 17.3 10.6 6.6 2.2
Water Table
Mildred Woods
Water table depths measured at the Mildred Woods site fluctuated with rainfall
events and evapotranspiration (ET). Water table depths ranged from 1.3 to 1.5 meters in
June of 2002 (Figure 16) to at or above the soil surface after rainfall events, particularly
depths at the 15 m well were rarely less than 30 cm deep, while water table depths at the
45 and 90 m wells were frequently less than 30 cm deep.
The water level in the ditch (presented in Figures 16 to 18 as depth below the soil
surface at the top of the bank) also fluctuated with rainfall and ET; however, ditch levels
fluctuated over a tighter range (0.45 m to 1.5 m) than the water table depths measured on
the transects (0.0 to 1.5 m). The water level in the ditch was usually between 0.8 and 1.0
m below the top of the bank.
-0.3 0.0 0.3 0.6 0.9 1.2 1.5 1.8 2.1
0 30 60 90 120 150 180 210 240 270 300 330 360
Day of Year
W
a
te
r T
a
bl
e D
e
pth
(
m
)
30 cm Line Soil Surface
Ditch 90 m
45 m
15 m
Figure 16. Observed daily water table depths in wells along a transect perpendicular to the ditch at the Mildred Woods site for 2002. Distances of the wells from the ditch are shown. Also shown is the water
-0.3 0.0 0.3 0.6 0.9 1.2 1.5 1.8 2.1
0 30 60 90 120 150 180 210 240 270 300 330 360
Day of Year
W
a
te
r T
a
bl
e D
e
pth
(
m
)
Soil Surface
30 cm Line
Ditch 15 m
45 m
90 m
Figure 17. Observed daily water table depths in wells along a transect perpendicular to the ditch at the Mildred Woods site for 2003. Distances of the wells from the ditch are shown. Also shown is the water
-0.3 0.0 0.3 0.6 0.9 1.2 1.5 1.8 2.1
0 30 60 90 120 150 180 210 240 270 300 330 360
Day of Year
Wat
er T
a
bl
e De
pth (
m
)
Soil Surface
30 cm Line
Ditch 15 m
45 m
90 m
Figure 18. Observed daily water table depths in wells along a transect perpendicular to the ditch at the Mildred Woods site for 2004. Distances of the wells from the ditch are shown. Also shown is the water
level in the ditch, expressed as a depth below the soil surface at the top of the bank.
There were periods during the 3-year study when the water level in the ditch was
impacted by beaver dams (Figure 19). The beaver dam resulted in an additional 30 cm of
head in the upstream portion (nearest well transect) of the ditch (i.e. the water level in the
Figure 19. Beaver dam at Mildred Woods site late 2003
Beaver activity is evident in water table data taken during late 2002 (Figure 16)
and late 2003 (Figure 17). During much of this period, the level in the ditch was 0.6 to
0.7 m below the top of the bank. The water level in the ditch would likely influence the
water table depths measured in the well transects, particularly in the wells close to the
relatively flat. These results indicate that the lateral effect of the ditch is between 30 and
45 m for this site. The water table shape near the ditch sometimes differed from the
theoretical shape (see Nov. 11, Figure 20), but this was likely due to the fluctuating water
level in the ditch. The theory assumes a constant water level in the ditch, so these
differences are not surprising. Normal fluctuations of the ditch water levels caused by
rainfall and ET would likely not affect the methods developed in the study. A rise in
ditch water levels caused by beaver dams, however, is less variable and would greatly
affect the accuracy of the methods. In this case, the effective depth to the water level in
the ditch would be decreased and the lateral effect would be less than that predicted by
the methods. The water table shape on Jul 31 occurred when the water table fell below
the water level in the ditch during high ET summer conditions.
0.0 0.2 0.4 0.6 0.8 1.0 1.2 1.4 1.6
0 10 20 30 40 50 60 70 80 90 100
Distance from Ditch (m)
Water
T
a
ble El
e
vation
(m)
Nov. 11 Mar. 31
Sep. 30
Jul. 31 GROUND
Jul. 8
Figure 20. Water table depths observed on specific dates in wells along a transect perpendicular to the ditch at the Mildred Woods site in 2003. Distances of the wells from the ditch are shown. Also shown is
ABC Site
Shallow Ditch
Water table depths measured on the shallow ditch transect at the ABC mitigation
site fluctuated with rainfall events and evapotranspiration (ET). Water table depths
ranged from 1.0 to1.2 meters in August of 2002 (Figure 21) to at or above the soil surface
after rainfall events particularly during the winter months (Figures 21 to 23). Water table
depth generally decreased as the distance of the monitoring well from the ditch increased.
For most of the observations, the water table was deepest at 3.75 m and shallowest at 30
m. The water table depths at wells 11.25 and 15 m from the ditch were usually between
those at 3.75 and 30 m. Water table depths were often less than 30 cm deep for all of the
wells in this transect.
The water level in the ditch (presented in Figures 21 to 23 as depth below the soil
surface at the top of the bank) fluctuated with rainfall and ET; however, ditch levels
fluctuated over a tighter range (0.6 m to 1.2 m) than the water table depths measured on
the transects (0.0 to 1.2 m). There was no evidence of beaver activity in the ditch during
the study period. The measured fluctuations of the water level in the ditch was not likely
-0.3 0.0 0.3 0.6 0.9 1.2 1.5 1.8 2.1
0 30 60 90 120 150 180 210 240 270 300 330 360
Day of Year
Wa
ter
Ta
ble
Dep
th
(m
)
Data missing for Ditch
Soil Surface
30 cm Line
11.25 m 15 m
3.75 m 30 m
Ditch
Figure 21. Observed daily water table depths in wells along a transect perpendicular to the shallow ditch at the ABC Mitigation site for 2002. Distances of the wells from the ditch are shown. Also shown is the
-0.3 0.0 0.3 0.6 0.9 1.2 1.5 1.8 2.1
0 30 60 90 120 150 180 210 240 270 300 330 360
Day of Year
Water
Ta
ble
Depth
(m)
Soil Surface
30 cm Line
Ditch
30 m 15 m
11.25 m 3.75 m
Figure 22. Observed daily water table depths in wells along a transect perpendicular to the shallow ditch at the ABC Mitigation site for 2003. Distances of the wells from the ditch are shown. Also shown is the
-0.3 0.0 0.3 0.6 0.9 1.2 1.5 1.8 2.1
0 30 60 90 120 150 180 210 240 270 300 330 360
Day of Year
W
a
te
r Tab
le Dept
h (m
)
Soil Surface
30 cm Line
Ditch
30 m 15 m
11.25 m 3.75 m
Figure 23. Observed daily water table depths in wells along a transect perpendicular to the shallow ditch at the ABC Mitigation site for 2004. Distances of the wells from the ditch are shown. Also shown is the
water level in the ditch, expressed as a depth below the soil surface at the top of the bank.
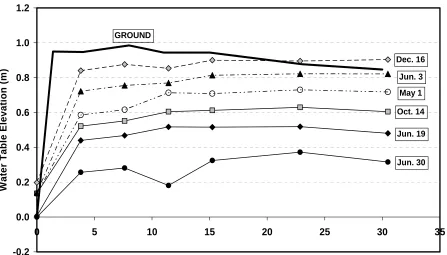
Water table elevations (expressed in Figure 24 as elevation above the bottom of the
ditch) increased with the distance of the well from the ditch for the first two wells (3.75
m and 7.5 m); however, differences in water table depths between 3.75 and 7.5 m were
very small. The water table was mostly flat from 7.5 m to 30 m. Based on these data, it
appears that the lateral effect of the ditch is less than 7.5 m, and possibly less than 3.75
m. The shape of the water table was consistent with the theoretical shape shown in
Figure 1, but no points were available to define the shape of the at distances less than
3.75 m from the ditch. Fluctuations of the ditch water levels caused by rainfall and ET
installed between the ditch and the 3.75 m well, an effect of the ditch fluctuations might
have been observed.
-0.2 0.0 0.2 0.4 0.6 0.8 1.0 1.2
0 5 10 15 20 25 30 35
Distance from Ditch (m)
W
a
te
r Table E
levation
(m
)
GROUND
Oct. 14 Jun. 19 Jun. 30 Dec. 16 Jun. 3 May 1
Figure 24. Water table depths observed on specific dates in wells along a transect perpendicular to the shallow ditch at the ABC Mitigation site in 2003. Distances of the wells from the ditch are shown. Also
shown is the water level in the ditch, expressed as a depth below the soil surface at the top of the bank.
Deep Ditch
m. The water table depths at 15 and 22.5 m were usually between those at 7.5 and 45 m.
Water table depths at the 7.5 m well were rarely less than 30 cm deep, while water table
depths at the 22.5 and 45 m wells were frequently less than 30 cm deep.
-0.3 0.0 0.3 0.6 0.9 1.2 1.5 1.8 2.1
0 30 60 90 120 150 180 210 240 270 300 330 360
Day of Year
Wa
ter
Ta
ble
Dep
th
(
m
)
Data missing for Ditch
Soil Surface
30 cm Line
Ditch 15 m
7.5 m
45 m
22.5 m
Figure 25. Observed daily water table depths in wells along a transect perpendicular to the deep ditch at the ABC Mitigation site for 2002. Distances of the wells from the ditch are shown. Also shown is the