Process Parameters Optimization of
Aluminium by Grey –Taguchi Methodology
during AWJM Process
Saikat Kumar Kuila
1, Goutam Kumar Bose
2Assistant Professor, Department of Mechanical Engineering, Modern Institute of Engineering and Technology, Bandel,
West Bengal, India1
Professor, Department of Mechanical Engineering, Haldia Institute of Technology, Haldia, West Bengal, India2
ABSTRACT: Present paper attempts to select the significant process parameters by combining Taguchi and Grey Taguchi methodology while machining of Aluminium by AWJM. Different process parameters like pressure, feed rate, standoff distance and abrasive flow in three different levels are selected for optimization with two contravene responses, higher MRR and lower Ra by a single parametric combination. For Design of experiment L9 orthogonal array is
prepared to set the input significant parameters for final product and also the Grey Relational Analysis is calculated for better optimization purpose also different combinations of the factors are ranked on basis of grey relational grade.
KEYWORDS: AWJM, MRR, Ra, S/N Ratio, ANOVA, Grey Relational Analysis
I. INTRODUCTION
The growing need of stringent requirements of customized product calls for alternative yet superior materials to be used for different applications commensurable with the intended use. However their processing becomes difficult by conventional means and requires other types of machining. In field of non-traditional machining Abrasive water-jet machining (AWJM) stand superior to its conventional counterpart. [1] Although, the process is primarily intended for improving material removal rate (MRR) of the work, researchers are also contemplating on enhanced surface finish simultaneously to reduce cycle time. AWJ Machining uses water jet of high pressure and velocity along with abrasive particles to erode the target material. [2] AWJM has the advantage of achieving higher quality of cut without any micro-cracking weakening when compared to other similar processes. However, higher MRR causes higher surface roughness (Ra) that has detrimental consequences on the performance. The present paper investigates effects of process variables on material removal rate and surface roughness experienced during AWJ machining and tries to get an optimal or near optimal process variables combination so as to satisfy the two conflicting responses concurrently.[3] The experiment is carried out while machining Aluminium by garnet sand (abrasive) and water. The experiment is planned as per Taguchi L9 orthogonal array. [4] The study focused at effects of jet pressure, abrasive flow, stand - off distance, and feed rate on the responses. Three different levels of each parameter are considered for the purpose of experimentation. Signal to Noise (S/N) ratio is performed along with Analysis of Variance (ANOVA) to predict the significance of the chosen parameters. [5]Both the objective being conflicting in nature, it is very difficult to achieve them simultaneously by a single set of process variables. [6] GRA is applied to establish a set of process variables that yields high MRR and low surface roughness.
II.THE TAGUCHI METHOD AND GREY RELATIONAL ANALYSIS
overall S/N ratio by suitable transformation function. Such problems however, can be solved successfully following Grey Relational Analysis (GRA). The grey system theory was proposed by Deng in 1980's and it is widely used for analyzing a system in which the model is uncertain or the information is incomplete implying a combination of known and unknown information's. [9] Lin recommended low level of cutting speed, feed and depth of cut to enhance tool life and to reduce cutting speed and surface roughness during turning of S45C steel by P20 tungsten carbide inserts [10].
III.PLAN OF EXPERIMENT
In this paper an experimental study has been carried out on a specimen of Aluminum material to optimize the machining parameters of AWJM for maximum MRR and minimum Ra using Taguchi methodology following GRA. During machining of Aluminum materials by AWJM, MRR and Ra have got different grades of importance. In case of machining operation MRR is given more priority than Ra. These contravene response parameters require different
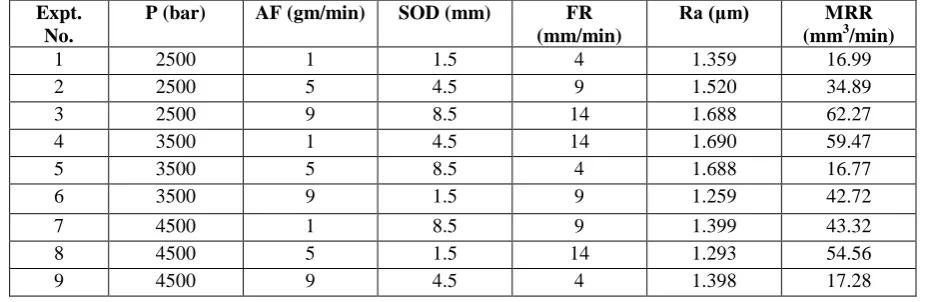
levels setting of the machining parameters for their optimization. So proper machining parameter set up for simultaneous optimization of the responses is critical. Three different process parameters levels i.e. Pressure (P) (levels: 2500, 3500, 4500 bar), Abrasive Flow (AF) (levels: 1, 5, 9 gm/min), Stand of Distance (SOD) (level: 1.5, 4.5, 8.5 mm), Feed Rate (FR) (level: 4, 9, 14 mm/min) are selected as input and combinations are varied in conformance with L9 orthogonal array. Other factors like types of type of abrasives, nozzle diameter, type of nozzle materials etc., which may affect the measured performance are kept constant during experimentation. In the course of the experiment, an AWJ machine (NANOJET 1212) was used which utilized Garnet sand (80 mesh size) as the abrasive and de-mineralized water as the carrier. The main component of the AWJM is the high-pressure pump which is capable of pumping water at pressures up to 6000 bars. The water is transported through special high-pressure tubing which is partially flexible allowing the movements of the cutting heads. The head consists of a pneumatically controlled needle valve and a nozzle tube, at the end of which, a special cones fits a jewel (Sapphire) orifice (3/8‟‟dia) mounted on a nut. Water jet velocities of Mach 2-3 can be achieved. For abrasive applications, beneath the water orifice, an abrasive head is used for mixing the sand with high pressure water. A CNC controller governs the movement of the cutting head. The work piece of size, (1m × 1m × 0.360m) is placed on a grid above the water tank, which serves the purpose of disbursing and capturing the energy of the jet upon exiting the work piece. The work pieces are cleaned properly before and after each machining run and the respective weights are taken by an electronic weighing machine (make: Mettler Toledo; Model no-AG285) of accuracy 0.0002 mg. The surface roughness is measured using Perthometer-M1, of Mahr Gmbh make. For each combination three trials were performed and average is computed for analysis. The experimental layout is shown in TableI.
TABLE .1.
PARAMETRIC COMBINATION FOR EXPERIMENTAL RUN AND RESPONSES
Expt. No.
P (bar) AF (gm/min) SOD (mm) FR (mm/min)
Ra (μm) MRR (mm3/min)
1 2500 1 1.5 4 1.359 16.99
2 2500 5 4.5 9 1.520 34.89
3 2500 9 8.5 14 1.688 62.27
4 3500 1 4.5 14 1.690 59.47
5 3500 5 8.5 4 1.688 16.77
6 3500 9 1.5 9 1.259 42.72
7 4500 1 8.5 9 1.399 43.32
8 4500 5 1.5 14 1.293 54.56
IV.ANALYSIS USING TAGUCHI METHODOLOGY
ANOVA is a statistical technique that helps estimate the significance of variables by variance ratio (F value) and to compute % contribution of each factor. The result analysis is carried out by statistical software MINITAB, version 13
V.ANALYSIS OF TEST RESULTS FOR MRR
The Signal to Noise ratio (S/N) analysis for MRR (mm3/min) is carried out on the basis of „larger is the better‟ option. The corresponding S/N ratio is expressed as:
n
i MRR
n 1 2 10
1
1 1 log 10
(1)
S/N ratio values for MRR are shown in Table II.
TABLE II
S/N RATIOS FOR MRR
Level Pressure Abrasive Flow SOD Feed Rate
1 25.3419 22.1748 22.2983 24.4727
2 25.1573 28.4909 28.9774 20.4061
3 24.6133 24.4468 23.8368 30.2338
Delta 0.7286 6.3161 6.6791 9.8277
Rank 4 3 2 1
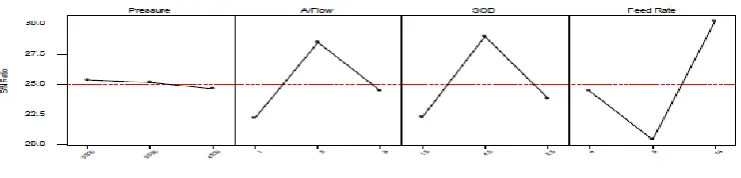
From the S/N ratio graph as shown in Figure 1, it is observed that the MRR will be maximum at P1- AF2- SOD2-FR3., i.e.
at 2500 bar of pressure, 5 gm/min of abrasive flow, 4.5 mm of S.O.D and 14 mm/min of feed rate.
Fig.1 S/N Ratio for MRR.
It is revealed from the graph that when pressure increases MRR decreases. With increase in pressure the MRR decreases because at high pressure the contact time between abrasive particles and work surface becomes less. When abrasive flow rate increases MRR primarily increases and then decreases. At high abrasive flow the mass flow rate of the abrasive particle decreases which results in lowering of MRR. Again with the increase in the SOD values the MRR initially increases and then decreases. At low SOD the abrasive particles and the chips formed comes in between the work and the nozzle thus providing hindrance to the metal removal, but as the SOD increases the P.E of the particles increase and they strike the surface and move away along with the chip formed thus exposing fresh layers of work material. Finally when the feed rate increases then the MRR initially decreases and with further increase in feed rate MRR increases sharply. At lower feed rate the abrasive jet impinges perpendicularly on the work piece. But when high feed rate is employed the resultant jet velocity strikes the work piece obliquely, thereby increasing the width of cut which eventually enhances the MRR.
TABLE III
ANOVA FOR MRR
VI. ANALYSIS OF TEST RESULTS FOR Ra
The Signal to noise ratio (S/N) analysis for Ra (micron) is modelled on the basis of „smaller is the better‟. The corresponding S/N ratio is expressed as:
n
i a
R
n 1
2 10
2
1 log 10
(2)
S/N ratio values for Ra are shown in Table IV.
TABLE IV
S/N RATIOS OF Ra
The S/N ratio graph is shown in Figure 2. It is observed that the surface roughness will be minimum at the parametric combination of P3 – AF1 – S1 – FR2 i.e. at 4500 N/m2 of pressure, 1 gm/min of abrasive flow, 1.5 mm of S.O.D and 9
mm/min of feed rate.
Fig.2 S/N Ratio for Ra
By studying the graph it is understood that with the increase in pressure surface finish decreases then steadily increases this is due to the fact that with the increase in pressure abrasive particles clean the ductile work surface during impact. When abrasive flow increases the surface finish first decreases and then increases. With increase in the abrasive flow rate the unevenness of the surface gets increased. Further with the increase in the SOD values the surface finish gradually decreases. This is due to the fact that with the increase in the SOD values the striking force of the abrasive particles lessens thus reducing the polishing action. Again with increase in the feed rate values the surface roughness decreases and then increases sharply. With the increase in the feed rate the abrasive particle gets very less time for abrasion of the work surface during machining which results in the decrease in Ra values. ANOVA for Surface
So
urc
e
D O F
Seq. sum of square
Adj. Sum of square
Adj. mean square
F value % contrib
ution
P 2 4.29 4.29 2.15 0.114 0.157
AF 2 49.74 49.74 24.87 1.329 1.841
SOD 2 20.84 20.84 10.42 0.556 0.77
FR 2 2626.61 2626.6 1313.30 70.19 97.23
Error 2 74.87 74.87 18.71
Total 8 2701.48
Level Pressure Abrasive Flow SOD Feed Rate
1 - 3.6188 - 3.1519 -2.5269 -3.3768 2 - 3.7040 - 3.7000 -3.7054 -2.6242 3 - 2.6854 - 3.1563 -3.7759 -4.0072 Delta 1.0185 0.5480 1.24894 1.38295
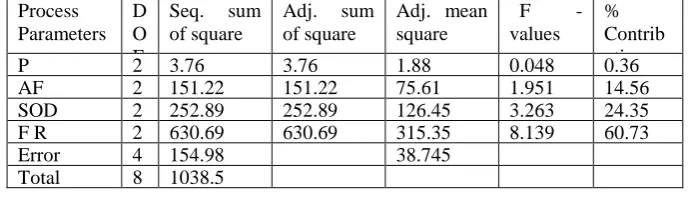
Roughness (Ra) is shown in Table 5. It is evident from Table V that feed rate alone influences Ra significantly. Since
the F – Value of Feed Rate is more than 4 having % contribution of 60.7 %, therefore this parameter is considered to be most significant for Ra.
TABLE V ANOVA FOR Ra
Process Parameters
D O F
Seq. sum of square
Adj. sum of square
Adj. mean square
F -values
% Contrib ution
P 2 3.76 3.76 1.88 0.048 0.36
AF 2 151.22 151.22 75.61 1.951 14.56 SOD 2 252.89 252.89 126.45 3.263 24.35 F R 2 630.69 630.69 315.35 8.139 60.73 Error 4 154.98 38.745
Total 8 1038.5
VII. MULTI OBJECTIVE MODEL USING GREY RELATIONAL ANALYSIS
Grey Relational Analysis (GRA) begins with normalization of the responses in the range between 0 and 1, popularly known as grey relational generation. GRA establishes the relationship between desired (ideal/ best) and actual experimental data. Grade is computed by averaging the grade regarding each response. The overall evaluation of several responses is judged by the grey relational grade. The grey relational grade thus allows optimization of multiple responses by converting this into a single grey relational grade. The evaluated grey relational grade varies from 0 to 1 and higher the value implies it closely approximate to the idle one. Out of all the combinations of process variables employed, one that has got the highest grey relational grade between the reference sequence and it is considered as the best parametric combination and hence recommended.
If higher value indicates better performance such as MRR then it is normalized as per equation
]
...
3
,
2
,
1
,
[
]
,....
3
,
2
,
1
,
[
]
....
3
,
2
,
1
,
[
n
i
Y
Min
n
i
Y
Max
n
i
Y
Min
Y
X
ij ij ij ijij
(3)If lower value indicates better performance such as Ra then it is expressed as
] ,... 3 , 2 , 1 , [ ] ,.... 3 , 2 , 1 , [ ] ,.... 3 , 2 , 1 , [ n i Y Min n i Y Max Y n i Y Max X ij ij ij ij
ij
(4)
The grey relational coefficient can be calculated as:
]
...
3
,
2
,
1
&
....,
3
,
2
,
1
[
)
.
(
m ax m axm in
i
n
j
m
X
X
Y
ij ij
oj
(5)Where,ij
XojXij
,m inMin
ij,i1,2,3....n&j1,2,3....m]
and m axMax[ij,i1,2,3....n& j1,2,3....m]
isthe distinguishing coefficient that is defined in the range 0 to 1. Generally, the distinguishing coefficient can be adjusted to fit the practical requirements. Considering MRR and Ra both are given equal weights that assume a value of
0.5. Expression as follows:
) , ( 1 ) , ( 1
m i ij oj io Y X X
m X
X (6)
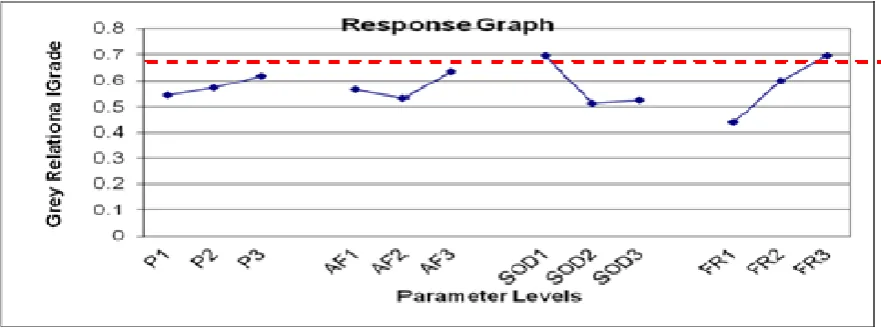
So the machining parameter setting of this experiment will fulfil multiple response parameters optimization. The dashed line in this figure is the value of the total mean of grey relational grade. This graph manifests that the best parametric combination is P3-AF3-SOD1 - FR3.
TABLE VI
GREY RELATIONAL COEFFICIENTS & GRADES
Ex. no.
Normalizing Delta Grey
Co-efficient
Grey Grade
Rank
Ra MRR Ra MRR Ra MRR
1. 0.768267 0.004767 0.231733 0.995233 0.68331 0.33439 0.50885 6
2. 0.394108 0.398176 0.605892 0.601824 0.452124 0.45379 0.45295 8
3. 0.004639 1 0.995361 0 0.334367 1 0.667184 3
4. 0 0.938477 1 0.061523 0.333333 0.890435 0.611885 4
5. 0.005335 0 0.994665 1 0.334523 0.333333 0.333928 9
6. 1 0.570282 0 0.429718 1 0.537797 0.768899 2
7. 0.676409 0.583575 0.323591 0.416425 0.607098 0.545598 0.576348 5
8. 0.922987 0.830543 0.077012 0.169457 0.866533 0.746873 0.806703 1
9. 0.678032 0.011163 0.321967 0.988837 0.608297 0.335832 0.472065 7
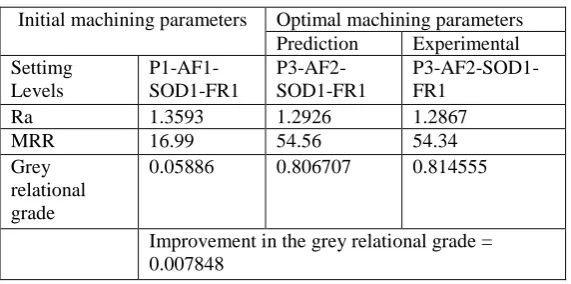
TABLE VII
RESPONSES FOR DETERMINATION OPTIMUM LEVEL
Initial machining parameters Optimal machining parameters Prediction Experimental Settimg
Levels
P1-AF1-SOD1-FR1
P3-AF2-SOD1-FR1
P3-AF2-SOD1-FR1
Ra 1.3593 1.2926 1.2867
MRR 16.99 54.56 54.34
Grey relational grade
0.05886 0.806707 0.814555
Improvement in the grey relational grade = 0.007848
VIII.CONFIRMATION TEST
Important test for verification and prediction of characteristic parameters from the estimated Grey relational grade using optimized parameters can be calculated as
q
i
m i m
1
ˆ
TABLE VIII
MACHINING PERFORMANCES USING THE INITIAL AND OPTIMAL MACHINING PARAMETERS
Where, mis the total mean of the Grey relational grade. Table VIII shows the results of the confirmation experiment employing the significant machining parameters. It is found that the improvement in the Grey relational grade is 0.007848
Fig.3 Grey Relational Grade
IX.CONCLUSION
By using Taguchi methodology and Grey Relational Analysis in machining of Aluminum by AWJM and the results follows S/N ratio shows high feed rate which augers for low Ra, with percentage contributions of about 60.7%. In case of high MRR, feed rate alone contributes to about 97%. It is concluded that the feed rate plays a significant role in governing high MRR and low Ra.From the Grey relational grade graph we conclude that the best possible combination of the process parameters to optimize the output parameters is 4500 bar of pressure, 9 gm/min of abrasive flow, 1.5mm of SOD and 14mm/min of feed rate. The confirmation experiment performed with the above combination results in Grey relational grade 0.8145 having MRR as 54.34 mm3/min and Ra as 1.2867?m is showing improvement in Grey grade. As a result, optimization performance is shown that the performance characteristics of the AWJM process such as MRR and Ra are improvement in Grey grade. It is shown that the performance characteristics of the AWJM process such as MRR and Ra are improved together by using the method proposed by this study.
REFERENCES
[1]. Khan, A.A., Haque, M. M., “Performance of Different Abrasive Materials during Abrasive Water Jet Machining of Glass,” Journal of Materials Processing Technology, pp. 404-407, 2007.
[2]. Chen, L., Siores, E., Wong, W. C. K., “Optimising Abrasive Waterjet Cutting of Ceramic Materials,” Journal of Materials Processing Technology, vol- 74, Issues 1-3, Pages 251-254, February 1998.
[3]. Junkar,M., Jurisevic,B., Fajdiga,M., Grah, M., “Finite Element Analysis of Single-Particle Impact in Abrasive Water Jet Machining,” International Journal of Impact Engineering, pp. 1095–1112, 2006.
Initial machining parameters Optimal machining parameters
Prediction Experimental Setting Levels P1-AF1-SOD1-FR1 P3-AF2-SOD1-FR3 P3-AF2-SOD1-FR3
Ra 1.3593 1.2926 1.2867
MRR 16.99 54.56 54.34
Grey relational
grade 0.05886 0.806707 0.814555
[4]. Bose, G. K., Sarkars, R. N., and Mitra,S., “Analysis of Cutting forces on electro chemical grinding (ECG) process,” International Journal of Computational material science and surface Engineering Inderscience, U.K, vol-3, No-1,pp. 3-11,2010.
[5]. Bose, G. K., Jana, T. K., Mitra, S.,“Identification of the significant process parameter by Taguchi methodology during ElectroChemical Grinding of Al2O3/ Al interpenetrating phase composite, ”International Journal of Computational material science and surface Engineering
Inderscience, U.K, vol- 4, No - 3, pp. 232- 246, 2011.
[6]. Kumar, Pradeep., Barua, P. B., Gaindhar, J.L., “Quality Optimization (Multi Charecteristics) through Taguchi Technique Quality Concept”, Quality and Reliability Engineering International, Vol-16, pp. 475-485, 2000.
[7]. Montogomery, D. C., DESIGN AND ANALYSIS OF EXPERIMENT, John Willey & Sons. Inc New York, 2003. [8]. Phadke, M. S., “QUALITY ENGINEERING-using Robust Design”, Prentice-Hall, Englewood Cliffs.New Jersey, 1989. [9]. Deng, J., “Introduction to Grey System”, The Journal of Grey System, Vol. 1, No. 1, pp- 1-24, 1989.