ABSTRACT
KAWA, SAMBA ANSUMANA.Impact of Tillage and Management Practices on Soil Organic Carbon and Nitrogen Dynamics in Diverse Agroecosystems. (Under the direction of Dr. Michael G. Wagger.)
Agricultural management practices impact the sources and sinks of carbon dioxide
(CO2) and other greenhouse gases attributed to global warming. Application of long-term no-till (NT) practices to sequester soil C has been recognized in C trading and agroecosystem
sustainability. Contributions by conservation management practices (e.g. no-till, cover
cropping, and organic amendments) in sequestering C can be estimated at about one-fourth
to one-third of annual atmospheric CO2 enrichment; whereas conventional tillage (CT) and management practices such as crop residue removal and low-input agriculture contribute to
soil organic carbon (SOC) and nitrogen (SON) loss. This research examines the impacts of
tillage and management induced changes on SOC and SON dynamics in diverse
agroecosystems. The objectives of the research were to investigate tillage effects on water
stable aggregation (WSA) and C and N distribution in bulk soil, aggregates, and particle-size
fractions; and to evaluate various soil factors controlling WSA and SOC using a principal
component analysis (PCA) method. Soil samples used in the investigation were from the
surface 0- to 10-cm depth of NT and CT systems in a Wickham sandy loam (fine-loamy,
mixed, semi active, thermic Typic Hapludult), Delanco fine-sandy loam (fine-loamy, mixed,
Kanhapludult); representing North Carolina Coastal Plain, Mountain, and Piedmont
locations, respectively. Water stable aggregation was determined on wet-sieved aggregates.
Silt+clay fractions were fractionated according to particle size. Carbon, nitrogen, and free
and non-crystalline aluminum (Al) and iron (Fe) (hydr)oxides were determined and
enrichment factors for C (EC) and N (EN) (mass C or N per mass fraction/mass C or N per
mass bulk soil) calculated. Relative to CT, NT increased WSA and SOC/N and MBC/N. In the
Mountain, C and N pools in bulk soil and aggregates were 1.6-2.6 times greater under
organic-amended NT (NTO) than CT. In the Piedmont, NT increased WSA by 1.4-2.0 times,
SOC and N by 1.5-2.0 times, and aggregate associated C and N by 1.4-3 times. Average SOC
in equivalent soil mass was 1.5 and 1.8 times greater under NT in the Mountain and
Piedmont, respectively; and 1.1 times greater in the fallow system in the Coastal Plain.
Under NT and CT, silt+coarse clay proportion was 3-12 times greater than fine clay but C
and N concentrations and enrichment factors were 1.1-3 times greater in fine clay than
silt+coarse clay across locations. Silt+coarse clay and fine clay C and N concentrations were
1.1 and 1.6 times greater under NT than CT, while EC and EN were 1.3 and 1.1-1.2 times
greater under CT than NT, in the Mountain and Piedmont, respectively. The EC was 1.1
times greater under CT than NT in the Coastal Plain. Significant relationships existed
between MWD and non-crystalline Fe, hot water extractable C (HWEC; which measures
potentially bioavailable C), and SOC and bulk density in the Coastal Plain, Mountain, and
the Piedmont, and HWEC in all locations. These results illustrate greater enhancement of
WSA and sequestration of C and N in bulk soil, aggregates, and the fine clay fraction under
NT in the soils studied. The results further demonstrate the usefulness of the physical
fractionation procedure used to differentiate SOC and N distribution in bulk soil, aggregates,
and particle-size fractions, and of principal components in estimating WSA and SOC, under
Impact of Tillage and Management Practices on Soil Organic Carbon and Nitrogen Dynamics in Diverse Agroecosystems
by
Samba Ansumana Kawa
A dissertation submitted to the Graduate Faculty of North Carolina State University
in partial fulfillment of the requirements for the degree of
Doctor of Philosophy
Soil Science
Raleigh, North Carolina
2010
APPROVED BY:
______________________________ _______________________________ T. Jot Smyth Daniel W. Israel
______________________________ _______________________________ Greg D. Hoyt Chris Reberg-Horton
______________________________ Michael Wagger
ii DEDICATION
I dedicate this work to God; to my mom (Mamie Ngasoh Ansumana; RIP); and to my wife
iii BIOGRAPHY
Samba grew up with his mom in Tawey, a tiny village near Mobai in the Mandu
Chiefdom of the tiny West African nation of Sierra Leone. He attended primary and
secondary schools in the Eastern Province (Methodist and Roman Catholic Primary Schools
in Segbwema and Mobai, respectively, and Holy Ghost Secondary School in Segbwema);
Southern Province (Roman Catholic Primary Schools in Yamandu and Koribondo); and
Northern Province (Saint Francis Secondary School, Makeni) of Sierra Leone. Samba holds a
B.Sc. degree in Agriculture General from the Njala University College (NUC), Southern
Province; a M.Sc. in Soil Science from the Zhejiang Agricultural University in Hangzhou,
Zhejiang province, China; and a M.Sc. in Education from Mercy College in New York, USA.
Samba’s interests in soil science perhaps started early in his life, as he spent much of his
early childhood years with his mom, who grew vegetables and swamp rice and processed
palm oil in their tiny village. Samba had more exposure when a high school teacher, who
introduced the subject of Agricultural Science at Holy Ghost Secondary School, taught
Samba and other male students to grow cassava, peanuts, and other crops, while their
female counterparts prepared the farm produce, for the school’s lunch program. With these
experiences and an undergraduate education, Samba also introduced the subject to the
Richard Allen Girls High School in Freetown (the Sierra Leone capital), where he was a
iv
and, later on, Production Assistant, at the Seed Multiplication Project (SMP) enhanced his
interest and experience in cultivating the soil to grow crops. Samba attended several
training programs at the Rice Research Station and the then West Africa Rice Development
Association, both in Rokupr, Northern Sierra Leone; as well as at the International Institute
for Tropical Agriculture in Ibadan, Nigeria. Samba was also happy to have traveled in 1994
to China where, as part of his studies for the M.Sc. program, he visited several farms and
learned more about soil cultivation using appropriate technology. In 2005, Samba embarked
on a doctoral program at the North Carolina State University. Prior to this, he lived in New
York City and worked as a Skills Development Trainer at the New York League Center of the
Association for the Rehabilitation for Retarded Children (AHRC) for a year and as a science
teacher at the Rafael y Molina School (Intermediate School 184) in South Bronx, New York
v
ACKNOWLEDGMENTS
I thank God for his love. I would like to express profound thanks and gratitude to
Dr. Michael Wagger, who has been more than my advisor. He has provided me with much
needed support in diverse ways, including helping to keep me on track despite several
unfortunate incidences that threatened my continued study in the university. I am most
grateful for support from Dr. Hoyt, who took much valuable time to ensure that my sample
collection event at the Mountain Horticultural Research station was successful; to Drs.
Smyth, Israel, and Reberg-Horton who were always ready to respond to my numerous
questions about this research. These people were the best research committee I could
possibly get. Dr. Arellano Consuelo, in the Statistics Department, provided immense help in
making sense of my data. I also thank Robert Walters, Ken Fager, and Melissa Bell; they
helped me greatly during my sample collection exercises. Robert was also involved in many
other aspects of this research, from driving with me to the fields to helping me locate
materials for the experiments to providing assistance in analyzing my results. I also thank
Dr. Robarge and his staff in the Analytical Services Lab at North Carolina State University for
their immense help in analyzing my samples. Dr. Joel Gruver, Assistant Professor (Soil
Science/Sustainable Agriculture) in the Agriculture Department at Western Illinois
vi
we were both college and house mates. I also want to thank Sheri Cahill, Emily Dell, and my
other friends at NCSU. Finally, I thank my family for their love and great support; I love and
adore them too, because they put up with my “not-so-good” moments. Massam, my
vii
TABLE OF CONTENTS
LIST OF FIGURES ... x
LIST OF TABLES ... xii
CHAPTER I: TILLAGE EFFECTS ON WATER STABLE AGGREGATES AND AGGREGATE ASSOCIATED MICROBIAL BIOMASS CARBON AND NITROGEN ... 1
Abstract ... 1
Introduction ... 3
Materials and Methods ... 4
Site description and soil sampling ... 4
Aggregate fractionation... 5
Sample analysis... 7
Calculations and statistical analysis ... 8
Results and Discussion ... 8
Size distribution and water stable aggregation... 8
Soil organic and microbial biomass C and N ... 11
Aggregate associated organic and microbial biomass C and N ... 15
Conclusions ... 22
References ... 23
CHAPTER II: TILLAGE EFFECTS ON C AND N DYNAMICS IN DIVERSE AGROECOSYSTEMS: SOIL C AND N STRATIFICATION AND SEQUESTRATION ... 45
Abstract ... 45
Introduction ... 46
Materials and Methods ... 49
Description of study sites ... 49
Experimental design ... 52
Soil sampling ... 53
Soil physical, chemical, and microbiological analyses ... 54
viii
Results and Discussion ... 58
Soil mass, bulk density, and additional thickness required to achieve equivalent mass 58 Soil organic carbon and nitrogen ... 60
Labile pools of carbon and nitrogen ... 62
Soil organic and microbial biomass C and N stratification ratios ... 67
Soil organic carbon sequestration rates and factors influencing C sequestration ... 69
Conclusions ... 73
References ... 75
CHAPTER III: TILLAGE EFFECTS ON THE DISTRIBUTION OF ORGANIC CARBON AND NITROGEN IN SOIL PARTICLE-SIZE FRACTIONS ... 100
Abstract ... 100
Introduction ... 102
Materials and Methods ... 103
Soils and soil sampling ... 103
Particle size fractionation ... 104
Determination of mineral associated and particulate organic matter ... 106
Calculations and statistical analysis ... 108
Results and Discussion ... 109
Distribution of primary particle-size fractions ... 109
Carbon and nitrogen composition of particle-size fractions ... 112
Concentrations of C and N in particle-size fractions within aggregates ... 116
Enrichment of particle-size fractions ... 118
Carbon to nitrogen ratios ... 120
Conclusions ... 120
References ... 122
CHAPTER IV: MULTIVARIATE ANALYSIS OF SOIL FACTORS INFLUENCING AGGREGATE STABILITY AND ORGANIC CARBON CONTENT IN DIVERSE AGROECOSYSTEMS ... 141
Abstract ... 141
Introduction ... 143
ix
Soil sampling and analysis ... 145
Principal component and statistical analyses ... 151
Results and Discussion ... 154
Interpretation of PCs based on values for MWD ... 157
Interpretation of PCs based on values for SOC ... 163
Multiple regression analysis ... 166
Variables distinguishing between tillage effects on MWD and SOC across locations . 167 Conclusions ... 168
x
LIST OF FIGURES
Chapter I. Tillage effects on water stable aggregates and aggregate associated microbial biomass carbon and nitrogen
Fig. 1. Aggregate size class distribution and mean weight diameter of wet-sieved samples from three long-term experimental sites ... 31 Fig. 2. Soil organic C and N and microbial biomass C and N concentrations in bulk soil for different tillage systems in the Coastal Plain, Mountain, and Piedmont locations ... 32 Fig. 3. Microbial biomass C and N concentrations in bulk soil for different tillage systems in the Coastal Plain, Mountain, and Piedmont locations ... 33 Fig. 4. Organic C concentrations in soil aggregates under different tillage systems in the Coastal Plain, Mountain, and Piedmont locations ... 34 Fig. 5. Organic N concentrations in soil aggregates under different tillage systems in the Coastal Plain, Mountain, and Piedmont locations ... 35 Fig. 6. Contributions of aggregate associated C to SOC under different tillage systems in the Coastal Plain, Mountain, and Piedmont locations ... 36 Fig. 7. Contributions of aggregate associated N to SON under different tillage systems in the Coastal Plain, Mountain, and Piedmont locations ... 37 Fig. 8. Microbial biomass C quotients in aggregates under different tillage systems ... 38 Fig. 9. Microbial biomass N quotients in aggregates under different tillage systems ... 39
Chapter II. Tillage effects on C and N dynamics in diverse agroecosystems: Soil C and N stratification and sequestration
xi
Chapter III. Tillage effects on the distribution of organic carbon and nitrogen in soil particle-size fractions
Fig. 1. Aggregate size class distribution and mean weight diameter of wet-sieved samples
from three long-term experimental sites ... 126
Fig. 2 Particle-size fraction distribution (not including sand particles) outside of macro- and micro-aggregates ... 127
Fig. 3. Distribution of mineral associated and particulate organic matter ... 128
Fig. 4. Carbon concentrations in particle-size fractions in the Coastal Plain, Mountain, and Piedmont locations... 129
Fig. 5. Nitrogen concentrations in particle-size fractions in the Coastal Plain, Mountain, and Piedmont locations ... 130
Fig. 6. C concentrations in silt+clay- and sand-sized particles associated with macro- and micro-aggregates in the Coastal Plain, Mountain, and Piedmont locations ... 131
Fig. 7. N concentrations in silt+clay- and sand-sized particles associated with macro- and micro-aggregates in the Coastal Plain, Mountain, and Piedmont locations ... 132
Fig. 8. Enrichment factors for C in the Coastal Plain, Mountain, and Piedmont locations 133 Fig. 9. Enrichment factors for N in the Coastal Plain, Mountain, and Piedmont locations134 Fig. 10. Enrichment factors for C in particle size fractions contained in aggregates ... 135
Fig. 11. Enrichment factors for N in particle size fractions contained in aggregates ... 136
Chapter IV. Multivariate analysis of soil factors influencing aggregate stability and organic carbon content in diverse agroecosystems Fig. 1 Distribution of soil organic C and mean weight diameter in the Coastal Plain, Mountain, and Piedmont locations ... 179
Fig. 2. Biplot of the first and second PCs showing their relationships to MWD ... 180
Fig. 3. Biplot of the first and second PCs showing their relationships to SOC ... 181
Fig. 4. Biplot of the third and fourth PCs showing their relationships to MWD ... 182
Fig. 5. Biplot of the third and fourth PCs showing their relationships to SOC ... 183
Fig. 6. Biplot of the third and fourth PCs showing their relationships to HWEC ... 184
xii LIST OF TABLES
Chapter I. Tillage effects on water stable aggregates and aggregate associated microbial biomass carbon and nitrogen
Table 1. Tillage systems and selected chemical and physical properties of the 0 to 10 cm depth of soils studied ... 40 Table 2. Description of crops grown in the plots studied at the experimental sites ... 41 Table 3. Organic and synthetic amendments at the experimental sites ... 43 Table 4. C:N ratios in soil and aggregate associated organic matter and microbial biomass under different tillage systems in the Coastal Plain, Mountain, and Piedmont locations . 44
Chapter II. Tillage effects on C and N dynamics in diverse agroecosystems: Soil C and N stratification and sequestration
Table 1. Description of crops grown in the plots at the experimental sites ... 87 Table 2. Organic and synthetic amendments used at the experimental sites... 89 Table 3. Tillage systems and characteristics of the 0 to 10 cm soil depth at the three locations studied ... 91 Table 4. Masses of soil and various pools of C and N per area in equivalent soil mass ... 92 Table 5. Soil C and N pools, expressed as concentration and equivalent mass, for different tillage systems in the Coastal Plain, Mountain, and Piedmont... 94 Table 6. Type 3 tests of fixed effects for SR for C and N pools in different tillage systems 95 Table 7. Stratification ratios of C and N pools under different tillage systems ... 96 Table 8. Differential stratification ratios of soil organic C and N and microbial biomass C and N under different tillage systems ... 97 Table 9. Correlations between SOC and soil properties affecting SOC sequestration in the Coastal Plain, Mountain, and Piedmont ... 98
Chapter III. Tillage effects on the distribution of organic carbon and nitrogen in soil particle-size fractions
xiii
Table 4. C/N ratios for organic matter associated with particle-size fractions within and outside aggregates from the 0 to 10 cm depth in soils studied ... 140
Chapter IV. Multivariate analysis of soil factors influencing aggregate stability and organic carbon content in diverse agroecosystems
1 CHAPTER I
TILLAGE EFFECTS ON WATER STABLE AGGREGATES AND AGGREGATE ASSOCIATED MICROBIAL BIOMASS CARBON AND NITROGEN
Abstract
No-till (NT) can improve water stable aggregation (WSA) and alter long-term soil
organic C (SOC) and N (SON) dynamics. Tillage effects on WSA and soil and aggregate
associated microbial biomass C (MBC) and N (MBN) in the surface 10 cm depth of NT and
conventional tillage (CT) systems were examined in three experiments varying in duration
and soil type. The soils were a Wickham sandy loam (fine-loamy, mixed, semi active,
thermic Typic Hapludult), Delanco fine-sandy loam (fine-loamy, mixed, mesic, Aquic
Hapludult), and Wedowee sandy clay loam (fine, kaolinitic, thermic Typic Kanhapludult) in
the Coastal Plain, Mountain, and Piedmont, respectively. In the Piedmont, NT increased
WSA by 1.4 to 2.0 times, compared to CT. The SOC concentrations were 1.5 and 2.0 times
greater under NT and organic-amended NT (NTO) than CT in the Piedmont and Mountain,
respectively. Average SON in the Mountain and Piedmont was 2 times greater under NT
than CT, respectively. In the Mountain, MBC was 1.5 times greater under NT than CT
systems; macro- and micro-aggregate C and N were 2 times greater under NTO than CT. In
the Piedmont, macro- and micro-aggregate C and N were 2-3 times greater under NT than
2
greater under NT than CT, respectively. These results demonstrate that NT systems, alone
or with organic amendments, can enhance WSA and organic and microbial biomass C and N
3 Introduction
Tillage practices that disrupt aggregates cause increased breakdown of soil organic
matter (SOM) (Adu and Oades, 1978) and affect the constituent SOM fractions(Parton et
al., 1987; Angers et al., 1992; Cambardella and Elliott, 1994). Conventional tillage systems result in SOC loss (Dalal and Mayer, 1986) and soil aggregate destruction (Tisdale and
Oades, 1982) via exposure of physically protected SOM to microbial attack (Beare et al.,
1994). Comparison of stable versus unstable aggregates has been used to identify factors
that influence aggregate stability (Puget et al., 1999). Relative to microaggregates (< 0.250
mm), stable macroaggregates (> 0.250 mm) are characterized as containing higher amounts
of organic C (Elliott, 1986; Puget et al., 1995) and microbial biomass (Degens et al., 1994).
Reduced aggregation in CT systems has been attributed to soil mixing and inversion (Chan
and Mead, 1988). In a study of soil components affecting aggregation, Chesters et al. (1957)
concluded that microbial gum had the most important effect on soil aggregate formation in
the surface 15 cm of a Spodosol. Studying the differences in microbial biomass in a NT
chronosequence previously under continuous maize cropping (0 to 20 yr) on a silt loam
Alfisol, Staley et al. (1988) reported that microbial biomass C in the top 7.5 cm of soil was
about 60% greater under NT compared to CT. Hernández-Hernández and Hernández (2002)
observed greater amounts of macroaggregate associated MBC under NT than CT systems in
a Venezuelan Ultisol and suggested that tillage impacts on the hierarchical distribution of
4
macroaggregates. The objective of the present study was to examine the effects of tillage
systems on the distributions of organic and microbial biomass C and N associated with
aggregates in soils of diverse agroecosystems. It was hypothesized that tillage intensities
will differentially influence water stable aggregation and organic and microbial biomass C
and N associated with aggregates.
Materials and Methods Site description and soil sampling
This study was conducted at three locations: 1) Center for Environmental Farming
Systems (CEFS; 35° 23' 5" N, 77° 59' 35" W) located near Goldsboro, Wayne County, 2)
Mountain Horticultural Crops Research Station (MHCRS; 35° 25' 50" North, 82° 30' 5" West)
near Mills River, Henderson County, and 3) Upper Piedmont Research Station (UPRS; 36° 21'
17" N, 79° 39' 53" W) near Reidsville, Rockingham County. These sites are located in the
Coastal Plain, Mountain, and Piedmont physiographic regions of NC, respectively.
Experimental designs at each site were randomized complete block, with 3 replications per
treatment at CEFS and 4 replications each at MHCRS and UPRS. This study examined 4
treatments at CEFS [conventional tillage (CT) and no-till (NT), an organic system under CT
(CTO), and a successional or forest regrowth system(S)]. At MHCRS, the five treatments
included synthetic (fertilizers, herbicides, etc.) amended plots under CT (CTS) and NT (NTS),
5
inputs (CT). The three treatments at UPRS consisted of a moldboard plow/disk (MBP), spring
chisel plow only (SCP), and no-till (NT). At CEFS, soil samples were taken around previously
geo-referenced points, using a 2.5 cm diameter by 30 cm deep long probe, within plant
rows from the surface 10 cm. At the other locations, sampling was done within plant rows
from 3 to 6 randomly assigned and demarcated sampling locations selected within defined
soil-landscape positions in each replication. Samples were taken from the same 10 cm soil
depth using a 7.5 cm diameter by 30 cm deep long core auger. At all locations, three
samples were taken around each sampling location, composited, placed into ziplock bags,
and transported to the laboratory. Table 1 describes selected properties of the soils.
Aggregate fractionation
The modification by Haynes (1993) of the Yoder (1936) wet sieving method was used
to separate soil samples into three water stable aggregate size classes: macroaggregates
(4.00-0.250 mm diameter), microaggregates (0.250-0.053 mm diameter), and silt+clay (<
0.053 mm diameter). The device used to accomplish the separations consisted of four nests
of three 12.5-cm diameter sieves, each nest consisting of a 2.00-mm, 0.250-mm, and
0.053-mm aperture sieve.
Thirty-five gram samples (oven dry equivalent) of field moist samples, previously
crushed gently by hand and passed through 8- and 4-mm aperture sieves and stored in
6
raised and lowered on each nest of sieves through a distance of about 3.5 cm at a rate of 34
oscillations min1 for 15 min. The sieves were allowed to drain and a strong jet of distilled water from a wash bottle used to backwash the contents on each sieve into small,
aluminum trays. The contents were weighed and placed in a freeze dryer (VirTis Freeze
Mobile 12XL from The VirTis Company, Gardiner, N.Y. 12525). The material that passed
through the smallest sieve, containing materials <0.053 mm, was kept for further
fractionation into silt+coarse clay and fine clay fractions in a separate study. After
freeze-drying, the 4.00-2.00 mm and 2.00-0.250 mm materials were composited and labeled
macroaggregates, so that each sample was now divided into macro- (4.00-0.250 mm) and
micro-aggregates (0.250-0.053 mm).
The percentage of soil remaining on each sieve was calculated after excluding the
material > 4 mm. The respective values obtained were designated as the water stable
aggregate size distribution between 4.00 to 2.00, 2.00 to 0.250, and 0.250 to 0.053mm.
Mean weight diameter (MWD) values were used as another way to express aggregate size
distribution (Youker and McGuiness, 1957) and were calculated as follows:
MWD = ∑(proportion of sample retained on sieve × size class midpoint or mean
diameter of the size fraction)
7
((4.00+2.00)/2), ((2.00+0.250)/2), ((0.250+0.053)/2), and ((0.053+0)/2), or 3.0, 1.125, 0.152,
and 0.027 mm, respectively. The macro and microaggregates were stored between 0 to 4oC until further analysis.
Sample analyses
The chloroform fumigation extraction method according to Vance et al. (1987) was
used to determine soil microbial biomass C and N in aggregates without the subtraction of
controls, using the method of handling small sample sizes of aggregates suggested by
Kandeler et al. (1999). Aggregate size materials were finely ground and total C and N
concentrations, as well as those in bulk soil, were determined by direct combustion in a
Perkin–Elmer 2400 CHN analyzer. Soil particle size analysis was according to the hydrometer
method of Gee and Bauder (1986). Soils in this study were generally at pH 6.5 or less and
low in carbonates. Therefore, total C was assumed equal to organic C. Aggregate weights
and C and N concentrations were corrected for sand according to Wick et al. (2009) and
Denef et al. (2001). Gravimetric moisture content was measured and found to range
between 12 and 14% in the Coastal Plain, 10 to 15% in the Mountains, and 8 to 12% in the
8 Calculations and Statistical Analysis
Contributions of organic or microbial biomass C and N in an aggregate size class
relative to organic C and N in bulk soil were calculated according to Paul et al. (2008):
RCfraction = (Cfraction/Cbulk soil) × 100,
where: RCfraction (%) is the contribution of C or N in an aggregate size class relative to organic C and N in bulk soil; Cfraction (g C kg1 soil) is the absolute quantity of soil C or N in an
aggregate size class per kg bulk soil; and Cbulk soil (g C kg1 soil) is the quantity of soil C or N per kg bulk soil.
Tillage and region effects were evaluated by using the mixed procedure (Proc Mixed)
model of the Statistical Analytical Software (SAS Inst., Cary, NC) to compare treatment
means, aggregate size classes, and particle size fractions. Pearson’s correlation coefficients
were determined for the correlation matrix of variables measured in aggregates and
fractions.
Results and Discussion Size distribution and water stable aggregation
Across all locations, percent recovery of samples relative to bulk soil that was
fractionated ranged from 87 to 92%. Total sand free water stable aggregates ranged
between 18 and 27%, 35 and 44%, and 21 and 30% in the Coastal Plain, Mountain, and
9
these aggregate size classes in these locations (Fig. 1). Tillage had no effect on mean weight
diameter (MWD), an index of water stable aggregation (WSA) in the Coastal Plain and
Mountain locations; but did impact (p = 0.0034) MWD in the Piedmont location. In the
Piedmont location, MWD under the no-till system (NT) was 1.4 times greater than under the
spring chisel plow (SCP) and twice that under moldboard plow (MBP); and MWD was 1.4
times greater under SCP than MBP (Fig. 1). The greater MWD under NT (1.0 mm) than in the
disturbed or cultivated soils (0.7 mm for SCP, and 0.5 mm for MBP) illustrates the adverse
effects of cultivation and the positive influence of NT on soil aggregation; while the greater
MWD under SCP than MBP suggests further that the adverse effects of cultivation on WSA
increases with intensity of tillage. Crop residues and other soil cover under NT can have a
mulching effect as well as contribute to organic matter replenishment, which in turn
enhances WSA (Tisdall and Oades, 1980; Blanco-Canqui and Lal, 2004). In contrast, biomass
removal under CT results in bare soils that are susceptible to surface soil erosive forces. The
topography of the Piedmont region is rolling to hilly, with the hills and valleys separated by
a few hundred meters of elevation ranging from about 90 to about 460 m (Daniels et al.,
1999). Furthermore, binding agents that bind micro- and macro-aggregates are sensitive to
cultivation (Stott et al., 1999). Cultivation disrupts soil aggregates, thereby reducing their
MWD. Thus while tillage operations under CT expose soil and cause soil aggregate
destruction (Tisdale and Oades, 1982); NT enhances aggregation (Zotarelli et al., 2005).
10
the Coastal Plain and Mountain locations suggests that the duration a given tillage system
has been in place may be a factor determining aggregation in the surface depth in these
soils. Six et al. (2000) wet-sieved field moist soils to measure MWD in the 0 to 5 cm depth in
NT and CT systems of a sandy loam Alfisol and regarded the “young age” of the then 9-yr
experiment as a probable cause for similarities in MWD values between NT and CT. Also,
Bayer et al. (2000) observed SOC and N accumulation to proceed in a step-by-step
depth-wise distribution for a sandy clay loam Paleudult previously plowed, converted to NT, and
amended with crop residue. The authors observed SOC and N accumulation in the 0 to 2.5,
0 to 7.5, 0 to 12.5, and 0 to 17.5 cm depths only after 3, 5, 9, and 11 years of NT. At the time
of sampling in the present study, the experimental plots in the Coastal Plain and Mountain
had been established for 9 and 14 yr, respectively, compared to 24 yr for the plots sampled
in the Piedmont. In a previous study, Overstreet (2005) observed greater macroaggregate
content in the top 15 cm of the NTO plots compared to the other systems of the same
MHCRS experimental site in this study. Differences in aggregation between the former and
current findings may be related to differences in sampling depth (top 15 cm in study by
Overstreet (2005) versus top 10 cm in current study). Greater aggregation has been
observed in the 5 to 20 than 0 to 5cm depth in NT systems in a Duroc loam (fine-silty,
mixed, mesic Pachic Haplustoll) (Six et al., 1998) and in the 10 to 20 cm than 0 to 10 cm
11 Soil organic and microbial biomass C and N
Tillage significantly influenced SOC concentrations in the Coastal Plain (p = 0.0328),
Mountain (p = 0.0006), and Piedmont (p = 0.0006) locations (Fig. 2). In the Coastal Plain,
SOC was approximately 10% greater in the successional (S; 10.7 g kg1 soil) than no-till (NT; 9.9 g kg1 soil) or conventional tillage (CT; 9.5 g kg1 soil); but did not differ between S and organic (CTO; 10.2 g kg1 soil). The SOC concentrations under CTO, NT, and CT did not differ. On average, undisturbed (NT and successional) systems contained 10.3 g SOC kg1 soil, compared to 9.8 g SOC kg1 soil in systems with tillage (organic and CT). In the Mountain location, SOC concentrations were of the order NTO NTS = CTO = CTS = CT. The SOC
concentrations under NT averaged 13.4 g kg1 soil, 1.5 times greater than under CT. In the Piedmont location, SOC was significantly greater under NT (10.6 g kg1 soil) than either SCP (6.7 g kg1 soil) or MBP (5.2 g kg1 soil). On average, the concentration of SOC under NT was 1.8 times greater than under CT (SCP and MBP). Concentrations of SON in the Mountain and
Piedmont locations followed patterns similar to SOC in those locations; with SON
concentrations averaging 1.6 and 1.7 times greater under undisturbed (NT) than disturbed
(tilled) systems, respectively. Tillage did not impact SON in the Coastal Plain.
The greater concentration of SOC under the successional system (S), compared to
concentrations under NT and CT, may be attributed to the nearly steady addition of organic
matter, lack of tillage-induced SOC loss, and lack of SOC loss (such as in crop harvests) in the
12
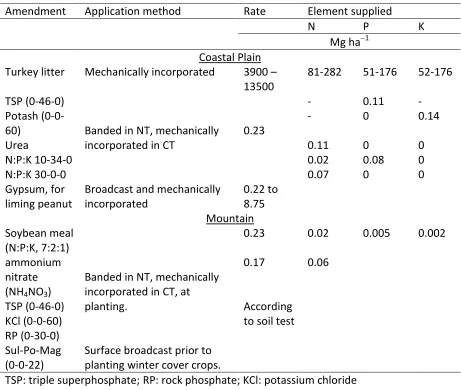
in soil. Based on the mean values for various types of turkey litter
(http://www.soil.ncsu.edu/publications/Soilfacts/AG-439-05/), it was calculated that the
high rate (3900 –13500 Mg ha1) of turkey litter added to the CTO system in the Coastal Plain location supplied between 81 and 282 Mg N ha1 (Table 2). Assuming that only 50% of the N in the turkey litter was available for plant uptake during the growing season, this
would translate to between 40 and 140 Mg N ha1 from the turkey litter, compared to 0.20 Mg N ha1 from urea and N:P:K fertilizers in the CT system. It might be expected, therefore, that SON would be significantly greater under CTO than the other systems in the Coastal
Plain. However, it is possible that a large proportion of the excess N in the turkey litter was
lost to leaching, ammonia volatilization, and uptake by the previous (2006) soybean crop.
The significance of organic amendments is illustrated in the Mountain location,
where the difference between the two no-till systems (NTO and NTS) was greater SOC
content under NTO than NTS. In addition to crop residues left on the soil surface with both
no-tillage systems, the NTO system received more organic amendments. This resulted in
greater SOC content in the NTO than NTS and other systems in the location. The greater
SON under NTO and CTO in the Mountain location also indicates the positive influence of
organic amendments on SON enhancement. Assuming 100% solubility for soybean meal
applied, the organic-amended (NTO and CTO) systems in the Mountain each received about
13
increased organic residues from cover crops and previous crops have possibly resulted in
increased SON under NTO. The different types of cover crops in the organic- and
synthetic-amended systems may make up for the difference in SON concentrations, since soil N
contribution is expected to be greater under the leguminous (hairy vetch (Vicia sativa L.))
than non-leguminous (rye (Secale cereale L.) cover crop. Sainju and Singh (2008) observed
greater N concentrations in hairy vetch than rye cover crop with or without N fertilization
application under NT and CT. Organic amendments in conjunction with leguminous cover
crop under NT seemed to increase SOC in the Mountain. Overstreet (2005) observed
greater SOC and SON in organic-amended than synthetic-amended systems under NT than
under synthetic-amended tilled systems in similar plots from the same experimental site.
The NT, SCP, and MBP systems in the Piedmont location each received 0.06 Mg N ha1, 0.03 Mg P ha1, and 0.03 Mg K ha1. However, crop residues that were left on the soil surface, together with the lack of soil disturbance, are responsible for the higher SOC and SON under
NT than SCP or MBP.
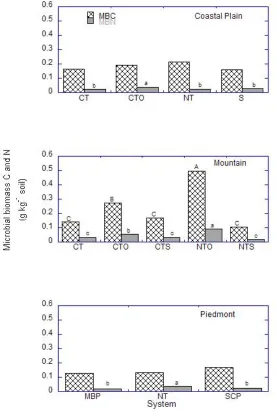
Tillage did not impact MBC in the Coastal Plain and Piedmont locations; but a tillage
effect was observed in the Mountain location, with MBC concentrations of the order NTO >
CTO = CTS = CT = NTS. Averaged across tillage systems for the Mountain location, MBC was
1.5 times greater under NT than CT (Fig. 3). The greater concentration of MBC in the NTO
than CTO suggests the positive influence of no-till, while the greater concentration under
14
influence of organic amendments on enhancing MBC in soil.
Tillage influenced MBN concentrations in all locations (Fig. 3). In the Coastal Plain,
the MBN concentration did not differ under S (0.03, g kg1 soil), NT (0.02 g kg1 soil), and CT (0.02 g kg1 soil) but MBN was significantly greater under CTO (0.03 g kg1 soil) than under these other systems. Average MBN concentration was 1.4 times greater under NT than CT
systems in the Mountain, where the order for MBN was the same as that for MBC. In the
Piedmont, the MBN concentration under NT (0.04 g kg1 soil) was twice the concentration under SCP (0.02 g kg1 soil) or MBP (0.02 g kg1 soil); while MBN under SCP and MBP did not differ. These results suggest the positive impacts of organic amendments, no-till and/or
organic amendments, and no-till systems to MBN enhancement in the Coastal Plain,
Mountain, and Piedmont locations, respectively.This study thus observed greater C and N
concentrations under undisturbed systems [SOC in S, NTO, and NT in the Coastal Plain,
Mountain, and Piedmont, respectively; SON in NTO and NT in the Mountain and Piedmont
locations, respectively; MBC (NTO in the Mountain location); and MBN (NTO and NT in the
Mountain and Piedmont locations, respectively)] and under disturbed systems that received
organic amendments [MBC under CTO in the Mountain location) and MBN under CTO in
both Coastal Plain and Mountain locations). Other authors (Overstreet, 2005;
Muruganandam, 2007; Gruver, 2007) have reported similar results about greater SOC and N
and MBC and N contents under NT compared to CT in the same experimental Mountain and
15
support evidence for the positive impacts of NT on organic C and N accumulation reported
elsewhere in the literature. The results provide further evidence for the increased
aggregation with decreasing tillage intensity observed in the Piedmont location, where
greater SOC and SON under NT (Fig. 2) corresponded to greater MWD under same system
(Fig. 1). Zhang et al. (2004) observed higher MBC and MBN in NT and organic than CT
systems in the Coastal Plain location. Under NT, continuous residue addition to the soil
surface occurs, resulting in increased organic C and N concentrations (Tisdall and Oades,
1980). Gradual decomposition of these residues on the soil surface by the soil microbial
biomass enhances SOC and SON concentrations in NT systems. Relative to NT, organic
matter loss is greater under CT because the soil is more severely disturbed by cultivation
(Adu and Oades 1978).
Aggregate associated organic and microbial biomass C and N
There were no significant effects due to tillage on aggregate associated C and N
(organic C and N in aggregates) in the Coastal Plain location, nor were there any tillage and
aggregate size interactions (Fig. 4). However, there was a significant effect due to aggregate
size in this location; as organic C was two times greater in macro- (118.8 g C kg1
aggregates) than micro-aggregates (59.1 g C kg1 aggregates) in the successional or forest regrowth system (S). Tillage significantly affected aggregate associated C and N in the
16
due to tillage by aggregate size interaction (Fig. 4). In this location, organic C concentration
in macroaggregates was about two times greater under NTO than under CTO, CTS, or CT;
whereas it did not differ between NTO and NTS or between NTS and CTO, CTS, and CT.
Microaggregate associated C was two times greater under NTO than CT but not significantly
different between NTO and NTS, CTO, and CTS or between CT and NTS, CTO, and CTS. In the
Piedmont, tillage significantly affected aggregate associated C but there were no aggregate
size or tillage × aggregate size interaction effects (Fig. 4). Macroaggregate associated C was
two times greater under NT than SCP and three times greater than under MBP; the
concentrations under SCP and MBP did not differ. Microaggregate associated C was two
times greater under NT than SCP or MBP.
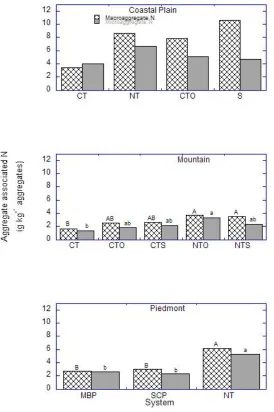
Tillage, aggregate size, and tillage × aggregate size effects on aggregate associated N
in all locations were similar to those observed for aggregate associated C in the respective
locations; except in the Mountain location where aggregate size effects on organic N in
aggregates did not differ (Fig. 5). Organic N was two times greater in macro- (10.6 g C kg1 aggregates) than micro-aggregates (4.7 g C kg1 aggregates) in the successional or forest regrowth system (S) in the Coastal Plain location. In the Mountain location, aggregate
associated N in macroaggregates was two times greater under both NTO and NTS than
under CT. Concentrations of aggregate associated N did not differ between NTO or NTS and
CTO and CTS. Microaggregate associated N was 2 times greater under NTO than CT. In the
17
times greater under NT than SCP or MBP, while concentrations did not differ under SCP and
MBP.
In their study of crop rotation effects on roots, hyphae, and organic matter and
water-stable aggregates in the 0 to 10 cm depth in a red-brown earth in Australia over five
decades, Tisdall and Oades (1980) attributed the higher organic matter content of
macroaggregates than microaggregates to the occurrence of decomposing roots and
hyphae in intimate association with inorganic materials. The authors suggested that tillage
operations accelerated the destruction of the roots and hyphae, thereby disrupting the
association and rendering macroaggregates unstable. The authors also observed that
microaggregates contained less organic C than macroaggregates. In another study involving
the 0 to 30 cm depth of a loam soil (fine, silty, mixed, mesic Pachic Haplustolls) in Nebraska,
Elliott (1986) explained that the higher organic C contents of macroaggregates vs
microaggregates were due to the organic C contents of microaggregates that are bound
together to form macroaggregates (microaggregates within macroaggregates). In the
present study, the concentrations of macroaggregate associated C and N were 2 or 3 times
greater under NT and NTO than CT (SCP and MBP) and CT in the Piedmont and Mountain
locations, respectively. The greater C and N concentrations are likely due to C and N
concentrations of decomposing plant materials, crop residues on the soil surface and plant
roots and hyphae in the undisturbed NT systems relative to the tilled systems. These results
18
and/or organic-amended NT systems, and the adverse effects of CT and no-amended CT
systems, on aggregate C and N enhancements.
It is not clear why there were no significant tillage effects on aggregate associated
organic C and N in the Coastal Plain location. This result may, however, be related to the
age of the experiment (9 yr) at this location, relative to 13 and 24 yr in the Mountain and
Piedmont locations, respectively. According to Angers et al. (1992), tillage-induced changes
in cultivated native soils are observed first with aggregate size distribution and stability
before changes in SOC are observed. This premise was supported in the present study by
the lack of evidence for significant differences in MWD in the Coastal Plain and Mountain
locations (Fig. 1). It is likely that the experiment at the Mountain location, 4 yr older than
the Coastal Plain location at the time this study was undertaken, has begun to show
observable changes in SOC content and will subsequently show differences in aggregate
stability. The experiment at the Piedmont location was 15 and 11 yr older than those at
Coastal Plain and Mountain locations, respectively. It is also possible that some inherent
properties, such as clay or sand content, may account for the absence of significant effects
in the Coastal Plain contrary to what was observed in the Mountain. The Coastal Plain
contained approximately 50% less clay, but 1.2 times more sand, than either the Mountain
or Piedmont location (data shown in Chapter IV of this dissertation).
Aggregate associated MBC and MBN concentrations were unaffected by tillage or
19
impacted aggregate associated MBC and MBN in the Piedmont location (Fig. 4). In the
Coastal Plain, mean MBC associated with macroaggregates was 1.3 and 1.7 g kg1 soil under NT and CT, respectively; while MBC associated with microaggregates averaged 0.9 and 1.2 g
kg1 soil under NT and CT, respectively. Corresponding values for MBN in this location were 0.1 g kg1 soil for both macro- and micro-aggregates under CT and 0.2 g kg1 soil for both aggregate types under NT. In the Mountains, mean concentrations of macro- and
micro-aggregate associated MBC were 0.7 and 0.5 g kg1 soil under CT and 0.8 and 0.7 g kg1 soil under NT. Average concentrations of MBN associated with macroaggregates were 0.2 g kg1 soil under both NT and CT and 0.1 g kg1 soil under NT and near 0 g kg1 soil under CT for MBN associated with microaggregates. In the Piedmont, the concentrations of MBC and
MBN were greater under NT than either SCP or MBP (Fig. 4). In this location, the
concentrations of macroaggregate associated MBC and MBN were, respectively, 1.4 and 1.9
times greater under NT than CT; while concentrations of microaggregate associated MBC
and MBN were 1.7 and 1.8 times greater, respectively. Other authors (Costantini et al.,
1996; Wright et al., 2005) have reported significant tillage effects on microbial biomass in
the 0 to 2.5 and 0 to 5cm depths, but not deeper. Wright et al. (2005) observed no
significant MBC differences in the 2.5 to 20 cm depth in corn under NT or CT, and no
differences in MBN for the 0 to 20 cm depth.
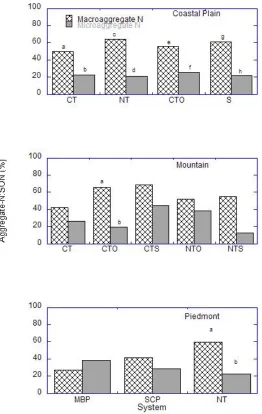
The proportions of aggregate associated C in SOC were significantly impacted by
20
associated C in SOC was significantly greater in NT than CTO by 1.4 times; and greater in
macro- than micro-aggregates under all tillage systems in the location by 2-3 times (Fig. 6).
There were no significant effects due to interaction between tillage and aggregate size in
this location. In the Mountain, there were no significant effects due to tillage or aggregate
size but there were significant effects due to interaction between tillage and aggregate size.
In the Piedmont, there were no significant tillage or aggregate size effects but there were
significant tillage × aggregate size effects. On average, organic C contributions by macro-
and micro-aggregates to SOC were, respectively, 57 and 19% under NT and 53 and 21%
under CT in the Coastal Plain; 54 and 24% under NT and 60 and 28% under CT in the
Mountain; and 63 and 24% under NT and 34 and 37% under CT in the Piedmont location.
Contributions to SON by organic N in macro- and micro-aggregates averaged, respectively,
63 and 22% under NT and 53 and 24% under CT in the Coastal Plain; 54 and 25% under NT
and 59 and 30% under CT in the Mountain; and 60 and 22% under NT and 34 and 34%
under CT in the Piedmont. The tillage × aggregate size interactions in the different locations
suggest that tillage effects on aggregate C (or N) contributions in SOC (or SON) depended on
aggregate size.
Aggregate associated MBC and MBN quotients, which express the proportions of
SOC and SON contributed by aggregate associated MBC and MBN, were not significantly
different under both NT and CT in the three locations (Fig. 7). There were significant
21
contributions to SOC were 4 and 3 times greater in macro- than micro-aggregates under CT
and NT; and in the Mountain, where the contributions were 6 times greater in macro- than
micro-aggregates under CTO. There were tillage × aggregate size interactions in the
Piedmont location. Contributions to SON were 3 times greater in macro- than
micro-aggregates under CT in the Coastal Plain.
Soil microbial biomass quotient has been suggested as an index to measure the
efficiency of conversion of organic C into microbial C and to measure SOC losses during
decomposition, with a suggested range of 1-5% of SOM (Sparling, 1992). The values
obtained in the present study ranged from about 1 to 2% (Fig. 8). The similar and relatively
narrow C/N ratios in microbial biomass (Table 4) suggest that similar sizes and nature of
microorganisms were present in both macro- and micro-aggregates in the different tillage
systems at each location. The MBC/MBN ratios all seem to be approximately in the range
(10 to 12) for fungal MBC/MBN ratio (Jenkinson and Ladd, 1981). Soil microbial biomass
quotient, which has also been suggested as an index to measure SOM response to
management changes (Ross etal. 1982), has been found to vary from 0.27 to 7.0% across
different soil management systems, sampling times, and analytical methodology (Anderson
and Domsch, 1989).
Soil, aggregate, and microbial biomass C/N ratios were not significantly different in
all locations (Table 4). However, the microbial biomass C/N ratios were generally below the
22 Conclusions
After 9, 13, and 24 yr of continuous tillage systems in the Coastal Plain, Mountain,
and Piedmont location, respectively, NT practices increased water stable aggregation in the
Piedmont but not in the other locations. Among other factors, the duration a given tillage
system has been in place and the intensity of the tillage system may be determining factors
of aggregation in the surface depth of the soils studied. Due to the accumulation of organic
residues on the soil surface, undisturbed systems (with or without organic amendments)
increased SOC and SON concentrations in the bulk soil at all locations. Aggregation
increases with decreasing tillage intensity and greater SOC and SON contents indicated
greater MWD under NT systems. Relative to NT, organic matter loss is greater under CT
because the soil is more severely disturbed by cultivation under CT. No-till systems have
positive effects on the enhancement of organic C and N in aggregate because no-till systems
increase organic C and N concentrations in macro- and micro-aggregates, likely due to C and
N concentrations of decomposing plant materials and crop residues on the soil surface in un
disturbed systems. Relative to CT, NT systems (with or without organic amendments) can
enhance organic and microbial biomass C and N contents of aggregates and bulk soil; likely
23 References
Adu, J.K. and J.M. Oades. 1978. Physical factors influencing decomposition of organic materials in soil aggregates. Soil Biol. Biochem. 10: 109-115.
Abid, M. and R. Lal. 2008. Tillage and drainage impact on soil quality I. Aggregate stability, carbon and nitrogen pools. Soil & Till. Res. 89-98.
Ahl, C., R.G. Joergensen, E. Kandeler, B. Meyer, V. Woehler. 1998. Microbial biomass and activity in silt and sand loams after long-term shallow tillage in central Germany. Soil & Tillage Research 49: 93-104.
Anderson, T.H. and K.H. Domsch. 1989. Ratio of microbial biomass carbon to total organic carbon in arable soils. Soil Biol. Biochem. 21: 471-479.
Angers, D. A., A. Pesant, and J. Vigneux. 1992. Early cropping-induced changes in soil aggregation, organic matter, and microbial biomass. Soil Sci. Soc. Am. J. 56:115-119.
Aoyama, M., D.A. Angers, and A. Dayegamiye. 1999. Particulate and mineral-associated organic matter in water-stable aggregates as affected by mineral fertilizer and manure applications. Can. J. Soil Sci. 79: 295–302.
Ashman, M.R., P.D. Hallett, and P.C. Brookes. 2003. Are the links between soil aggregate size class, soil organic matter and respiration rate artefacts of the fractionation procedure? Soil Biology & Biochemistry 35: 435–444.
Bayer, C., L. Martin-Neto, J. Mielniczuk, and C.A. Ceretta. 2000. Effect of no-till cropping systems on soil organic matter in a sandy clay loam Acrisol from Southern Brazil monitored by electron spin resonance and nuclear magnetic resonance. Soil Till. Res., 53: 95–104.
Bayer, C., J. Mielniczuk, E. Giasson, L. Martin-Neto, and A. Pavinato. 2006. Tillage Effects on Particulate and Mineral-Associated Organic Matter in Two Tropical Brazilian Soils. Communications in Soil Science and Plant Analysis 37 (3): 389-400.
Beare, M.H., P.F. Hendrix, and D.C. Coleman. 1994. Water-stable aggregates and organic matter fractions in conventional and no tillage soils. Soil Sci. Soc. Am. J. 58: 777–786.
24
Blanco-Canqui, H., and R. Lal. 2004. Mechanisms of carbon sequestration in soil aggregates. Crit. Rev. Plant Sci. 23:481–504.
Bossuyt, H., K. Denef, J. Six, S.D. Frey, R. Merckx, K. Paustian. 2001. Influence of microbial populations and residue quality on aggregate stability. Applied Soil Ecology 16: 195– 208.
Cambardella, C.A. and E.T. Elliott. 1992. Particulate organic matter changes across a grassland cultivation sequence. Soil Sci. Soc. Am. J. 777-783.
Cambardella, C.A., Elliott, E.T., 1993. Carbon and nitrogen distribution in aggregates from cultivated and native grassland soils. Soil Biol. and Biochem. 57: 1071-1076.
Cambardella, C.A. and E. Elliott. 1994.Carbon and nitrogen dynamics of soil organic matter fractions from cultivated grassland soils. Soil Sci. Soc. Am. J. 58:123-130.
Caravaca, F. , A. Lax, and J. Albaladejo. 2001. Soil aggregate stability and organic matter in clay and fine silt fractions in urban refuse-amended semiarid soils. Soil Sci. Soc. Am. J. 65:1235–1238.
Celik, I, I. Ortas, and S. Kilic. 2004. Effects of compost, mycorrhiza, manure and fertilizer on some physical properties of a Chromoxerert soil. Soil & Till. Res. 78: 59–67.
Chan, K.Y. 2001. Soil particulate organic carbon under different land use management. Soil Use and Management 17: 217-221.
Chan, K. Y., and J.A. Mead. 1988. Surface physical properties of a sandy loam soil under different tillage practices. Aust. J. Soil Res. 26, 549-59.
Chaney, K. and R.S. Swift. 1984. The influence of organic matter on aggregate stability in some British soils. Journal of soil Science 35:223-230.
Chesters, G., O. J. Attoe, and O. N. Allen. 1957. Soil aggregation in relation to various soil constituents. Soil Sci Soc Am J. 21: 272–277.
Costantini, A., D. Cosentino, and S. Andrea. 1996. Influence of tillage systems on biological properties of a Typic Argiudoll soil under continuous maize in central Argentina. Soil & Till. Res. 38: 265-271.
25
cultivation and cereal cropping in Southern Queensland. II. Total organic carbon and its rate of loss from the soil profile. Aust. J. Soil Res. 24: 281-292.
Daniels, R.B., S.W. Buol, H.J. Kleiss, and C.A. Ditzler. 1999. Soil Systems in North
Carolina. Tech. Bull. 314. North Carolina State University. Soil Sci. Dept. Raleigh, NC 27695-7619.
Degens, B.P., G.P. Sparling, L.K. Abbott. 1994. The contribution from hyphae, roots and organic carbon constituents to the aggregation of a sandy loam under long term clover-based and grass pastures. European J. Soil Sci. 45: 459-468.
Denef, K., J. Six, H. Bossuyt, S.D. Frey, E.T. Elliott, R. Merckx, and K. Paustian. 2001.
Influence of dry-wet cycles on the interrelationship between aggregate, particulate organic matter, and microbial community dynamics. Soil Biol. Biochem. 33: 1559-1611.
Dick, W.A., R.L. Blevins, W.W. Frye, S.E. Peters, D.R. Christenson, F.J. Pierce, and M.L. Vitosh. 1998. Impacts of agricultural management practices on C sequestration in forest-derived soils of the eastern Corn Belt. Soil & Tillage Research 47: 235-244.
Elliott, E.T., 1986. Aggregate structure and carbon, nitrogen and phosphorus in native and cultivated soils. Soil Science Society of America Journal 50: 627-633.
Elliott, E.T., K. Paustian., and S. D. Frey. 1996. Modeling the measurable or measuring the modelable: a hierarchical approach to isolating meaningful soil organic matter fractionations. In: Powlson, D.S., Smith, P., Smith, J.U. (Eds.), Evaluation of Soil Organic Matter Models Using Existing Long-term Datasets, NATO ASI Series. Springer Verlag, Berlin, pp. 161–179.
Evrendilek, F, I. Celik, and S. Kilic. 2004. Changes in soil organic carbon and other physical soil properties along adjacent Mediterranean forest, grassland, and cropland ecosystems. J. Arid Environ 59:743–752.
Fonte, S. J., Y. Edward, P. Ofori, G. W. Quansah, B. Vanlauwe, and J. Six. 2009. Fertilizer and residue quality effects on organic matter stabilization in soil aggregates. Soil Sci. Soc. Am. J. 73:961-966.
26
Gee, G.W. and J.W. Bauder. 1986. Particle size analysis. pp. 383-441. In: A. Klute (ed.), Methods of Soil Analysis, Part 1, 2nd Edition. ASA and SSSA Publ., Madison, WI, USA. Green, V.S., D.E. Stott, J.C. Cruz, and N. Curi. 2007.Tillage impacts on soil biological activity
and aggregation in a Brazilian Cerrado Oxisol. Soil and Till Res. 92 (1-2): 114-121.
Gregorich, E. G., M. H. Beare, U. F. McKim, and J. O. Skjemstad. 2006. Chemical and Biological Characteristics of Physically Uncomplexed Organic Matter. Soil Sci. Soc. Am. J. 70:975–985.
Gruver, Joel Brookes. 2007. Impact of Management and Texture on Soil Organic Matter Fractions (Doctoral dissertation). North Carolina State University, Raleigh, NC. 312 p.
Hamblin, A.P. 1980.Changes in Aggregate Stability and Associated Organic Matter
Properties after Direct Drilling and Ploughing on some Australian Soils. Aust. J. Soil Res. 18: 27-36.
Hassink, J. 1997. The capacity of soils to preserve organic C and N by their association with clay and silt particles. Plant and Soil191:77–87.
Haynes, R.J. and G.S. Francis. 1993. Changes in microbial biomass C, soil carbohydrate composition and aggregate stability induced by growth of selected crop and forage species under field conditions. Journal of Soil Science, 44, 665–675.
Hernández-Hernández, R.M., D. López-Hernández. 2002. Microbial biomass, mineral nitrogen and carbon content in savanna soil aggregates under conventional and no-tillage. Soil Biol. Biochem. 34: 1563–1570.
Jastrow, J.D. 1996. Soil aggregate formation and the accrual of particulate and mineral- associated organic matter. Soil Biol. Biochem. 28 (4/5): 665-676.
Jenkinson, D. S. and D.S. Powlson. 1976. The effects of biocidal treatments on metabolism in soil – V A method for measuring soil biomass. Soil Biol. Biochem. 8: 209-213.
Jenkinson, D. S., and J. N. Ladd. 1981. Microbial biomass in soil: measurement and
turnover. In 'Soil Biochemistry'. (Eds. E. A. Paul and J. N. Ladd.) Vol. 5, pp. 415-417. (Marcel Dekker: New York.)
27
numbers and biomass carbon. Soil Sci. Plant Nutr. 34: 429–439.
Kandeler, Ellen, M. Stemmer, and E-M Klimanek. 1999. Response of soil microbial biomass, urease and xylanase within particle size fractions to long-term soil management. Soil Biol. Biochem. 31: 261-273.
Laird, D A., P. Barak, E.A. Nater, and R.H. Howdy. 1991. Chemistry of smectitic and illitic phases in interstratified soil smectite. Soil Sci. Soc. Am. J. 55: 1499-1504.
Laird, D A., P. Y. Yen, W. C. Koskinen, T. R. Steinhelmer, and R. H. Dowdy. 1994. Sorption of atrazine on soil clay components. Environ. Sci. Technol. 28: 1054-1061.
Li, X. G., F. M. Li, R. Zed, Z. Y. Zhan, and B. Singh. 2007. Soil physical properties and their relations to organic carbon pools as affected by land use in an alpine pastureland. Geoderma 139: 98-105.
Marquez, C.O., V.P. Garcia, C.A. Cambardella, R.C. Schultz, and T.M. Isenhart. 2004. Aggregate-size stability distribution and soil stability. Soil Sci. Soc. Am. J. 68: 725– 735.
Mazzarino, M.J., Szott, L., Zimenez, M., 1993. Dynamics of soil total C and N, microbial biomass, and water soluble C in tropical agroecosystems. Soil Biol. Biochem. 25: 205–214.
Mikha, M. M. and C. W. Rice. 2004. Tillage and manure effects on soil and aggregate- associated carbon and nitrogen. Soil Sci. Soc. Am. J. 68: 809-816.
Muruganadam, S. 2007. Soil aggregate-associated microbial community structure and nitrogen transformations in three different tillage systems. Dissertation. North Carolina State University. 138 p.
Oades, G.M. and A.G. Waters. 1991. Aggregate hierarchy in soils. Aust. J. Soil Res. 29: 815- 828.
Overstreet, Laura Flint. 2005. Relationships between soil biological and physical properties in a long-term vegetable management study. (Doctoral dissertation). North Carolina State University, Raleigh, NC. 187 p.
28
Paul, S., G. O. Martinson, E. Veldkamp, and H. Flessa. 2008. Sample pretreatment affects the distribution of organic carbon in aggregates of tropical grassland soils. Soil Sci. Soc. Am. J. 72:500-506.
Piovanelli, C., C. Gamba, G. Brandi, S. Simonini, and E. Batistoni. 2006. Tillage choices affect biochemical properties in the soil profile. Soil Tillage Res. 90, 84–92.
Powlson, D.S. and D.S. Jenkinson. 1976. The effects of biocidal treatments on metabolism in soil - II. Gamma irradiation, autoclaving, air-drying and fumigation with
chloroform or methyl bromide. Soil Biol. Biochem. 8: 179-188.
Puget, P., C. Chenu, and J. Balesdent. 1995. Total and young organic matter distributions in aggregates of silty cultivated soils. European J. Soil Sci. 46, 449-459.
Puget, P., D.A. Angers, and C. Chenu. 1999. Nature of carbohydrates associated with water- stable aggregates of two cultivated soils. Soil Biology and Biochemistry 31: 55-63.
Puget, P., C. Chenu, and J. Balesdent. 2000. Dynamics of soil organic matter associated with particle size fractions of water stable aggregates. European J. Soil Sci. 51: 595-605.
Rosell, R.A., J.C. Gasparoni, and J.A. Galantini. 2001. Soil organic matter evaluation. In Assessment methods for soil carbon. Lal, R., J.M. Kimble, R.F. Follet, B.A. Stewart (eds.) CRC Press Boca Raton, Fl 33431. pp. 311-322.
Ross, D. J., T.W. Speir, K.R. Tate, A. Cairns, K.F. Meyrick, and E.A. Pansier. 1982. Restoration of pasture after topsoil removal: effects on soil carbon and nitrogen mineralization, microbial biomass and enzyme activities. Soil Biol. Biochem. 14: 575-581.
Sainju, U.M. and B.P. Singh. 2008. Nitrogen storage with cover crops and nitrogen fertilization in tilled and nontilled soils. Agron. J. 100: 619-627.
Schimel, D.S., D.C. Coleman, and K.A. Horton. 1985. Soil organic matter dynamics in paired rangeland and cropland toposequences in North Dakota. Geoderma 36: 201-214.
Seech, A.G. and E.G. Beauchamp. 1988. Denitrification in soil aggregates of different Sizes. Soil Sci. Soc. Am. J. 52:1616-1621.
29
Six, J., E.T. Elliott, and K. Paustian. 2000. Soil structure and soil organic matter: II. A normalized stability index and the effect of mineralogy. Soil Sci. Soc. Am. J. 64: 1042–1049.
Sparling, G. P. 1992. Ratio of microbial biomass carbon to soil organic carbon as a
sensitive indicator of changes in soil organic matter. Aust. J. Soil Res. 30: 195-207.
Staley, T.E., W.M. Edwards, C.L. Scott, and L.B. Owens. 1988. Soil microbial biomass and organic component alterations in a no-tillage chronosequence. Soil Sci. Soc. Am. J. 52:998-1005.
Stenberg, B., M. Johansson, M. Pell, K. Sjödahl-Svensson, J. Stenström, and L. Torstensson. 1998. Microbial and activities in soil as affected by frozen and cold storage. Soil Biol. Biochem. 30 (3): 393-402.
Stott, D.E., A.C. Kennedy, and C.A. Cambardella. 1999. Impact of soil organisms and organic matter on soil structure. In Lal, Rattan (ed.) CRC Press, Inc. 1999. Pp. 57-73.
Sugihara, S., S. Funakawa, M. Kilasara, and T. Kosaki. 2010. Effect of land management and soil texture on seasonal variations in soil microbial biomass in dry tropical
agroecosystems in Tanzania. Applied Soil Ecology 44: 80–88.
Tisdall, J. M. 1980. Stabilization of soil aggregates by plant roots. Ph.D. Thesis. University of Adelaide, Adelaide, Australia.
Tisdall, J.M., and J.M. Oades. 1980. The effect of crop rotation on aggregation in a ed- brown Earth. Aust. J. Soil Res. 18, 423-33.
Tisdall, J.M., and J.M. Oades. 1982. Organic matter and water stable aggregates in soils. J. Soil Sci. 33: 141–163.
Tu, C., F. J. Louws, N. G. Creamer, J. P. Mueller, C. Brownie, K. Fager, M. Bell, and S. Hu. 2006. Response of soil microbial biomass and N availability to transition strategies from conventional to organic farming systems. Agriculture, Ecosystems, and Environment 113: 206-215.
Vance, E.D., P.C. Brookes, and D.S. Jenkinson. 1987. An extraction method for measuring soil microbial biomass C. Soil Biol. Biochem. 19(6): 703-707.
30
microaggregates of a silty-loam soil and the relation with the resistance of microorganisms to soil drying. Soil Biol. Biochem. Vol. 28: 503-510.
Wardle, D.A. 1992. A comparative assessment of factors which influence microbial biomass carbon and nitrogen levels in soil. Biol. Rev. 67: 321–538.
Whalen, J. K. and C. Chang. 2002. Macroaggregate characteristics in cultivated soils after 25 annual manure applications. Soil Sci. Soc. Am. J. 66:1637–1647.
Wick, A. F., I. J. Lachlan, and P. D. Stahl. 2009. Aggregate and organic matter dynamics in reclaimed soils as indicated by stable carbon isotopes. Soil Biol. Biochem. 41: 201-209.
Wright, A. L., F.M. Hons, and J. E. Matocha Jr. 2005. Tillage impacts on microbial biomass and soil carbon and nitrogen dynamics of corn and cotton rotations. Applied Soil Ecology 29: 85–92.
Yoder, R.E. 1936. A direct method of aggregate analysis of soils and a study of the physical nature of erosion losses. J. Am. Soc. Agron. 28: 337-351.
Youker, R.E., and J.L. McGuiness. 1957. A short method of obtaining mean weight diameter values of aggregate analyses of soils. Soil Sci. 83:291–294.
Zak, D.R., D.F. Grigal, S. Gleeson, and D. Tilman. 1990. Carbon and nitrogen cycling during old-field succession: constraints on plants and microbial biomass. Biogeochem. 11: 111–129.
Zhang, Wei-Jian, Jin-Xia Feng, J. Wu, and K. Parker. 2004. Differences in soil microbial biomass and activity for six agroecosystems with a management disturbance gradient. Pedosphere 14 (4): 441-447.
Zotarelli, L., B. J. R. Alves, S. Urquiaga, E. Torres, H. P. dos Santos, K. Paustian, R. M. Boddey, and J. Six. 2005. Impact of Tillage and Crop Rotation on Aggregate-Associated
31
32
33
34
Fig. 4. Organic C concentrations in soil aggregates under different tillage systems in the Coastal Plain,
35
Fig. 5. Organic N concentrations in soil aggregates under different tillage systems in the Coastal Plain,
36
37
38
39
40
Table 1. Tillage systems and selected chemical and physical properties of the 0 to 10 cm depth of soils studied.
System† Duration pHwater CEC Sand Silt Clay
yr cmolc kg-1 %
Coastal Plain
CT 9 6.1 a 5.6 a 67.3 23.6 9.1
CTO 9 5.9 a 6.4 a 70.2 20.3 9.4
NT 9 5.9 a 6.0 a 64.7 24.6 10.7
S 9 4.8 b 4.2 b 74.2 17.2 8.6
Mountain
CT 13 5.9 b 6.9 b 60.8 19.8 19.4
CTO 13 6.3 a 7.4 b 53.0 23.2 23.8
CTS 13 6.1 ab 6.8 b 57.6 20.2 22.1
NTO 13 6.9 a 10.5 a 52.1 26.6 21.3
NTS 13 6.0 b 7.6 b 50.9 26.9 22.2
Piedmont
MBP 24 5.4 b 4.6 b 50.7 26.9 22.4
NT 24 5.9 a 6.1 a 56.9 26.1 17.1
SCP 24 6.1 a 5.9 a 58.1 18.3 23.6
41
Table 2. Description of crops grown in the plots studied at the experimental sites. Year(s)/Period Treatments (Tillage systems and crops grown)
Coastal Plain
CT† NT CTO S
1999 Corn (Zea mays L.) Corn Soybean Fallow
2000 Peanut (Arachis
hypogaea L.)
Peanut Sweet potato (Ipomea
batatas L.)
Fallow
2001 Cotton (Gossypium
spp. L.)
Cotton Wheat-Cabbage (Brassica oleracea L.)
Fallow
2002 Corn Corn Corn Fallow
2003 Peanut Peanut Soybean Fallow
2004 Corn Corn Corn Fallow
2005 Corn Corn Corn Fallow
2006 Grain sorghum
(Sorghum bicolor L.) and wheat (Triticum aestivum L.)
Grain and wheat
Biculture: Cowpea (Vigna sinensis L.) or soybean and crimson clover (Trifolium incarnatum L.) or wheat
Fallow
2007 Soybean (Glycine max
L.)
Soybean Soybean Fallow
42
Table 2 continued
Year(s)/Period Treatments (Tillage systems and crops grown)
Mountain
CTS† NTS CTO NTO CT
1995-2006 Staked tomatoes
(Solanum lycopersicum) with rye (Secale cereale
L.) as cover crop
Staked tomatoes with hairy vetch (Vicia sativa L.) as
cover crop
Staked tomatoes with wheat or crimson clover (Trifolium incarnatum L.) as cover crop
2007 Corn only with rye as
cover crop
Corn only with vetch as cover crop
Corn only with wheat or crimson clover as cover crop
Piedmont
MBP† SCP NT
1984-1989 Corn only
1990-2005 Corn-Soybean rotation
2006-2007 Corn only