University of Windsor University of Windsor
Scholarship at UWindsor
Scholarship at UWindsor
Electronic Theses and Dissertations Theses, Dissertations, and Major Papers
1-1-2006
Diamond indicators, trace elements, and kimberlites: A
Diamond indicators, trace elements, and kimberlites: A
comparative study using examples from the Slave and Kaapvaal
comparative study using examples from the Slave and Kaapvaal
cratons.
cratons.
Diana M. Benz
University of Windsor
Follow this and additional works at: https://scholar.uwindsor.ca/etd
Recommended Citation Recommended Citation
Benz, Diana M., "Diamond indicators, trace elements, and kimberlites: A comparative study using examples from the Slave and Kaapvaal cratons." (2006). Electronic Theses and Dissertations. 7126. https://scholar.uwindsor.ca/etd/7126
NOTE TO USERS
Diamond Indicators, Trace Elements, and Kimberlites: A Comparative Study Using Examples from the Slave and Kaapvaal Cratons
by
Diana M. Benz
A Thesis
Submitted to the Faculty of Graduate Studies and Research through
the Department of Earth Sciences in Partial Fulfillment of the Requirements for
the Degree of Master of Science at the University of Windsor
Windsor, Ontario, Canada
2006
1*1
Library and Archives CanadaPublished Heritage Branch
395 Wellington Street Ottawa ON K1A0N4 Canada
Bibliotheque et Archives Canada
Direction du
Patrimoine de I'edition
395, rue Wellington Ottawa ON K1A0N4 Canada
Your file Votre reference ISBN: 978-0-494-42317-2
Our file Notre reference
ISBN: 978-0-494-42317-2
NOTICE:
The author has granted a non exclusive license allowing Library and Archives Canada to reproduce, publish, archive, preserve, conserve, communicate to the public by
telecommunication or on the Internet, loan, distribute and sell theses
worldwide, for commercial or non commercial purposes, in microform, paper, electronic and/or any other formats.
AVIS:
L'auteur a accorde une licence non exclusive permettant a la Bibliotheque et Archives Canada de reproduire, publier, archiver,
sauvegarder, conserver, transmettre au public par telecommunication ou par Nntemet, preter, distribuer et vendre des theses partout dans le monde, a des fins commerciales ou autres, sur support microforme, papier, electronique et/ou autres formats.
The author retains copyright ownership and moral rights in this thesis. Neither the thesis
nor substantial extracts from it may be printed or otherwise reproduced without the author's permission.
L'auteur conserve la propriete du droit d'auteur et des droits moraux qui protege cette these. Ni la these ni des extraits substantiels de celle-ci ne doivent etre imprimes ou autrement reproduits sans son autorisation.
In compliance with the Canadian Privacy Act some supporting forms may have been removed from this thesis.
While these forms may be included
Conformement a la loi canadienne sur la protection de la vie privee, quelques formulaires secondaires ont ete enleves de cette these.
ABSTRACT
Diamond indicator minerals and diamonds are mantle materials brought to the Earth’s surface by kimberlites. The geochemical signatures of diamond indicator
minerals are related to diamond formation in the area of the mantle in which both the diamonds and their indicator minerals are formed. Occasionally the chemical character of the diamond indicator minerals indicate conditions conducive to diamond formation, but few diamonds are found. This study used LA-ICP-MS to look for element abundance patterns in five diamond indicator minerals: G10 harzburgitic garnets, eclogitic garnets, clinopyroxenes, orthopyroxenes, and olivines. The suites of diamond indicator minerals used in this study are from the Beartooth, Koala, Panda, Kit, New Elands (orangeite) and Zero kimberlites. Diamond content, craton and kimberlite locations were the variables used to distinguish the sample sets. Kimberlite diamond content is distinguished using binary plots of Mg, La, Ti, Ca, Mn, Zr, Ce, Sc, V, Al and Cr abundances. Trace element variations show metasomatic enrichment is more pronounced in the
minerals from highly diamondiferous kimberlites. G10 garnets and eclogitic garnets provided the clearest separation with respect to diamond content.
ACKNOWLEDGEMENTS
I would like to thank Charles Fipke for providing the materials, ideas and
resources to allow this project to succeed. The staff at C.F. Mineral Research
Ltd., especially Forough Hobuti and Agnes Fung, are warmly thanked for their
help in acquiring the samples for this project. Mike Baumgartner of Mineral
Services Ltd. and Jon Carlson of B.H.P. Billiton Ltd. are thanked for providing the
samples from Beartooth and for the Kit geology description. Zhaoping Yang of
GLIER is thanked for setting up the program that was used to process the data
and her help in processing the LA-ICP-MS data. Joel Gagnon of the University
of Windsor is gratefully thanked for training me on the LA-ICP-MS and for the
many hours spent talking about this project. Cheryl Diduck and Marty Mclnnes
are also warmly thanked for all their time spent listening to my ideas and for their
critiques. Peter Iwanowskyj is gratefully thanked for his help in the writing portion
of this thesis. My friends at the University of Windsor and my entire family are
STATEMENT OF ORIGINALITY
I certify that this thesis, and the research to which it refers, are the product of my
own work, and that any ideas or quotations from the work of other people,
published or otherwise, are fully acknowledged in accordance with the standard
referencing pratices of the discipline. I acknowledge the helpful guidance and
support of my supervisors, Dr. Brian Fryer (University of Windsor), and Dr. John
TABLE OF CONTENTS
ABSTRACT ... I ll
ACKNOWLEDGEMENTS... IV
STATEMENT OF ORIGINALITY...V
LIST OF TABLES... IX
LIST OF FIGURES...X
CHAPTER I
In tro d u ctio n... 1
R e view o f literatu re...3
Diamond Indicator Minerals... 3
Introduction...3
G10 Garnets...4
Eclogitic Garnets... 5
Clinopyroxenes...6
O livines... 7
Orthopyroxenes...8
Diamond Formation...8
The Slave and Kaapvaal Cratons... 10
Kimberlite Pipe Geology... 12
Ch a p t e rii D esign a n d m ethodology...16
Sample Description and Preparation...16
Experimental Conditions... 17
R esu lts...23
Introduction...23
Consistently Detected Elements...25
G10 Garnet Average Abundances... 26
Eclogitic Garnet Average Abundances... 27
Clinopyroxene Average Abundances... 27
Olivine Average Abundances... 28
Orthopyroxene Average Abundances... 28
Discrimination Diagrams...35
Introduction... 35
G10 Garnet... 35
Eclogitic Garnet... 36
Clinopyroxene... 37
O livine...38
Orthopyroxene... 39
Ch a p t e r m D iscussion o f R e su lts...44
Laser Ablation Inductively Coupled Plasma Mass Spectrometry o f Diamond Indicator Minerals...44
Average Abundances and Their Relationship to Future Research...46
G10 Garnet Average Abundances... 46
Eclogitic Garnet Average Abundances...48
Clinopyroxene Average Abundances... 50
Olivine Average Abundances... ... 51
Orthopyroxene Average Abundances... 52
Diamond Indicator Mineral Discrimination... 53
G10 Garnet Discrimination...53
Olivine Discrimination... 60
Orthopyroxene Discrimination...61
Ch a p t e riv Conclusions a n d Recom m endations...63
Sample and Analyte List Selection...63
New Discrimination Diagrams...65
REFERENCES... 67
APPENDICES... 145
A. Laser Ablation Inductively Coupled Mass Spectrometry Data... 145
B. The Number o f Grains Used to Calculate Averages... 146
i. Number o f Beartooth Grains Used in the Averaged Values for Each Element 146 ii. Number o f Panda Grains Used in the Averaged Values for Each Element 146 iv. Number o f Koala Grains Used in the Averaged Values for Each Element 147 v. Number o f K it Samples Used in the Averaged Values for Each Element 147 vi. Number o f New Elands Grains Used in the Averaged Values for Each Element... 148
vii. Number o f Zero Grains Used in the Averaged Values for Each Element 149 C. Potential Discriminants... 150
i. G10 Garnet Potential Discriminants...150
ii. Eclogitic Garnet Potential Discriminants... 151
iii. Clinopyroxene Potential Discriminants... 151
iv. Olivine Potential Discriminants...152
v. Orthopyroxene Potential Discriminants... 152
LIST OF TABLES
Chapter 2
T able 2.1 Summary o f the N um ber o f G ra in s...21
T able 2.2 T his S tudy’ s L A -IC P -M S Parameters... 21
LIST OF FIGURES
Chapter 3
Figure 3.1 D iam ond In d ica to r M in e ra l C lassification D iagram s... 24
Figure 3.2 G 10 Garnet A veraged Abundances...30
Figure 3.3 E c lo g itic Garnet Averaged Abundances... 32
Figure 3.4 C linopyroxene A veraged A bundances... 33
Figure 3.5 O liv in e Averaged Abundances and D isc rim in a tio n D ia g ra m ...34
Figure 3.6 O rthopyroxene A veraged Abundances... 35
Figure 3.7 G 10 D iam ond D isc rim in a tio n D ia g ra m s ... 40
Figure 3.8 E c lo g itic Garnet D iam ond D is c rim in a tio n D iagram s...41
Figure 3.9 C linopyroxene D iscrim in a tio n D iagram s... 42
CHAPTER I
INTRODUCTION
The composition and processes of the upper mantle occur far too deep to
apply direct scientific observation. With the use of mantle material carried to the
Earth’s surface via orogenic uplift or alkaline magma emplacement, the
composition, temperatures, pressures and mechanisms occurring within the
upper mantle may be postulated. One carrier of mantle material to the Earth’s
surface is kimberlite; a volatile-rich, potassic igneous rock whose emplacement
styles includes pipes, dykes and sills. Mantle material carried to the Earth’s
surface in kimberlite is typically in the form of xenoliths of peridotite and eclogite,
and xenocrysts or phenocrysts of garnets, chrome diopsides, olivines,
orthopyroxenes, chromites, picroilmenites and occasionally diamonds. The
geochemical signatures of xenocrysts and phenocrysts that occur with diamonds,
called diamond indicator minerals, are specific and may be used to appraise the
diamond potential of a kimberlite pipe.
The classification of diamond indicator minerals was created using the major
and trace element compositions of minerals found enclosed within diamonds and
minerals associated with highly diamondiferous kimberlites (Gurney, 1984;
Dawson et al., 1975; Stephens et al., 1977). Classification of these minerals
dates to the first discovery of diamondiferous kimberlites in 1872 (Mitchell, 1995).
suites of diamond indicator minerals from a few kimberlite pipes, such as the
Zero kimberlite of South Africa (Shee et al., 1989), show compelling geochemical
characteristics that indicate the indicator minerals occurred with diamonds but
few or only resorbed remnants of the diamonds are found. This discrepancy
suggests there are processes at work in the upper mantle that inhibit the
formation of diamonds in the diamond stability field, affect the carbon source for
diamonds or resorb the diamonds before or during kimberlite emplacement.
This study searches for differences in the chemistry of diamond indicator
silicate minerals from highly diamondiferous kimberlites and poorly
diamondiferous kimberlites. In this study, laser ablation inductively coupled mass
spectrometry (LA-ICP-MS) trace element analyses of diamond indicator silicate
minerals was used to create new discrimination diagrams for each mineral. The
silicate minerals used in this study are from the Beartooth, Koala, Panda, Kit and
Zero kimberlite pipes and the New Elands orangeite dike. Beartooth, Koala,
Panda and Kit are from the Slave craton in Canada. New Elands and Zero are
from the Kaapvaal craton in South Africa. The diamond indicator silicate
minerals used in this study are G10 garnets, eclogitic garnets, clinopyroxenes,
REVIEW OF LITERATURE
Diamond Indicator Minerals
Introduction
Most research to date has been performed on minerals found encapsulated
within diamonds as inclusions (Davies et al., 2004a; Davies et al., 2004b;
Gregoire et al., 2003; Promprated et al., 2004; Stachel et al., 1997; Stachel et al.,
1998; Stachel et al.,2003; Stachel et al., 2004; Tapped et al., 2005) as well as
mineral and whole rock analyses of diamond-bearing peridotite and eclogite
nodules (Burgess et al., 2004; Griffin et al., 1999b; Jacob, 2003; Jacob, 2004;
McCammon et al., 2001; Villaseca et al., 2003). Inclusions within diamonds
reflect the conditions in the mantle at the time of diamond formation. Diamond
indicator minerals are thus classified based on the most common chemical
signatures of minerals found encapsulated in diamonds. Usually, diamond
indicator minerals are found as disaggregated remnants of their host rock type.
These disaggregated remnants are exposed to processes that occurred during
and after diamond formation.
Five common indicator minerals associated with diamonds or
diamondiferous kimberlites are G10 harzburgitic garnets, eclogitic garnets,
diamond inclusion clinopyroxenes, forsteritic olivines, and enstatitic
orthopyroxenes. Each indicator mineral is classified by chemical characteristics
unique to diamond inclusion minerals and diamond bearing kimberlitic
G10 Garnets
G10 garnets (pyrope) are harzburgitic in origin and are characterised by
high Cr2C>3 and low CaO contents (Fipke et al., 1995 and Grutter, et al., 2004).
Diamond inclusion harzburgitic garnets tend to be depleted in high field strength
elements (HFSE) compared to other garnets and typically display a sinusoidal,
chondrite-normalised rare earth element (REE) pattern that peaks at Nd and
reaches a minimum at Flo or Er (Promprated et al., 2004). The enrichment of
light REE (LREE) suggests metasomatism also plays a role in the formation of
diamonds. The analyses of harzburgitic garnets from diamondiferous and non-
diamondiferous peridotitic xenolith nodules have also revealed that the
harzburgitic garnets of diamondiferous nodules have higher overall REE-
abundances than non-diamondiferous peridotitic xenolith nodules (Stachel et al.,
1998). The REE-enriched diamond inclusion harzburgitic garnets have excess Si
which is indicative of a high pressure environment since at pressures >5 Gpa Si
is more easily substituted as Al substitutes into other phases (Moore et al.,
1985). High P2O5 contents are also associated with the harzburgitic garnets that
formed within high pressure environments (Promprated et al., 2004). G10
garnets are thus indicative of high pressures conducive to diamond formation.
G10 harzburgitic garnets are typically pink to purple to violet in colour and
may show a gradation of these colours. G10 garnets display a flash of colour
from within when turned and are typically free of inclusions. Well-preserved
intact, encompassing the whole grain or found as remnants on part of the grain.
The primary surface of the grain is pitted with an ‘orange peel’ like or frosted
texture. Disaggregated G10 garnets are typically found as rounded or blocky
grains or fragments and lack crystal faces and crystal forms.
Eclogitic Garnets
Diamond inclusion eclogitic garnets are eclogitic in origin and are
characterised by high CaO and low Cr20 3 concentrations and a Na20 content
ideally greater than 0.7 wt% (Fipke et al., 1995 and Grutter et al., 2004).
Eclogitic garnets are distinguished from other garnet megacrysts by their higher
Na contents and are differentiated from crustal-derived garnets by high
Mg/(Mg+Fe) (or Mg#) and low Ca/(Ca+Mg) ratios (Schulze, 2003). Diamond
indicator garnets are formed as a result of metamorphosed subducted ocean
floor or from delaminated continental crust (Kay et al., 1993). Diamond inclusion
eclogitic garnets typically display a chondrite-normalised LREE depleted pattern
(Promprated et al., 2004). These chemical characteristics suggest that diamond
indicator eclogitic garnets are formed in the high pressures conducive to diamond
formation, whereas the depleted LREE/enriched heavy REE (FIREE) chondrite
normalised pattern is typical of garnet formation from a source enriched in REE
(Rollinson, 1993).
Diamond inclusion eclogitic garnets are bright orange to yellow,
light. Well preserved disaggregated garnets are characterised by an intact or
remnant kelyphitic rim. The primary surface of the grain is pitted with an ‘orange
peel’ like or frosted texture. Disaggregated eclogitic garnets are typically found
as rounded or blocky grains or fragments and lack crystal faces and crystal
forms. Occasionally, needle-like inclusions of rutile are found present within
these garnets.
Clinopyroxenes
Diamond inclusion clinopyroxenes are eclogitic or Iherzolitic in origin and
are differentiated from other rock sources by the detectable presence of K and
their high Cr content (Fipke et al., 1995). Diamond inclusion eclogitic
clinopyroxenes are typically enriched in LREE (Promprated et al., 2004).
Magnesium oxide, T i0 2 and LREE are also more enriched in the core of a
diamond inclusion clinopyroxene compared to the rim as a result of metasomatic
processes that occur during cooling (Taylor et al., 1996). These chemical
characteristics indicate that diamond inclusion clinopyroxenes formed within the
diamond stability window and the incorporation of Mg, Ti and LREE diminished
as the clinopyroxene cooled.
Diamond inclusion clinopyroxenes are a bright to pale emerald green
colour. Disaggregated diamond inclusion clinopyroxene are commonly oval or
rounded. Elongated or blocky fragments and irregular grains are also seen. The
primary surface of disaggregated diamond inclusion clinopyroxenes is frosted or
present. These clinopyroxenes are easily distinguished from uvarovite by their
observed cleavage.
Olivines
Forsteritic olivines are derived from the upper mantle. When associated
with diamonds, olivines have a characteristically high Mg content (a Mg# of 83-95
cation%), a Cr content between 0 and 0.2 Cr20 3wt.% and Ni contents from 0.2 to
0.49 NiO wt.% (Fipke et al., 1995). Olivines do not characteristically contain
detectable amounts of REE. However, increased HFSE and large ion lithophile
element (LILE) concentrations have been seen in an olivine found in the centre of
a diamond when compared to an olivine found at the edge of that same diamond
(Promprated et al., 2004). These differences, such as lower Cr and higher Ca,
Sc, Ti, Sr, Zr and Ba in olivines found in the core of a diamond compared to
those found in the rim, are due to the changing environments during diamond
formation; particularly the metasomatic reactions between olivine and the C-
bearing fluids which precipitated the diamond (Promprated et al., 2004).
Disaggregated forsteritic olivines are characterised by their colourless to
pale yellow and green colours. Their shape is primarily oval, rounded, elongated,
blocky or irregular. Where the primary surface is preserved the appearance is
stepped or ‘fish-scale’ like, splintery, frosted, laminated or pitted. The olivine
Orthopyroxenes
Diamond inclusion enstatitic orthopyroxenes ((Mg,Fe)Si0 3) are
differentiated from other orthopyroxenes by high MgO and low FeO, AI2O3, CaO
and Na20 contents (Fipke et al., 1995). Diamond inclusion orthopyroxenes are
not a significant repository for incompatible trace elements and are generally low
in Ba, Rb, Y, Hf, Nb and REE (Stachel et al., 1998). The Al203 content of
orthopyroxenes can be used to infer the pressure at the time of formation
(MacGregor, 1974; Nickel etal., 1985).
Diamond inclusion enstatitic orthopyroxenes are bright to pale green and
greenish to brownish in colour. Disaggregated grains are typically transparent
although light to dark brown inclusions are common. Their primary surface is
stepped, frosted or pitted and occasionally a coat of kimberlitic material may be
present. Enstatitic orthopyroxenes are visually similar to olivines and some
clinopyroxenes in morphology although they may be distinguished from
clinopyroxenes by their lighter colour and coarser texture.
Diamond Formation
Diamonds have been found in a variety of geological settings. Their
formation and origins are associated with extraterrestrial events recorded in
meteorites, shock metamorphism of meteoritic impacts, intra-cratonic collision
zone settings or mountain building events (ophiolites) and in the upper mantle
co-genetic formation with eclogite and peridotite. Eclogitic and peridotitic
to the Earth’s surface by deep-rooted volcanic events involving kimberlite,
orangeite and lamproite. Economic kimberlites are associated with thick, stable
Archean cratons (>2.5 Ga) that have cool lithospheric mantle at depths of 100 to
200 km. Because diamonds and their associated eclogitic and peridotitic
minerals form prior to the kimberlitic, orangeitic or lamproitic magma formation
and eruption events they are considered to be xenogenetic with respect to their
host rock.
Formation of kimberlitic, lamproitic and orangeitic-associated diamonds
occurs within the upper mantle eclogite and peridotite that underlie continents.
The radiometric model ages of peridotitic diamond formation ranges from 3.0-3.3
Ga (Richardson et al., 1984) whereas the ages of eclogitic diamonds are
younger, giving dates between 990 and 1670 Ma (Richardson et al., 1990).
Geothermobarometry of diamond inclusion silicates show diamonds form within a
specific range of temperatures (950 to 1250°C) and pressures (38 to 60 kbar),
called the diamond stability field (Griffin et al., 1999a). Inclusions of both garnet
and pyroxene indicate that diamond formation can also occur at much higher
pressures, at depths of up to 450 km (Moore et al., 1985; Moore et al., 1991).
Some authors have also suggested macro-diamond formation is more associated
with the kimberlitic and proto-kimberlitic melts (Sobolev, 1960); while others
suggest diamonds are solid phase products of incongruent melting during
Diamonds are essentially composed of pure carbon, with each carbon
atom covalently bonded by four neighbouring carbon atoms in tetrahedral
coordination. Occasionally the carbon in the crystal structure can be substituted
with nitrogen, oxygen, hydrogen, boron (Navon, 1999) and very rarely xenon
(Russell, 1998). The source of carbon for diamonds, subducted organic carbon
versus mantle-based carbon, and the processes that isotopically fractionate
carbon are the basis of most diamond formation models.
The Slave and Kaapvaal Cratons
As a direct result of the economic importance of diamonds, the areas in
which diamonds are found in the Slave and Kaapvaal cratons have been
extensively studied (Jones et al., 2003). The similarities that lie between the two
cratons are: their crusts were predominately formed in the Mesoarchean, their
crustal sections are terranes fused by Archean accretionary events and their
lithospheres contain peridotite that experienced a melt extraction event between
2.9 and 3.2 Ga (Jones et al., 2003). The major difference between the two
cratons is the homogeneity of the Kaapvaal craton as compared to the seismic
layering of the Slave craton (Jones, et al., 2003).
The Slave craton consists of an Archean granite greenstone terrain that
grew by accretion of a pre-3 Ga nucleus (Nowicki et al., 2004). At 2.64 to 2.595
Ga, after accretion and turbidite deposition, syntectonic tonalities and
granodiorites (TTG) intruded the entire sequence overlapping with post-tectonic
Ga and collisional events bounded the craton to the east and west with the
Paleoprotozoic Thelon-Taltson and Wompay orogens (Nowicki et al., 2004). A
feature unique to the Slave craton is its chemical and mineralogical stratification,
comprising a chemically depleted spinel-peridotite at a depth of 80 to 100km,
garnet peridotite down to 200 km and a fertile-garnet peridotite and pyroxenite-
rich layers at further depths (Kopylova et al., 2000 and Griffin et al., 1999a). A
proposed model for the formation of these chemical and stratigraphic layers in
the Slave craton involves the subduction of an oceanic lithosphere to form the
upper depleted layer of spinel-peridotite followed by a “super plume” of lower
mantle material to form the lower, more fertile layer of garnet peridotite and
pyroxenite (Griffin et al., 1999a).
The Kaapvaal craton is approximately 3.5 b.y. old with the oldest rock
formation, the Barberton Greenstone Belt, preserved in the south. Patchwork
development of new crust occurred in the south, east and north of the craton
before the entire craton was sutured together by extensive granitoid intrusions at
3.1 to 2.8 Ga, creating the Limpopo Belt in the craton’s central zone. Major
lineaments pattern the craton and may indicate suture zones of younger domains
that were also accreted at 3.1 to 2.8 Ga. At 3 Ga, development of the Dominion,
Witwatersrand and Pongola sedimentary basins occurred which was followed by
extensive volcanism. The development of these sedimentary basins was
succeeded by the formation of the Transvaal Supergroup with coeval extrusion of
no evidence of other major igneous or metamorphic activity until the early stages
of Namaqua-Natal Belt orogenesis at 1.1 Ga (Eglington, 2004).
Kimberlite Pipe Geology
Kimberlite is a rare and exotic igneous rock whose petrographic diversity,
complex mineralogy and geochemistry, unusual intrusion style and the
occasional association with diamonds sparks an interesting and lucrative
challenge for the earth scientist. Officially named in 1887, after Lord Kimberly’s
electoral division in Griqualand West called Kimberly in South Africa, kimberlite
was first recognised in May of 1871 on the farm of Johannes Nicolaas De Beers
and became the site of the first diamond mine (Mitchell, 1986). The Kimberly
diamond mines consisted of cylindrical carrot-like structures of highly altered
decomposed rock termed “yellow ground” underlain at increased depth by a
more compact rock called “blue ground” (Mitchell, 1986). Since this discovery in
South Africa, major kimberlite provinces have been identified in Tanzania,
Lesotho, Colorado-Wyoming, Yakutia (Siberia) and the Northwest Territories.
Two types of kimberlite have also been identified, type I kimberlite, e.g. the
Beartooth, Koala, Panda, Kit kimberlite pipes of the Northwest Territories and the
New Elands kimberlite pipe of South Africa, and type II kimberlite, or orangeite,
e.g. the New Elands orangeite of South Africa. There is still much debate on the
source of these two types of kimberlites and the apparent geographical restriction
led to their characterization including their mineralogy, morphology,
geochemistry, tectonic setting, and petrogenesis.
The Beartooth kimberlite pipe erupted approximately 50 to 56 Ma through
the Koala biotite granodiorite batholith, located in the Slave structural province
(Gurney et al., 2004). The Beartooth kimberlite, as well as the Koala, Panda and
Kit kimberlites, is one of the many kimberlite pipes on the Ekati property that is
aligned along dykes coincident with lineaments in the NNE-trending Lac de Gras
swarm (Creaser et al., 2004; and Nowicki et al., 2004). The kimberlites’
emplacement also appears fault controlled at a localised level (Creaser et al.,
2004; and Nowicki et al., 2004). Beartooth is a diamond-rich kimberlite with the
percentage of total octahedrals at 86.34 % (Gurney et al., 2004) (total
octahedrals is the percentage of diamonds found within a kimberlite with an
octahedral shape).
The Koala kimberlite pipe erupted approximately 42 to 75 Ma in the Slave
structural province (Nowicki et al., 2004). Koala is a diamond-rich kimberlite with
a total octahedral content of 43.75 % (Gurney et al., 2004). The exposed surface
of Koala is 4.5 ha. Koala’s morphology is atypical of a type I kimberlite as the VK
(volcanoclastic kimberlite) units occur in well defined horizontal layers rather than
the amorphous units found in most kimberlites (Nowicki et al., 2004).
The Panda type I kimberlite erupted at approximately 53 Ma within the
Slave structural province (Creaser et al., 2004). The morphology of Panda is
complies with the South African model of an archetypal type I kimberlite with a
few exceptions. The Zr and Hf contents of the Panda kimberlite are lower than
typical for a type I kimberlite. Light rare earth elements (LREE) enrichment is
also stronger in Panda, (La/Yb >350), than normally seen in both type I kimberlite
and orangeite, (La/Yb < 300) (Nowicki et al., 2004). Panda’s diamond population
predominantly consists of un-resorbed octahedral and cubo-octohedral forms
with a total octahedral content of 56.21% (Gurney et al., 2004). Panda is a
diamond-rich (DR) kimberlite.
The Kit kimberlite pipe is within the Ekati property and may have erupted
within the same time period, between 42 and 75 Ma (Nowicki et al., 2004), as the
other kimberlites dated within that area in the Slave structural province. The
crater facies of the Kit kimberlite consists of poorly-packed, fine-grained pelletal
volcaniclastic kimberlite (BHP internal report). The matrix is dominated by fine
grained clay with small olivine macrocrysts (0.7 mm), olivine phenocrysts and
rounded kimberlitic pelletal lapilli (BHP internal report). The previous presence of
monticellite is evidenced by granular serpentine relicts (BHP internal report). The
pelletal matrix contains fine-grained psuedomorphs after olivine set in an altered,
minor opaque-mineral rich matrix with traces of perovskite (BHP internal report).
The fine-grained opaques are rutile and possibly clinopyroxene microlites. Kit is
a non-economic (BHP internal report) or diamond-poor (DP) kimberlite.
The New Elands orangeite dike was emplaced approximately at 127 Ma
(Mitchell, 1995). New Elands is a typical orangeite, with greater LREE
enrichment and higher Ba content compared to type I kimberlites (Mitchell,
1995). The diamond population in New Elands predominantly consists of
resorbed dodecahedral and anhedral types. New Elands is considered, by C.F
Mineral Research Ltd., to be considerably less diamondiferous ( a DP kimberlite)
than the Beartooth, Koala and Panda kimberlites and has a highly resorbed
diamond population.
The Kuruman province is located on the western edge of the Kaapvaal
craton (>2500 Ma) and adjacent to the Kheis Belt (~1800 Ma) of the Northern
Cape Province (Shee et al., 1989). The Zero kimberlite pipe was emplaced
within the Kuruman Province, near the town of Kuruman, at the western edge of
the Kaapvaal Craton, South Africa, at approximately 1635 Ma (Shee et al., 1989).
Zero, and its neighbouring kimberlites and related alkaline intrusions, are the
oldest known kimberlites (~1600 Ma) and all are considered to be non-
diamondiferous (Shee et al., 1989). The morphology of these Kuruman
intrusives are in the form of small eroded pipes and dikes which intruded into
early Proterozoic Ghaap plateau dolomites and the overlying Asbestos Hills
Banded Ironstone of the Griqualand West Sequence (Shee et al., 1989). The
xenolith geochemistry of Zero is defined as off-craton with temperatures and
pressures of equilibration that fall within the graphite stability field indicating the
mantle sampled by Zero had conditions unsuitable for diamond formation (Shee
CHAPTER II
DESIGN AND METHODOLOGY
Sample Description and Preparation
Four hundred ninety-four mounted and microprobed diamond indicator
silicate minerals were obtained and classified by C.F. Mineral Research Ltd.
(CFM), Kelowna, BC. All grains were chosen based on CFM’s proprietary
classification as diamond indicator minerals, their lack of visible inclusions, a
minimum dimension of ~ >200 microns, and their non-friability. The samples
consist of a maximum of 20 examples of each of the 5 diamond indicator silicate
minerals (G10 harzburgitic garnets, eclogitic garnets, diamond inclusion
clinopyroxenes, forsteritic olivines, and enstatitic orthopyroxenes) from the 6
kimberlite pipes studied: Beartooth, Panda, Koala, Kit, New Elands and Zero. A
maximum of 20 grains from all the diamond indicator minerals were chosen to be
a cost-efficient yet chemically representative of each mineral’s population within
each kimberlite.
Due to the lack of some minerals in the samples available for this study
only the Koala and Kit kimberlites have complete suites of the 5 different mineral
types. There were no orthopyroxene grains available from the Beartooth pipe.
The Panda kimberlite and the New Elands orangeite samples contained no
orthopyroxenes. The Zero kimberlite sample lacked clinopyroxenes. It is also
important to note that all the clinopyroxene grains from the Kit kimberlite and 2 of
of the clinopyroxene grains in this study are from peridotite. Table 2.1
summarises the number of grains analysed in this study for each mineral from
each of the kimberlite pipes. These pipes were chosen for this project as a result
of the diamond indicator minerals that were available in C.F. Mineral Research’s
inventory and to allow for maximum variation between the diamond contents of
the highly diamondiferous and the poorly diamondiferous pipes.
Experimental Conditions
Each grain was mounted in epoxy resin discs, polished and carbon coated
for electron microprobe (EMP) analysis by C.F. Mineral Research Ltd. (CFM) in
Kelowna, BC. Electron microprobe (EMP) analyses were conducted at CFM
under the same conditions reported in Menzies et al. (2004). After EMP analysis,
each disc was cleaned with acetone to remove the carbon paint, polished with
Alumina 0.5 micron polishing powder [mixed with distilled water to remove the
carbon coat], wiped clean with acetone and photographed.
Laser ablation inductively coupled plasma mass spectrometry (LA-ICP-
MS) analyses for the trace element abundances of diamond indicator minerals
were conducted at the Great Lakes Institute for Environmental Research (GLIER)
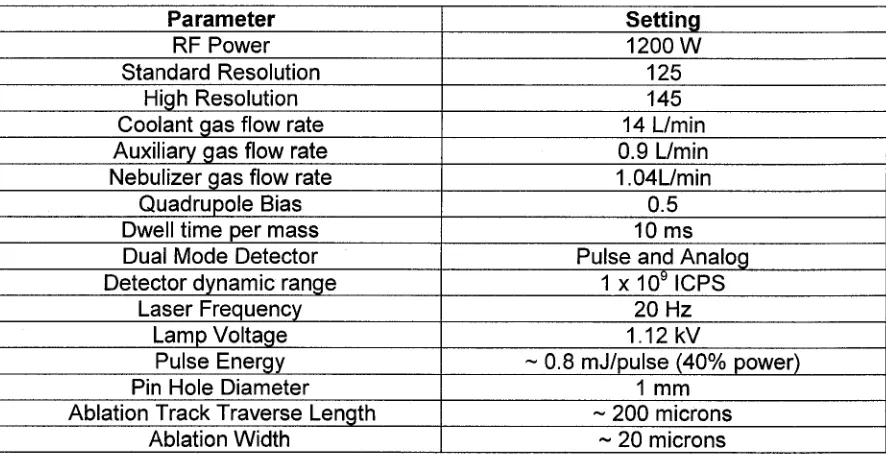
at the University of Windsor in Windsor, ON. GLIER’s LA-ICP-MS instrument is a
non-homogenised, solid state, 266 nm Nd-doped Y-AI garnet (Nd:YAG) laser
connected to a Thermo-Elemental X-7 ICP-MS. The laser ablation parameters
coupled plasma mass spectrometer (ICP-MS) instrumentation and operating
conditions are listed in Table 2.2.
Prior to LA-ICP-MS analysis each disc was wiped clean with ethanol. All
grains were traversed with the laser at a rate of 3 microns/s with a maximum 60 s
acquisition time. Each data acquisition time was preceded by a 60 s gas blank.
All analyses, except for the olivines, had an internal timeslice (time acquisition for
all masses) of 564 ms. The olivines had an internal timeslice of 391 ms.
The analyte list consisted of 41 isotopes for the garnets, clinopyroxenes
and orthopyroxenes: 7Li, 23Na, 25Mg, 27AI, 29Si, 31P, 39K, 44Ca, 45Sc, 49Ti, 51V, 53Cr,
55Mn, 57Fe, 59Co, 60Ni, 66Zn, 85Rb, 88Sr, 89Y, 90Zr, 93Nb, 137Ba, 139La, 140Ce, 141Pr,
146Nd, 147Sm, 153Eu, 157Gd, 159Tb, 163Dy, 165Ho, 166Er, 169Tm, 172Yb, 175Lu, 181Ta,
2°8pb, 232jh^ 238y A rec|ucecj element list of 27 isotopes were analysed in the
olivines to improve the detection limits and to remove elements that were not
detectable in these olivines under these experimental conditions: 7Li, 23Na, 25Mg,
27AI, 29S i,31P, 39K, 44Ca, 49Ti, 51V, 53Cr, 55Mn, 57Fe, 59Co, 60Ni, 66Zn, 85Rb, 88Sr,
89Y, 90Zr, 93Nb, 137Ba, 140Ce, 181Ta, 208Pb, 232Th, 238U. Both analyte lists were
chosen based on exploratory analyses to determine which elements were
detectable under the above experimental conditions.
Data integration regions were chosen using Plasma Lab. Plasma Lab is
the data acquisition and handling software program of the Thermo Elemental X-7
ICP-MS. Sampling the grain laterally, instead of vertically, allowed data
Data reduction was performed with the EMP-analysed Si concentrations,
provided by C.F. Mineral Research Ltd. as the internal standard and NIST 610 as
the external standard. The Si-internal standardised method of processing is
described in Gagnon et al. (2005). Plasma Lab was used to choose the
integration regions most representative of each grain and any peaks in Ba
abundances were used to filter out scan regions affected by contamination.
Calcium was not used as an internal standard in this study because REE, Zr, Hf
and Sr substitute with Ca in the M2 site of clinopyroxenes (Eggins et al., 1998).
Creation of Discrimination Diagrams
Univariant F-statistics, using Systat 6.0 ®, were used to filter the massive
amount of analytical data for the elements and element ratios that are most likely
to discriminate the 3 variables in this study. F statistics tests the mean of the
variance between samples to determine if there is variance between the
variables or not. Element abundances of one population with a high degree of
variance from other populations indicates these elements, or element ratios, may
be useful in distinguishing between the variables tested for in this study; such as
diamond content, craton and pipe. These elements and their ratios were then
used to create simple diagrams to distinguish between the minerals from highly
diamondiferous and poorly diamondiferous pipes, the minerals from the Slave
and Kaapvaal cratons and to distinguish the minerals between each of the 6
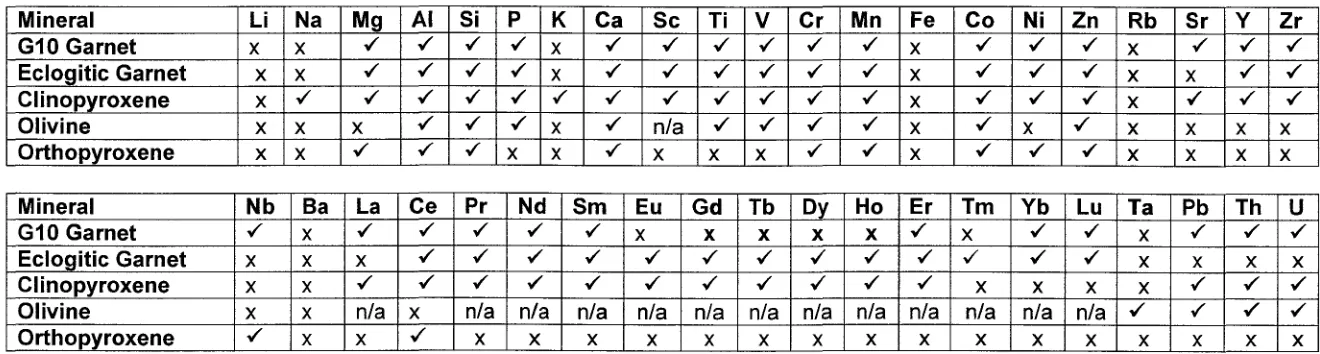
statistics. The elements that had abundances above detection limit for 90% of
the analyses were considered to be consistently detected. Table 2.3 is a list of
the elements that were consistently detected under the conditions of this study.
Systat 6.0 requires a value to be within a given field or the program
deletes the entire sample (or grain in this case) from the data set. To ensure the
maximum number of grains were included in the statistics, the concentrations
that were below detection limit for the most consistently detected elements were
replaced with a value equal to a random number between 0 and 1 and multiplied
by the detection limit for that grain’s analysis.
The calculated below detection limit values were only used to maximise
the number of elements in the creation of potential discrimination diagrams. No
calculated below detection limit values were used in the actual discrimination
diagrams to separate diamond contents, cratons or pipes. Discrimination
diagrams were created using the abundances for each element or element ratio
in the data set and only the diagrams that showed the clearest binary separation
for each variant are displayed and discussed in this study. The binary diagram
format was used for its visual simplicity and its ability to show clear relationships
Pipe Beartooth Koala Panda Kit New
Elands Zero
Diamond
Content High High High Low Low Low
Craton Slave Slave Slave Slave Kaapvaal Kaapvaal
G10 Garnet 20 20 20 20 17 20
Eclogitic
Garnet 20 18 20 20 20 18
Clinopyroxene 20 19 20 20 20 0
Clinopyroxene
Type Peridotitic Peridotitic Peridotitic Eclogitic
Peridotitic (2
Eclogitic)
Peridotitic
Olivine 0 20 20 20 20 20
Orthopyroxene 0 21 0 20 0 20
Table 2.1 A summary of the number of grains available for this study and their descriptions.
Parameter Setting
RF Power 1200 W
Standard Resolution 125
High Resolution 145
Coolant gas flow rate 14 L/min
Auxiliary gas flow rate 0.9 L/min
Nebulizer gas flow rate 1.04L/min
Quadrupole Bias 0.5
Dwell time per mass 10 ms
Dual Mode Detector Pulse and Analog
Detector dynamic range 1 x 10⁹ ICPS
Laser Frequency 20 Hz
Lamp Voltage 1.12 kV
Pulse Energy ~ 0.8 mJ/pulse (40% power)
Pin Hole Diameter 1 mm
Ablation Track Traverse Length ~ 200 microns
Ablation Width ~ 20 microns
R
ep
ro
du
ced
w
ith
pe
rm
is
si
o
n
of
th
e
co
py
ri
gh
t
o
w
ne
r.
Fu
rthe
r
re
production
p
ro
h
ib
it
e
d
w
it
ho
ut
p
e
rm
is
s
io
n
.
Mineral Li Na Mg Al Si p K Ca Sc Ti V Cr Mn Fe Co Ni Zn Rb Sr Y Zr
G10 Garnet X X Y Y Y Y X Y Y Y Y Y y X ✓ ✓ ✓ X ✓ y
Eclogitic Garnet X X Y Y Y Y X Y Y y Y Y X Y Y X X Y Y
Clinopyroxene X y Y Y Y y Y Y Y ✓ y ✓ Y X Y ✓ Y X Y Y Y
Olivine X X X ✓ Y Y X Y n / a ✓ Y Y Y X Y X Y X X X X
Orthopyroxene X X Y y Y X X y X X X ✓ Y X Y Y Y X X X X
Mineral Nb Ba La Ce Pr Nd Sm Eu Gd Tb Dy Ho Er Tm Yb Lu Ta Pb Th U
G10 Garnet Y X Y Y ✓ ✓ X X X X X Y X ✓ ✓ X Y Y
Eclogitic Garnet X X X Y ✓ ✓ ✓ Y ✓ ✓ ✓ Y Y ✓ X X X X
Clinopyroxene X X Y Y Y ✓ Y ✓ Y Y ✓ ✓ Y X X X X Y ✓ ✓
Olivine X X n /a X n /a n / a n / a n / a n / a n / a n /a n / a n / a n / a n / a n / a Y Y Y ✓
Orthopyroxene Y X X Y X X X X X X X X X X X X X X X X
CHAPTER III
RESULTS
Introduction
The minerals used in this study were chosen based on their chemical
similarities to minerals found encapsulated in diamonds and minerals found
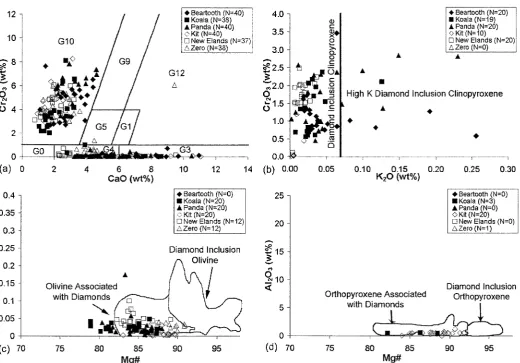
associated with diamondiferous kimberlites. Figure 3.1 compares the data
obtained in this study to the most current classification schemes provided by
Fipke et al. (1995) and Grutter et al. (2004). All the grains from each craton and
kimberlite, regardless of their diamond content, overlap in their abundances and
classify as diamond indicator minerals.
The grains in this study that are outliers to the most current classification
schemes are 2 eclogitic garnets from New Elands, 7 olivines from Koala and 4
olivines from the Panda kimberlite pipe (Figure 3.1). These outlying minerals
were kept in the study because the Fipke et al. (1995) and Grutter et al. (2004)
classification schemes are only guidelines for diamond indicator mineral
classification. C.F. Mineral Research Ltd.’s proprietary classification of diamond
indicator minerals is more rigorous and has already classified all the minerals as
R
ep
ro
du
ced
w
ith
pe
rm
is
si
o
n
of
th
e
co
py
ri
gh
t
o
w
ne
r.
Fu
rthe
r
re
production
p
ro
h
ib
it
e
d
w
ith
ou
t
p
e
rm
is
s
io
n
.
0.4 0.35
0.3 -0.25
0,2 -I 0.15
0.1
0.05 -\ 0 (C) 70
♦ Beartooth (N=40) ■ Koala (N=38) A Panda(N=40) O Kit (N=40) □ New Elands (N=37' A Zero (N=38)
♦ G3 ♦?£♦-, ♦•♦
4.0 -3.5 3.0 = 2 .5
-» *2.0
O1-5 1.0 0.5
|® f 0) !♦ o
u. > Q. O
c
04
‘553
lo C
■ jf a
6 8
CaO (wt%)
0.0 (b) 0.00
I ♦ Beartooth (N=20) I ■ Koala (N=19) [ A Panda (N=20) I OKit (N=10)
□ New Elands {N=20) A Zero (N=0)
High K Diamond Inclusion Clinopyroxene
0.05 0.10 0.15 0.20
KzO (wt%) 0.25 0.30
♦ Beartooth (N=0) 25 - ♦ Beartooth (N=0)
■ Koala (N-20) ■ Koala (N=3)
A Panda (N=20) A Panda (N=0)
O Kit (N=20) ; Kit (N=20)
□ New Elands (N=12) 20 □ New Elands (N=0) I
A Zero (N=12) AZero(N=1)
Diamond Inclusion Olivine
Olivine Associated with Diamonds
75 80
S 15 5,
<n §10
Orthopyroxene Associated with Diamonds
Mg#
Diamond Inclusion Orthopyroxene
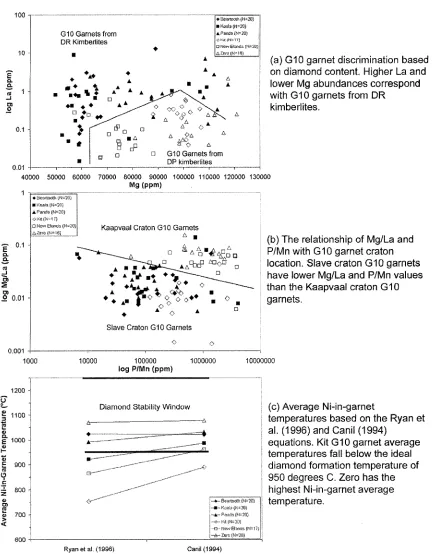
Figure 3.1 LA-ICP-MS major element abundances of this study’s diamond indicator minerals in the most current classification schemes, (a) Grutter et ai. (2004) classification of G10 garnets and eclogitic garnets (G3 & G4). Fipke et al. (1995)
Consistently Detected Elements
This report is an exploratory study for the creation of new classification
diagrams to separate diamond indicator silicate minerals based on their
associated diamond content. The analyte list consisted of 47 isotopes and it was
not expected all the elements would be consistently detected. Some elements
analysed under this study’s conditions have more than 10% of their values below
the detection limit. These elements were considered to be inconsistently
detected; however, some values for the inconsistently detected elements were
above the detection limit. The above detection limit values for the inconsistently
detected elements may lead to better distinction between diamond content and
geological settings in future studies. Therefore, all the elements analysed,
including the inconsistently detected elements, are reported as averaged values
in Figures 3.2, 3.3, 3.4, 3.5 (a) and (b) and 3.6.
The averaged abundances for each mineral’s analyte list are displayed in
this study to show potential elements that may be useful in future research and
are not meant to show patterns of behaviour in relationship to other elements.
The elements in these diagrams are plotted according to their atomic number
and do not imply any petrological relationships to each other or to the rock type in
which they were normalised. Chondrite-normalised REE patterns have been
Orthopyroxene REE patterns have not been characterised in previous studies
since they are not a significant repository of REE (Stachel et al., 1998). To
ensure consistency in the format of this study, the orthopyroxene and olivine
REE values have also been normalised to chondrite. The averaged values for all
the non-REE elements analysed in this study were normalised to Sun et al.
(1989) primitive mantle.
Appendix A contains the LA-ICP-MS results for all the grains analysed in
this study and Table 2.3 is a table of all the consistently detected elements for
each mineral type based on the conditions of this study. All the below detection
limit values in Appendix A are displayed as “< their detection limit” for each
individual grain’s analysis. The precision and accuracy for all the elements,
based on variation in NIST, is between 1 and 10% except the values listed with
the a suffix for Cr, Fe, Co, Ni, Zn, Rb, Zr and Mg# which are between 15% and
20%. Some Fe and their corresponding Mg# values with a precision or accuracy
of > 20% were not reported. Appendix B contains tables of the number of grains
used to calculate the average abundances for all the elements.
G10 Garnet Average Abundances
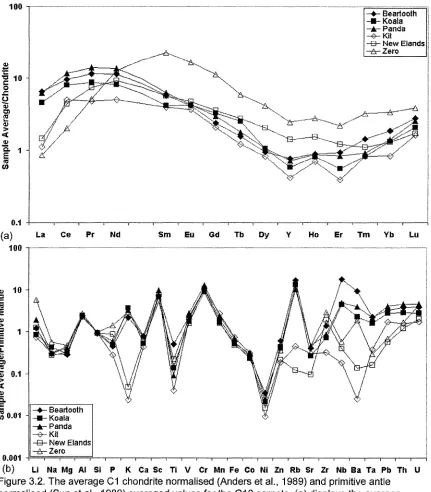
Figure 3.2 (a) and (b) are plots of the averaged abundances for all the
elements analysed in the G10 garnets and generalised conclusions can be made
based on diamond content and craton. Based on the average abundances of all
the elements analysed for the G10 garnets, higher La, Ce, Pr, Nb, Ba, Ta, Pb
kimberlites compared to the G10 garnets from diamond poor (DP) kimberlites.
Lower Dy, Y, Ho, Er, and Zr abundances as well as high Nb values, in G10
garnets characterise the G10 garnets from the Slave craton as compared to the
Kaapvaal craton. None of the G10 garnet averaged abundances are unique to
individual kimberlites. Averaged G10 garnet values show a sinusoidal REE
pattern of enriched LREE and near chondritic HREE when normalised to
chondrite with the exception of Ho which shows a positive anomaly compared to
the Y and Er averaged concentrations.
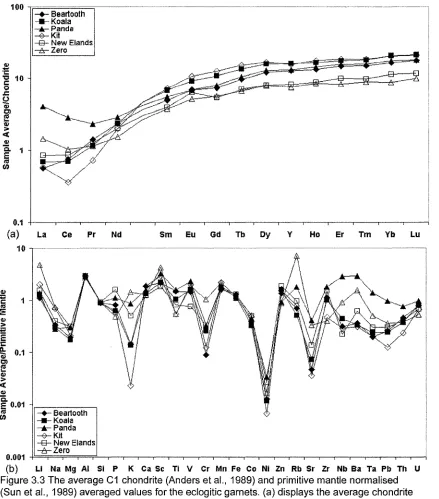
Eclogitic Garnet Average Abundances
Based on the average abundances of all the elements analysed in the
eclogitic garnets (Figure 3.3 (a) and (b)), slightly lower Li, Na and Co
concentrations as well as high Ti and U concentrations are characteristic of
eclogitic garnets from DR kimberlites. Lower Cr abundances in eclogitic garnets
characterise the eclogitic garnets that grew within the Slave craton as compared
to the Kaapvaal craton. Averaged eclogitic garnet element abundances are not
able to distinguish the between the 6 kimberlite pipes. The averaged eclogitic
garnet values display a near chondritic LREE and enriched HREE pattern when
normalised to chondrite.
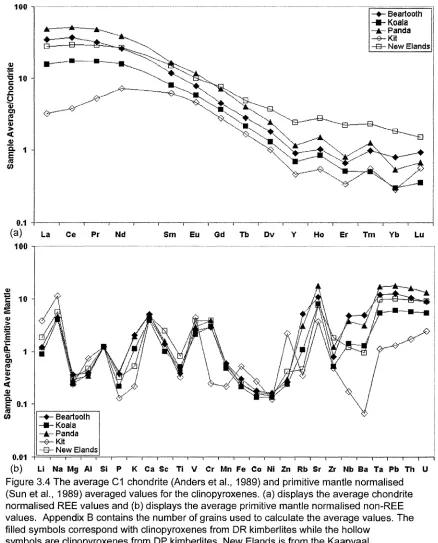
Clinopyroxene Average Abundances
Figure 3.4 (a) and (b) are diagrams of the average abundances of all the
from DR kimberlites as compared to clinopyroxenes from DP kimberlites. Low Y
and HREE abundances in clinopyroxene characterise the average clinopyroxene
that grew within the Slave craton as compared to the New Elands pipe from the
Kaapvaal craton (there were no clinopyroxenes available from the Zero pipe).
Averaged clinopyroxene values display an enriched LREE and near chondritic
HREE pattern when normalised to C1 chondrite with the exception of Ho which
shows a positive anomaly compared to the Y and Er averaged abundances.
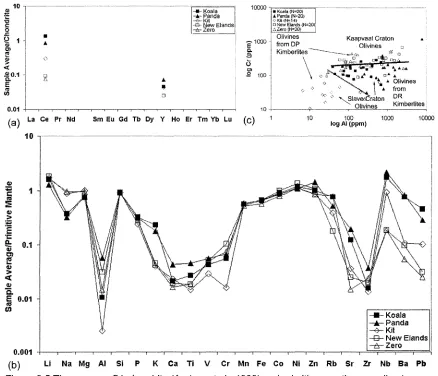
Olivine Average Abundances
The olivines from DR kimberlites have higher Ce, K, Ti, Sr, Nb, Ba and Pb
averaged abundances than the olivines from DP kimberlites (Figure 3.5 (a) and
(b)). High Ce, Sr, Nb, Ba and Pb abundances as well as low Cr values in olivines
characterise the olivines from the Slave craton as compared to the Kaapvaal
craton. There was no clear distinction, based on the average olivine element
abundances, between the 5 pipes analysed in this study.
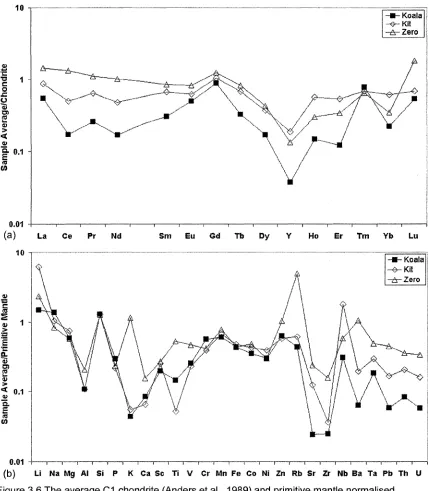
Orthopyroxene Average Abundances
On average, lower REE, Y, Li, K, Rb, Sr, Zr, Ba, Ta, Pb, Th and U
concentrations as well as higher Na, P and Cr concentrations are characteristic
of orthopyroxenes from the Koala kimberlite (a DR kimberlite), as compared to
the Kit and Zero kimberlites (a DP kimberlite) (Figure 3.6 (a) and (b)). Lower Y,
Ho, Er, Yb, Lu, Li, Ti, Rb, Sr, Zr, Nb, Ba, Ta, Pb, Th and U abundances as well
as higher Na and Mg values characterise the Koala and Kit orthopyroxenes that
Kaapvaal craton. The REE, Y, Li, Na, Mg, K, Ca, Ti, V, Cr, Zn, Rb, Sr, Y, Zr, Nb,
Ba, Ta, Pb, Th and U appear distinctive between the 3 pipes according to the
orthopyroxene average element abundances. Averaged orthopyroxene REE
patterns, when normalised to chondrite, show a flat pattern with a negative
100
Beartooth Koala
—Jk~ Panda -O -Kit
-B - New Elands -fe-Zero
•Q—
'1r"
0.1
Pr Net Sm Eu Gd Tb Dy Ho
(a) La Ce Y Er Tm Yb Lu
100
10 S <D > ’«P
*c OL U) E <u > <
a,
g co
0.1
0.01 BeartoothKoala
-h r Panda -O - Kit
S ~ New Elands -A -Zero 0.001
(b ) Li Na Mg Al Si P K Ca Sc Ti V Cr Mn Fe Co Ni Zn Rb Sr Zr Nb Ba Ta Pb Th U
100
Beartooth Koala Panda - e - Kit -B - New Elands -A -Zero
a.
0,1
(a) La Ce Pr Nd Sm Eu Gd Tb Dy Y Ho Er Tm Yb Lu 10
Beartooth
-m- Koala -afc- Panda ■ Kit - a - New Elands -& -Zero
(b ) Li Na Mg Al Si P K Ca Sc Ti V Cr Mn Fe Co Ni Zn Rb Sr Zr Nb Ba Ta Pb Th U
100
'C
XUC
o
sz o
0> cn 12 <D > < fl> a E
10
0.1
(a)
100
c 10 <u > *c a. a> % £ 01 > < a> a
- ♦ - Beartooth Koala
-Jkr Panda —0— Kit - e - New Elands
'''♦Ca'Nsk\NV
X ' V
— --- ,... ...!---1--- r r --- 1--- 1 --- 1--- T t ...
Sm Eu Gd Tb Dv Y Ho Er Tm Yb Lu
« w
0.01
La Ce Pr Nd
0.1
-t
-♦ - Beartooth * - Koala
-A - Panda
-&- Kit ■B- New Elands
(b ) Li Na Mg Al Si P K Ca Sc Ti V Cr Mn Fe Co Ni Zn Rb Sr Zr Nb Ba Ta Pb Th
Figure 3.4 The average C1 chondrite (Anders et al., 1989) and primitive mantle normalised (Sun et al., 1989) averaged values for the clinopyroxenes. (a) displays the average chondrite normalised REE values and (b) displays the average primitive mantle normalised non-REE values. Appendix B contains the number of grains used to calculate the average values. The filled symbols correspond with clinopyroxenes from DR kimberlites while the hollow
10
1 m U) * s <
* 0.1 a E *2 0
0.01
Koala 10C0Q
-A - Panda --A- Kit -&-Zero
? 1000 a a.
O a t ■2 ioo
a Koala <N=20) A Panda N-2Q) c K i t <N=14) o New Elands (N=2Gi A Ze ro (H«2Q)
Olivines from DP Kimberlites
Kaapvaal Craton Olivines
cTj?'- r-*f-4p m
*rr-I*1
'm mOA • * 0
\ |V
.Slave/.CratDn ' Olivines
Olivines from DR Kimberlites
^ La Ce Pr Nd Sm Eu Gd Tb Dy Y Ho Er Tm Yb Lu ( c ) 10 100
log Al (ppm) 1000 10000
10 !
0.01
-HB- Koala —Ar- Panda -Q - New Elands ""A"" Zero 0.001
Li Na Mg Al Si P K Ca Ti V Cr Mn Fe Co Ni Zn Rb Sr Zr Nb Ba Pb
Figure 3.5 The average C1 chondrite (Anders et al., 1989) and primitive mantle normalised (Sun et al., 1989) averaged values for the olivines, (a) displays the average chondrite normalised REE values and (b) displays the average primitive mantle normalised non-REE values, (c) is a simple binary scatter plot showing the separation between the olivines from DR kimberlites (solid symbols) and the olivines from DP kimberlites (hollow sym bols) as well as the separation between the olivines from the Slave craton compared to the olivines from the
Kaapvaal craton. Koala, Panda and Kit are of the Slave craton whereas New Elands and Zero are from the Kaapvaal craton. The number of grains used to calculate the average values for (a) and (b) are in Appendix B. The averaged values show which elements are anomalous when
& ’C "O c o
£ Z u
——'/'}> /
D) 2<d > «
0)
0.01
(a) La Ce Pr Nd Sm Eu Gd Tb Dy Y Ho Er Tm Yb Lu 10 7
S3.
0 . 0 1 “I 1--- 1---t --- s--- 1---1---r---1--- 1--- 1---1---1---1---1---1--- 1--- r --- 1---1--- t --- 1--- t --- 1---1---1—
(b) Li Na Mg Al Si P K Ca Sc Ti V Cr Mn Pe Co Ni Zn Rb Sr Zr Nb Ba Ta Pb Th U
Figure 3.6 The average C1 chondrite (Anders et al., 1989) and primitive mantle normalised (Sun et al., 1989) averaged values for the orthopyroxenes, (a) displays the average chondrite normalised REE values and (b) displays the average primitive mantle normalised non-REE values. Appendix B contains the number of grains used to calculate the average values. The solid symbols represent orthopyroxenes from DR kimberlites. The hollow symbols are
orthopyroxenes from DP kimberlites. Koala and Kit are of the Slave craton whereas
Discrimination Diagrams
Introduction
The ability to discriminate diamond indicator minerals with regards to
diamond content of the host kimberlite has great implications for the diamond
industry as well as understanding diamond geology. There are numerous
combinations of elements and element ratios that have the potential to effectively
discriminate diamond abundance, craton and pipe in diamond indicator silicate
minerals. The elements and ratios that have the potential to discriminate
between diamond contents, cratons and pipes are listed in Appendix C.
Discrimination diagrams were created from the consistently detected elements
(Table 2.2).
G10 Garnet
G10 garnets from highly diamondiferous kimberlites have higher La and
lower Mg abundances than G10 garnets from DP kimberlites (Figure 3.7 (a)).
The most profound difference in Mg values is seen within the minerals from the
Slave craton. The Kit G10 garnets of the Slave craton have almost double the
Mg abundances than the G10 garnets of the same craton (Beartooth, Koala and
Panda).
The binary diagram that exhibits the best separation between the Slave
and Kaapvaal G10 garnets is a log of P/Mn versus the log of Mg/La scatter plot
(Figure 3.7 (b)). Lower P/Mn and Mg/La values are indicative of G10 garnets
The Slave G10 garnets also appear over a wider range of ratios than the more
clustered values of the Kaapvaal craton G10 garnets.
The calculated Ni-in-garnet temperatures using the Canil (1994) and Ryan
et al. (1996) formulae, Figure 3.7 (c), shows Zero G10 garnets are at the highest
average temperatures and Kit G10 garnets have the lowest average
temperatures. Beartooth, Panda, New Elands and Zero G10 garnets are all
within the temperature range of the diamond stability window. Koala’s Ryan et
al. (1996) calculated G10 garnet temperature is below the ideal temperature for
diamond stability; however, Koala’s Canil (1994) calculated average temperature
is within the temperature range of diamond stability. Zero has the highest
average temperature at 1070°C and 1078°C, but this is well below the maximum
diamond stability temperature of 1250°C. The New Elands’ Canil (1994) Ni-in-
garnet average temperature, 961 °C, indicates temperatures are within the
diamond stability window but the Ryan et al. (1996) calculated temperatures
indicates the average temperature was too cool (864°C) for the formation of
diamonds. Both average calculated temperatures for Kit’s G10 garnets fall below
the temperature proposed diamond stability (950°C).
Eclogitic Garnet
Figures 3.8 (a) and (b) display the chemical abundance differences
between eclogitic garnets from DR kimberlites and eclogitic garnets from DP
kimberlites using Mg, Ca, Ti and Mn. Lower Mg abundances, as well as lower
found in DP kimberlites. Higher Ti and higher Ti/Mn ratios also separate the
eclogitic garnets from DR kimberlites as compared to the eclogitic garnets found
in the DP kimberlites. The Ti/Mn values of eclogitic garnets from DP kimberlites
create a unique corridor that makes them even more distinctive from the eclogitic
garnets found in the DR kimberlites (Figure 3.8 (b)).
A Ca versus Co scatter plot (Figure 3.8 (c)) provides the clearest binary
separation of eclogitic garnets from the Slave craton as compared to eclogitic
garnets from the Kaapvaal craton. Slave craton eclogitic garnets are lower in Co
than the Kaapvaal craton eclogitic garnets. The Slave craton eclogitic garnets
also have the highest Ca abundances.
Clinopyroxene
The best separation between the clinopyroxenes from DR and DP
kimberlites is a Zr versus log Ce scatter plot and a Sc versus Zr scatter plot
(Figures 3.9 (a) and (b)). Clinopyroxenes from DR kimberlites have higher Ce
and lower Zr and V abundances than clinopyroxenes from DP kimberlites.
Vanadium content between clinopyroxenes from DR kimberlites and
clinopyroxenes from DP kimberlites shows a marked transition at 300 ppm
(Figure 3.9 (b)).
Figure 3.9 (c), a log of Y versus the log of Zr scatter p lo t, exhibits the best
separation between the Slave clinopyroxenes as compared to the New Elands
relationship between Y and Zr is close to linear within the Slave craton
clinopyroxene.
Y versus Mg (Figure 3.9 (d)) depicts the uniqueness of the clinopyroxenes
from 5 different kimberlite pipes. Magnesium overlaps in abundance for the
Panda, Kit and New Elands grains but Beartooth and Koala have distinctively
higher and lower respective Mg values. In Y, however, Beartooth and Koala
overlap in Y abundances but Panda, Kit and New Elands are distinctive in their Y
concentrations. This distinctiveness seen in these 2 elements allows a simple
binary scatter plot to show the uniqueness of these clinopyroxenes from 5
different kimberlite pipes.
Olivine
The simplest binary diagram that exhibits the best separation between the
olivines from DR and DP kimberlites is the log of Al versus log of Cr scatter plot
(Figure 3.5 (c)). This diagram also exhibits the best separation between the
Slave and Kaapvaal craton olivines. Olivines from DR kimberlites have a
wedged shaped field of Al and Cr abundances that separates them from the
olivines found in the DP kimberlites. The Kit olivines, which are from a DP
kimberlites, exhibit the lowest Al and Cr values overall. The Kaapvaal craton
olivines, i.e. New Elands and Zero, are also from DP kimberlites but they exhibit
the highest Cr values. The uniqueness of the Kit olivines and the higher Cr
values of the Kaapvaal craton olivines causes the diamond content discrimination