INVESTIGATION
Ef
fi
cient Mapping and Cloning of Mutations
in Zebra
fi
sh by Low-Coverage
Whole-Genome Sequencing
Margot E. Bowen,*,†,1Katrin Henke,*,†,1Kellee R. Siegfried,* Matthew L. Warman,*,†
and Matthew P. Harris*,†,2 *Orthopedic Research Laboratories, Children’s Hospital, Boston, Massachusetts 02115, and†Department of Genetics, Harvard Medical School, Boston, Massachusetts 02115
ABSTRACTThe generation and analysis of mutants in zebrafish has been instrumental in defining the genetic regulation of vertebrate development, physiology, and disease. However, identifying the genetic changes that underlie mutant phenotypes remains a significant bottleneck in the analysis of mutants. Whole-genome sequencing has recently emerged as a fast and efficient approach for identifying mutations in nonvertebrate model organisms. However, this approach has not been applied to zebrafish due to the complicating factors of having a large genome and lack of fully inbred lines. Here we provide a method for efficiently mapping and detecting mutations in zebrafish using these new parallel sequencing technologies. This method utilizes an extensive reference SNP database to define regions of homozygosity-by-descent by low coverage, whole-genome sequencing of pooled DNA from only a limited number of mutant F2fish. With this approach we mapped each of thefive different zebrafish mutants we sequenced and identified likely causative nonsense mutations in two and candidate mutations in the remainder. Furthermore, we provide evidence that one of the identified mutations, a nonsense mutation inbmp1a, underlies theweldedmutant phenotype.
A
major strength of the zebrafish (Danio rerio) model is the feasibility of performing large-scale genetic screens as a means to isolate mutants to study gene function. Such forward genetic screens have led to the identification of a large collection of mutants defective in a variety of biolog-ical processes. The standard approach for identifying the responsible mutation underlying a mutant phenotype is to perform bulked segregant analysis with simple sequence length polymorphisms (SSLPs) (Geisleret al.2007), followed byfine mapping using individualfish to define the region in which the mutation lies. Candidate genes within the mapped interval are then screened for the presence of mutations, typ-ically by sequencing cDNA or genomic DNA. This approach istime and labor intensive, requiring large numbers of mutant fish and often years to successfully clone a mutant. To date this is a major limitation in zebrafish research, and large numbers of mutants have not yet been mapped or cloned.
Whole-genome sequencing (WGS) has the potential to expedite the process of mutation detection in zebrafish. In Caenorhabditis elegans and Arabidopsis thaliana, multiple studies have shown that, by pooling from 10 to 500 recombi-nant progeny and sequencing to a relatively high depth, a linked region between 0.5 and 5 Mb in size as well as the responsible mutation can be identified (Schneeberger et al. 2009; Cuperuset al.2010; Doitsidouet al.2010; Zurynet al. 2010; Austinet al.2011; Uchidaet al.2011). Similarly, WGS of individual mutant mice (Arnold et al. 2011) or human patients with genetic disorders (Sobreira et al. 2010) has led to the identification of causative mutations. However, in the case of mice and humans, prior knowledge of linkage was necessary to determine which of the many sequence variants identified in the genome were associated with the phenotype. Mapping mutants by performing WGS has not yet been applied to zebrafish. One prohibitive factor has been the high cost of sequencing an entire zebrafish genome (1.5 Gb, Copyright © 2012 by the Genetics Society of America
doi: 10.1534/genetics.111.136069
Manuscript received October 24, 2011; accepted for publication November 24, 2011 Supporting information is available online at http://www.genetics.org/content/ suppl/2011/12/14/genetics.111.136069.DC1.
1These authors contributed equally to this work.
2Corresponding author: Department of Genetics, Harvard Medical School, and
Orthopedic Research Laboratories, Children’s Hospital Boston, Enders 260.2, 300 Longwood Ave., Boston, MA 02115. E-mail: [email protected]
compared to 100 Mb forC. elegansand 120 Mb forA. thali-ana). However, new sequencing platforms have increased the throughput of sequencing and reduced its cost, now making it practical to obtain low-coverage sequence data of an entire zebrafish genome. A second prohibitive factor for applying WGS for mutation detection in zebrafish is the high level of inter- and intrastrain variation (Stickneyet al.2002; Guryev et al. 2006; Bradley et al. 2007; Coeet al. 2009) and the absence of a well-annotated catalog of natural variation; con-sequently, this makes it more difficult to determine whether a novel homozygous variant is a causative mutation or a low-frequency single-nucleotide polymorphism (SNP). This con-trasts with the inbred organisms for which WGS has been successfully applied (Schneeberger et al. 2009; Cuperus et al. 2010; Doitsidouet al.2010; Zurynet al.2010; Austin et al.2011; Uchidaet al.2011). Here, we describe the estab-lishment of an extensive zebrafish SNP database. Using this database in combination with low-coverage (3·) WGS, we developed a rapid and inexpensive method to efficiently map, and frequently clone, recessive mutations in zebrafish. Fur-thermore, the methodology described here can be used to identify genetic loci in other model organisms with larger and highly polymorphic genomes that have annotated genomes, such as rats, mice, dogs, chickens, and other fish species.
Materials and Methods
Zebrafish husbandry and strains
Zebrafish were raised and maintained as described (Nüsslein-Volhard and Dahm 2002). Mutants were identified in the 2004 ZF-MODELS screen performed at the Max-Planck Institute for Developmental Biology (MPI-EB) in Tübingen, Germany. Mu-tant and wild-type strains were obtained from stocks at Child-ren’s Hospital, Boston (TüB, WIKB, AB, and TLF) and at the
MPI-EB (TüGand WIKG). Theminamoto(motot31533),welded
(wddt31169), hollow (hlwt3373), fruehrentner (frntt31786), and
schrumpfkopf (sumpt3625) mutants were generated in the Tü
background. For mapping, the majority of mutants were out-crossed to the WIK line, except forsump, which was crossed to TLF. F2crosses were screened for the phenotype and identified
mutants and siblings were frozen.
Linkage analysis
Linkage was assessed by analysis of microsatellites (SSLPs) and SNP markers on genomic DNA from single fish using standard PCR amplification and, in the case of SNPs, analysis by dideoxy capillary sequencing.
Morpholino injections
A morpholino directed against the translation initiation site of bmp1a(MO1) (Jasujaet al.2006) was injected at a concen-tration of 0.3 mMinto one-cell stage Tü embryos. The
pheno-type was assessed at 3 days postfertilization (dpf).
Genomic DNA library construction and Illumina sequencing
For each mutant or parental strain, genomic DNA from 20 adult fish was pooled (150–250 ng from each fish—also easily obtainable from larvae), and 3–5mg was sheared to an average size of 200 bp, using Adaptive Focused Acoustics following the manufacturer’s protocol (Covaris). For three samples (wdd,sump, andfrnt), the shearing step was omit-ted, since the genomic DNA appeared degraded, with most fragments being,250 bp in size as assessed by electropho-resis on a 4% agarose gel. To construct DNA libraries, the DNA fragments were blunt-ended, 59phosphorylated, A-tailed, and ligated to adaptors as previously described (Bowen et al. 2011), with the exception that adaptors did not have a 3-bp barcode sequence, and the volume of AMPure XP beads used for purification was 1.4· rather than 3.0·. Phusion High-Fidelity DNA polymerase (Finnzymes) was then used to am-plify 12ml (30%) of each library, in a total of four 50-ml PCR reactions, using the“postcapture”primers described in Bowen et al.(2011). Eight cycles of PCR were used forwddand six cycles for all other samples. Each amplified library was se-quenced on one lane of an Illumina HiSeq2000, using 100-bp single-end sequencing. Since the number of reads obtained forfrnt, TüG, WIKG, andsumpwas lower than expected, one
lane of GAII 100-bp single-end sequencing was also per-formed for each of these samples.
Illumina data analysis
To determine the physical size of the 20-cM windows used to calculate the mapping score, the MGH mapping panel was downloaded from ZFIN (http://zfin.org/zf_info/downloads. html#marker). A script was written to obtain the Zv9 genomic coordinate of each marker from Ensembl (http://useast. ensembl.org/index.html). A genomic coordinate could be ob-tained for 2100 of the 3845 markers. Seventy markers mapped to more than one location and were excluded from the analysis. In addition, a BLAST search was performed tofind the coordi-nates of some markers that did not have genomic coordicoordi-nates listed in Ensembl. These markers were then used to approximate the genomic coordinate of sliding 20-cM windows throughout the genome, with a new window starting every 0.25 cM.
Annovar (http://www.openbioinformatics.org/annovar/) was used to classify variants as noncoding, synonymous, or nonsynonymous and to determine whether variants were listed in the publically available SNP database, downloaded from Ensembl (http://useast.ensembl.org/info/data/ftp/ index.html). To identify variants present in only one read (which would not have been identified using SAMtools/ BCFtools multisample variant calling), the SAMtools mpi-leup command was performed on all mutants and reference strains, for all coding exons, and a perl script was used to select variants unique to each mutant. All perl scripts, as well as aligned sequencefiles for each wild-type strain, are available online athttp://www.fishyskeleton.com.
Results
Sequencing libraries generated from pooled DNA
We performed WGS onfive previously uncharacterized mutants isolated in an ENU mutagenesis screen for adult phenotypes (ZF-MODELS; Tübingen, Germany, 2004). These recessive mutants, generated in the Tü background, were outcrossed to a polymorphic mapping strain (WIK or TLF) (Supporting In-formation,Figure S1); progeny from F1intercrosses were
phe-notyped and frozen for analysis. We pooled DNA from 20 affected F2fish from each mutant, mixing, when possible,
indi-viduals from several independent F1intercrosses. The F2fish
used often stemmed from either one or two parental (P0)
crosses for a particular mutant, thus limiting the total genomic variation within a pool. Whole-genome sequencing was per-formed on genomic DNA libraries constructed from each mu-tant pool, resulting in between 60 and 83 million 100-bp reads per library (Table 1). We obtained between 2.6· and 4.1· coverage of the genome per mutant, after excluding 2–9% of the reads that were potential PCR duplicates (reads with iden-tical 59-end coordinates) and25% of reads that failed to map to unique locations in the reference genome (Zv9).
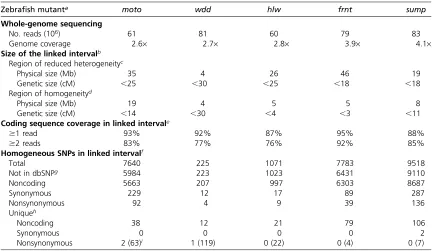
We also sequenced the genomes of four routinely used wild-type strains to establish a database of existing SNP variation. This information enabled us to predict the parental origin of SNP alleles in our mutant pools. Tü and WIK strains Table 1 Characteristics of linked intervals identified by whole-genome sequencing
Zebrafish mutanta moto wdd hlw frnt sump
Whole-genome sequencing
No. reads (106) 61 81 60 79 83
Genome coverage 2.6· 2.7· 2.8· 3.9· 4.1·
Size of the linked intervalb
Region of reduced heterogeneityc
Physical size (Mb) 35 4 26 46 19
Genetic size (cM) ,25 ,30 ,25 ,18 ,18
Region of homogeneityd
Physical size (Mb) 19 4 5 5 8
Genetic size (cM) ,14 ,30 ,4 ,3 ,11
Coding sequence coverage in linked intervale
$1 read 93% 92% 87% 95% 88%
$2 reads 83% 77% 76% 92% 85%
Homogeneous SNPs in linked intervalf
Total 7640 225 1071 7783 9518
Not in dbSNPg 5984 223 1023 6431 9110
Noncoding 5663 207 997 6303 8687
Synonymous 229 12 17 89 287
Nonsynonymous 92 4 9 39 136
Uniqueh
Noncoding 38 12 21 79 106
Synonymous 0 0 0 0 2
Nonsynonymous 2 (63)i 1 (119) 0 (22) 0 (4) 0 (7)
aminamoto(motot31533),welded(wddt31169),hollow(hlwt3373),fruehrentner(frntt31786), andschrumpfkopf(sumpt3625). bIntervals identified by a high mapping score; linkage was confirmed by analysis of SSLP or SNP markers.
cRegion with a reduction in heterogeneity of at least 30% compared to the genome-wide average. dDefined as a region with a.90% reduction in heterogeneity compared to the genome-wide average. eCoding sequence of RefSeq and Ensembl genes.
fDetected homogeneous variants covered by at least two sequencing reads.
gHomogeneous variants not present in the publicly available SNP database (dbSNP) downloaded from Ensemble. hHomogeneous variants not present in the reference strain database established in this study.
iThe number of unique nonsynonymous mutations covered by only one sequencing read.
are commonly used in laboratories around the world. To as-sess the diversity among parental strains, we generated WGS from lines maintained at Children’s Hospital Boston (TüBand
WIKB) and the Max Planck Institute in Tübingen, Germany
(TüG and WIKG). DNA libraries, constructed from pooled
DNA from 20 fish for each of the TüB, WIKB, TüG, WIKG,
TLF, and AB lines, were sequenced and 3.8·to 5.1·average genome coverage was obtained (Table S1).
Establishment of a reference SNP database
With low-coverage sequencing of pooled DNA, it is challeng-ing to distchalleng-inguish true SNPs from sequencchalleng-ing errors as many variants are represented by only a single sequencing read. However, if the same variant is observed in more than one strain, it is more likely to be a real SNP than a sequencing error. Therefore, to enhance the accuracy of SNP detection we combined the WGS data from all wild-type strains and mutants, resulting in 50·genome coverage, and then selected only the variants that were present in at least three reads for inclusion in our SNP database (seeMaterials and Methodsfor filtering criteria). Although variants present in only one or two reads in the combined data could also represent real SNPs, many are likely to represent sequencing errors or alignment artifacts and therefore were not included in the database.
In total, we identified a set of 7.6 million SNPs (http:// www.fishyskeleton.com), which is substantially greater than the 0.7 million zebrafish SNPs currently annotated in publi-cally available databases. Of the SNPs in public databases, 85% were detected in at least one read in our sequence data, and 45% had been included in our SNP database since they met allfiltering criteria (such as being present in at least three reads). Importantly, 7.3 million of the SNPs we identified were not previously annotated, thus vastly expanding our knowledge of genetic variation in zebrafish. Using the indi-vidual WGS data from pooled DNA for each mutant and wild-type strain, we were then able to classify each SNP within that sequence as being either heterogeneous (at least one read representing each SNP allele was observed) or homoge-neous (all reads represented the same allele). In each pool, an average of2 heterogeneous and3 homogeneous SNPs were observed per kilobase of genomic sequence (Table S2).
Identification of strain-specific diversity
To allow us to predict the parental origin of alleles in mutant pools, which facilitates mapping based on homozygosity-by-descent, we identified alleles that differed between parental strains. In the 7.6 million total SNPs identified, an alternate allele (with respect to the Zv9 reference genome, which is based on the Tü strain) was observed at 3–4 million sites in each wild-type line (Table S1). Consistent with previous reports noting a high degree of variation within each zebra-fish strain (Stickneyet al.2002; Guryevet al.2006; Bradley et al.2007; Coeet al.2009), the vast majority of these sites were heterogeneous (i.e., had reads representing both the reference and the alternate alleles) (Table S1). Thus, to identify SNPs that differed between lines, we selected SNPs
at which all reads represented the reference allele in one line, while the other line had at least one read representing an alternate allele. When only the SNPs with sequence cov-erage in all six lines (5.2 million) were considered, any two lines differed at 40% of loci (Figure S2A), which is in agreement with previous estimates of interstrain diversity (Stickney et al. 2002). The majority (72%) of SNPs were shared by at least three lines, while only 11% were unique to a single line (Figure S2B). For use in our mapping studies, we selected all sites at which alternate alleles were present in the strain used for outcrossing (TLF or WIK), but not in the strain used for mutagenesis (Tü). These alternate alleles were referred to as“mapping strain alleles”and consisted of 0.74 million and 1.2 million alleles for the TLF and WIK strains, respectively (Figure S2, C and D). In each mutant pool, these sites were analyzed for the presence or absence of the mapping strain allele (Table S2).
Mapping mutants using homozygosity-by-descent
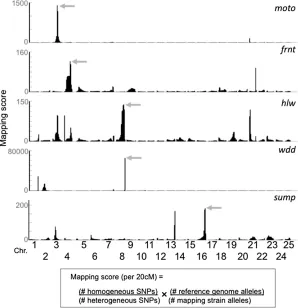
We next mapped each mutant on the basis of homozygosity-by-descent. For each mutant pool, we scanned the WGS data for regions with two characteristics: having a reduced level of heterogeneity and a reduced level of SNPs originating from the outcrossed strain, relative to the genome-wide averages of these measures. To quantify these characteristics, we designed an algorithm that produced a“mapping score,”using sliding windows throughout the genome (Figure 1). Since we ex-pected a characteristic footprint to span at least 10 cM on either side of the causative mutation (Figure S1), a window size of 20 cM, tiled at 0.25-cM intervals, was utilized. We based the window size on genetic distance (centimorgans) rather than physical distance (megabases), to take local re-combination rates into account. This makes the analysis more accurate in regions close to centromeres and telomeres. Once regions with high mapping scores were identified for a partic-ular mutant, we independently tested linkage to these regions by the use of SSLP or SNP markers on DNA pools as well as in individual progeny (Table S3). In each of the five mutants analyzed, we confirmed that the region with the highest map-ping score was linked to the mutation (Figure 1).
could then be analyzed for sequence variants that alter the expressivity of the mutant phenotype.
Our approach has two major differences from those previously used to mapC. elegans andA. thalianamutants (Schneeberger et al. 2009; Cuperuset al. 2010; Doitsidou et al. 2010; Zuryn et al. 2010; Austin et al. 2011; Uchida et al. 2011). First, our analysis is based on genetic rather than physical distance. Second, we combine the levels of homogeneity and strain-specific SNP signatures to map the locus. Wefind that this analytical method provides a robust and reliable means to correctly map the region linked to the mutation in zebrafish (Figure S3andFigure S4).
The genetic architecture of linked regions
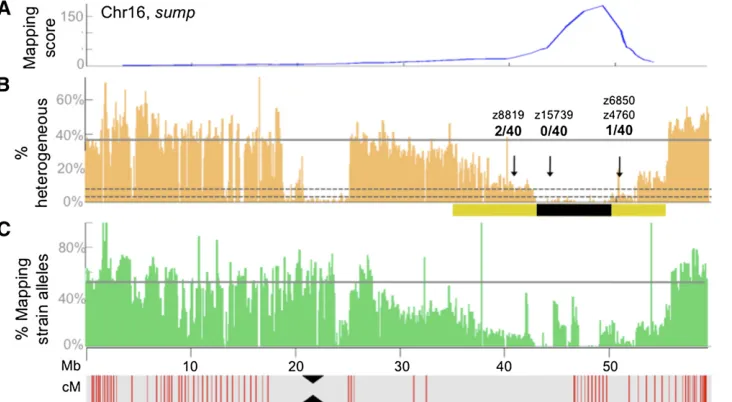
We further refined the linked interval by identifying an area of homogeneity within the broader region defined by our mapping algorithm. Since 20 fish were pooled for each mutant, we expected the region of homogeneity to span, on average, 2.5 cM on either side of the causative mutation (one recombinant per 40 meioses). Because of the low resolution of the genetic map, we utilized 100-kb windows (rather than centimorgans) to facilitate fine mapping of the interval. Assuming random sampling of alleles with only3· cover-age, we expected and confirmed that linked regions contain-ing two recombination events had an 81% reduction in heterogeneity compared to unlinked regions, while regions containing one recombination event had a reduction in het-erogeneity of90% (Figure 2 andFigure S1). We found that regions without recombination events were almost, but not
completely, homogeneous, likely due to false positive variants resulting from sequencing errors or alignment artifacts. Therefore, we defined a candidate region of homogeneity as having a reduction in heterogeneity.90%. This approach allowed us to narrow down the candidate interval in each mutant to a region between 4 and 19 Mb in size (Table 1).
Identifying candidate phenotype-causing mutations within linked intervals
One of the powerful aspects of WGS is that it provides a large amount of sequence information throughout the candidate interval, allowing for the exclusion of much of the sequence in the interval as harboring the causative mutation. Additionally, the sequence allows the potential to identify the causative change. In thefive mutants analyzed, between 76% and 92% of the coding sequence within the candidate interval was covered by at least two sequencing reads (Table 1). We iden-tified hundreds to thousands of homogeneous variants in each candidate interval, of which between 4 and 136 were pre-dicted to be nonsynonymous. However, we could exclude most of these variants as being causative for the phenotype since we also observed them in the WGS from the other un-affected strains (Table 1). In two of thefive mutants we iden-tified the likely causative mutation as a nonsynonymous change covered by at least two reads; these particular changes are predicted to encode nonsense alleles. In the three other mutants, unique nonsynonymous changes covered by two or more reads were not detected, but between 7 and 22 non-synonymous changes were present in sequences covered by Figure 1Mapping zebrafish mutants based on homozy-gosity-by-descent. Individual graphs depict the mapping scores along each chromosome for the five different mutants (moto,frnt,hlw,wdd, andsump). The mapping score is calculated as the ratio of homogeneous to hetero-geneous SNPs, multiplied by the ratio of reference alleles to mapping strain alleles in sliding windows. The size of the sliding windows is 20 cM with an overlap of 19.75 cM between adjacent windows. Physical distances were con-verted to genetic distances using markers from the MGH meiotic map that have been mapped onto the Zv9 refer-ence genome. In each of thefive mutants, the region with the highest mapping score in the genome (shaded arrows) was subsequently confirmed as containing the linked in-terval, using SSLP or SNP markers.
one read (Table 1). Further studies will be required to de-termine whether these single-read variants represent sequenc-ing errors, normal variation, or phenotype-caussequenc-ing mutations. A benefit of having performed WGS is, apart from being able to map the mutation in all mutants analyzed and to identify candidate coding mutations, that.87% of the cod-ing sequence within the interval could be excluded because it did not differ from the reference data set. A second benefit of having performed WGS is that homogeneous SNPs iden-tified in the candidate interval can serve as markers to test for linkage in additional F2 fish, which will allow one to
further refine the candidate interval.
The nonsynonymous changes we identified in the welded (wddt31169) and theminamoto(motot31533) mutants exemplify
the value of the WGS method. For themotomutant, charac-terized by defective spermatogenesis, two nonsynonymous mutations (Table 1), covered by two and three reads respec-tively, were identified within the linked interval, one missense and one nonsense mutation. The nonsense mutation was con-firmed to be homozygous in all 20fish sequenced. This muta-tion lies within a novel gene (ENSDARG00000090664) that is conserved in vertebrates. Consistent with the observed sper-matogenesis defects in the mutants, this gene is expressed in testes among vertebrates ( http://www.ncbi.nlm.nih.gov/unig-ene) and thus is a strong candidate for causing themoto phe-notype. For the wdd mutant, characterized by its adult craniofacial phenotype, only one nonsynonymous change, which was supported by eight reads, was detected in the linked interval (Table 1). This change creates a nonsense mutation (p. R227X) in the gene encoding Bone morphogenetic protein 1a (Bmp1a). PCR amplification and capillary dideoxy sequencing of the genomic region in individual F2mutants and siblings
confirmed the mutation and linkage to the mutant phenotype (0 recombinants in 66 meioses). It previously had been shown that morpholino-mediated reduction of Bmp1a function in zebrafish impairs larval development, leading to a wavyfin fold phenotype (Jasujaet al.2006). We detected a similar larvalfin phenotype inwddmutants and confirmed that this phenotype occurs in wild-type embryos injected with a morpholino target-ing the translation initiation site ofbmp1a(Figure 3). Thus we show that the nonsense mutation in bmp1ais the likely caus-ative mutation underlying thewddphenotype. With a causative mutation in hand, it is now possible to investigate the mecha-nistic basis of this skeletal phenotype.
Minimum genome coverage needed for mapping
mapping”approach it would be unlikely to identify the caus-ative mutations using the generated sequence alone.
Discussion
We show that recessive zebrafish mutations can be efficiently mapped and cloned using low-coverage WGS of only 20
pooled mutant progeny. While WGS has been used in other experimental models, such as C. elegans and A. thaliana (Schneeberger et al. 2009; Cuperus et al. 2010; Doitsidou et al. 2010; Zuryn et al. 2010; Austin et al. 2011; Uchida et al.2011), the size and polymorphic diversity of the zebrafish genome posed unique challenges. By constructing an extensive SNP database using WGS from six different wild-type lines, we Figure 3 Identification of a loss-of-function allele of Bmp1a that underlies the wdd mutant phenotype. (A) The mapping-score plot for wdd is shown for Chr8, which contained the highest mapping score in the genome. In the graphs below, the genetic architecture of the linked region is shown. Annota-tion is similar to Figure 2. The locaAnnota-tion of the nonsense mutation within bmp1a that lies in the candidate interval is in-dicated (arrow). (B) Lateral view of adult wild-type and homozygouswddmutant fish. Mutant fish are characterized by frontonasal shortening of the skull and deformed tailfins (red arrows). (C) Lat-eral view of wild-type, wdd mutant, andbmp1amorpholino-injected larvae. Mutant and morphant larvae show a similar characteristic wavy appearance of theirfin folds (red arrowheads) at 3 dpf, which is not observed in wild-type larvae. Insets show a higher magnifi ca-tion of the distal part of thefinfold.
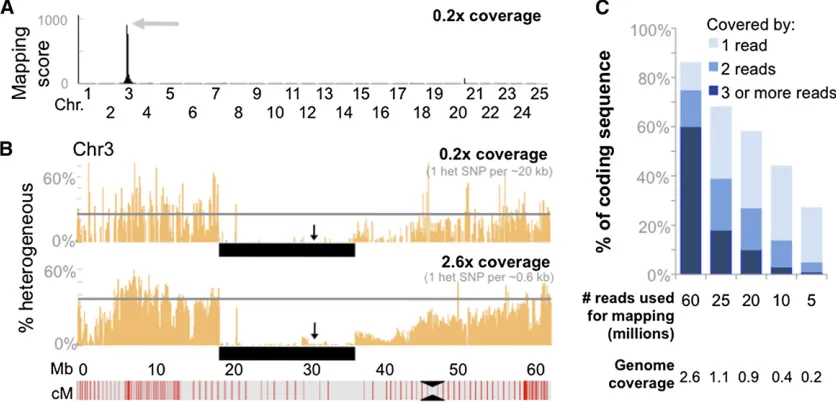
Figure 4 Mapping of mutants using only0.2·genome coverage. (A) Graph depicting the genome-wide mapping score plot for themotomutant generated with a randomly selected subset (5 million) of the total sequencing reads, which results in a genome coverage of 0.2·. (B) Graph depicting the percentage of SNPs that were classified as heterogeneous in nonoverlapping 100-kb windows along Chr3. The arrow indicates the location of a SNP marker that was used to confirm linkage (0 recombinants in 40 meioses). While the overall number of detectable heterogeneous SNPs is reduced with a genome-wide coverage of only 0.2·, the boundaries of the linked interval can be identified just as well as with 2.6·coverage. The black bar underlies the region of homogeneity. (C) Graph depicting the loss in coverage of coding sequence that occurs as genome-wide coverage decreases.
increased the accuracy of mapping as well as the ability to distinguish phenotype-causing mutations from previously un-annotated SNPs. This newly identified SNP database, contain-ing millions of SNPs, is an order of magnitude larger than the SNPs previously annotated within publically available data-bases. This large database allowed us to identify strain-specific SNP signatures, which facilitated our detection of intervals that were homozygous-by-descent.
An alternative strategy of mapping mutants using WGS would be to separately sequence pools of mutants and unaffected siblings, rather than using a comparison to wild-type strains. With the limited recombination rate within the 20 fish sequenced, both strategies would provide similar resolu-tion of the mapping interval. Using a sequence data set representing50·coverage, we increase the accuracy of iden-tifying SNPs within the mapping interval without the need for low-coverage sequence data from siblings. Additionally, analy-sis of the siblings for each mutant would double the cost per mutant analyzed. We think that the strain-specific and refer-ence SNP databases we created provide a more efficient means of analyzing sequence data from multiple mutants in parallel. This SNP data set can be utilized by a large number of researchers to facilitate mapping of mutants (data and scripts available athttp://www.fishyskeleton.com).
It is important to note that the detection of candidate mutations depends not only on the genome coverage obtained by WGS, but also on the quality and extent of the genome assembly that is used as a reference; in regions with poor genome assembly, lack of detection of a causative mutation will not be remedied by higher sequencing depth. Further improve-ments in assembly of the zebrafish genome, in the SNP database, and in massively parallel sequencing will enhance the sensitivity and specificity of our mapping approach. At present, low-coverage WGS using pooled DNA samples pro-vides a fast and efficient means for mapping and identifying recessive mutations in zebrafish, allowing for more timely determination of altered gene function and systematic analysis of genetic regulation of vertebrate development and physiology.
Acknowledgments
We thank Iris Koch, Ursula Schach, Jennifer Zenker, Brigitte Walderich, and Hans-Georg Frohnhoefer at the Max-Planck Institute Tübingen as well as Christian Lawrence and Jason Best at the Children’s Hospital Boston facilities for help with maintaining and providing fish from their respective facili-ties. The authors also thank David R. Beier, at Brigham and Women’s Hospital Boston, for discussions and sharing un-published ideas and Tom Carney at the Institute of Molecu-lar and Cell Biology, Singapore, for discussion about his unpublished work on bmp1. M.E.B. is an Albert J. Ryan Fellow. M.L.W. is an investigator with the Howard Hughes Medical Institute. M.P.H is supported by a Glenn Foundation
Award and a New Scholars Award from the Ellison Medical Foundation.
Literature Cited
Arnold, C. N., Y. Xia, P. Lin, C. Ross, M. Schwander et al., 2011 Rapid identification of a disease allele in mouse through whole genome sequencing and bulk segregation analysis. Ge-netics 187: 633–641.
Austin, R. S., D. Vidaurre, G. Stamatiou, R. Breit, N. J. Provartet al, 2011 Next-generation mapping of Arabidopsis genes. Plant J. 67: 715–725.
Bowen, M. E., E. D. Boyden, I. A. Holm, B. Campos-Xavier, L. Bonafe
et al., 2011 Loss-of-function mutations in PTPN11 cause meta-chondromatosis, but not ollier disease or maffucci syndrome. PLoS Genet. 7: e1002050.
Bradley, K. M., J. B. Elmore, J. P. Breyer, B. L. Yaspan, J. R. Jessen
et al., 2007 A major zebrafish polymorphism resource for ge-netic mapping. Genome Biol. 8: R55.
Coe, T. S., P. B. Hamilton, A. M. Griffiths, D. J. Hodgson, M. A. Wahab et al., 2009 Genetic variation in strains of zebrafish (danio rerio) and the implications for ecotoxicology studies. Ecotoxicology 18: 144–150.
Cuperus, J. T., T. A. Montgomery, N. Fahlgren, R. T. Burke, T. Townsend et al., 2010 Identification of MIR390a precursor processing-defective mutants in Arabidopsis by direct genome sequencing. Proc. Natl. Acad. Sci. USA 107: 466–471.
Doitsidou, M., R. J. Poole, S. Sarin, H. Bigelow, and O. Hobert, 2010 C. elegans mutant identification with a one-step whole-genome-sequencing and SNP mapping strategy. PLoS ONE 5: e15435.
Geisler, R., G. J. Rauch, S. Geiger-Rudolph, A. Albrecht, F. van Bebberet al., 2007 Large-scale mapping of mutations affecting zebrafish development. BMC Genomics 8: 11.
Guryev, V., M. J. Koudijs, E. Berezikov, S. L. Johnson, R. H. Plasterk
et al., 2006 Genetic variation in the zebrafish. Genome Res. 16: 491–497.
Jasuja, R., N. Voss, G. Ge, G. G. Hoffman, J. Lyman-Gingerichet al., 2006 Bmp1 and minifin are functionally redundant in regu-lating formation of the zebrafish dorsoventral axis. Mech. Dev. 123: 548–558.
Nüsslein-Volhard, C., and R. Dahm, 2002 Zebrafish: A Practical Approach. Oxford University Press, Oxford.
Schneeberger, K., S. Ossowski, C. Lanz, T. Juul, A. H. Petersenet al.,
2009 SHOREmap: simultaneous mapping and mutation
iden-tification by deep sequencing. Nat. Methods 6: 550–551. Sobreira, N. L., E. T. Cirulli, D. Avramopoulos, E. Wohler, G. L.
Oswaldet al., 2010 Whole-genome sequencing of a single pro-band together with linkage analysis identifies a Mendelian dis-ease gene. PLoS Genet. 6: e1000991.
Stickney, H. L., J. Schmutz, I. G. Woods, C. C. Holtzer, M. C. Dickson
et al., 2002 Rapid mapping of zebrafish mutations with SNPs and oligonucleotide microarrays. Genome Res. 12: 1929–1934. Uchida, N., T. Sakamoto, T. Kurata, and M. Tasaka, 2011 Iden-tification of EMS-induced causal mutations in a non-reference Arabidopsis thaliana accession by whole genome sequencing. Plant Cell Physiol. 52: 716–722.
Zuryn, S., S. Le Gras, K. Jamet, and S. Jarriault, 2010 A strategy for direct mapping and identification of mutations by whole-genome sequencing. Genetics 186: 427–430.
GENETICS
Supporting Information
http://www.genetics.org/content/suppl/2011/12/14/genetics.111.136069.DC1
Ef
fi
cient Mapping and Cloning of Mutations
in Zebra
fi
sh by Low-Coverage
Whole-Genome Sequencing
Margot E. Bowen, Katrin Henke, Kellee R. Siegfried, Matthew L. Warman, and Matthew P. Harris
)( ""$&('"'(+(.#($$Ā"&(#"#')'"!$$"'#!$ '. &#''""(!)("('&&."&''+4")!)((#"576,("(*&#)"0(#$# .!#&$!$$" '(&"0522062)("(&&&'5*736#(<"&(#"&(""(&&#''(#"&(=$&#".2'=' &'#&('#"($&'"#&'"#(!)("($"#(.$256'$&$&&#!=;=!)("($&#". 5*73*76"$## "%) %)"(('2&!$('(?;&#!#'#!'#"(""$"#(.$4)'"4 ")!)((#"5&'(&'6!#"(=;!)("('2!)((#"' "(#"#!'%)"#&"("&#!(* '(&")'#&!)("''5&.&!"('62#!""('+"'%)"#&"("&#!(#)(&#'''(&"5 &!"('6"#'&+(&"('("'&#!()'(+!)((#"'&') (#!#(&#!"(#")&" !#''"(<"&(#"2" #(8<;&#!()'(+!)((#"0,-$(."(#"0?#(?; !)((#"4#"(""&#!#'#!'(#'#,!$$"'(&" 5"1 '%)&6'&') (#!#( &#!"(#"256.' &(#"(#"#&#!(=;!)("('$&#)'&!"('0((#"("( #&!"(#"5#-#&(*"#&( '6056# "#!'%)""#(&!"( &&.'$&#&!#"'" "#" )!" %$ (#&!&') (""8>-"#!#+&256&# (.#& (("'"#!#"#)'#&(&#"#)'"$## &#!=;!)("(''%)"(#>-#+&2' & '''#!#"#)' >&'#+&"(&$&'"(('! 5$&# (.I$>H%>6"'
(&#"#)'#( '&&$&'"(5$&# (.I>$=%H>$%=62"")" "&#"0,&#( '&%) . &$&'"(5%I;2@1$I;2@60($&# (.#"(('(&#"#)'';2B@2,'0"&#"',&<;G #(&#!#'#!'&&#!""(0'"#)&-!$ 0'(('( .?#)(#?;5%I;2<6&',#) '#,(!$$"4'(&" 560, >A#)(#?;5$I;2D6,#) '#,(&&" 51*62)'($&# (.#(("(" (&#"#)''((';2=B2&#&0(")!&#(&#"#)''"("')&#"'-$((#8A?G #,&(""")" "&#"5;2=B3;2B@IA?G62! & .08D;G&)(#""(&#"(.'-$(#&&#"' #"(""<&#!""(&#!#'#!0, 8=@G&)(#"'-$(#&&#"',(<;&#!""(&#!#'#!'2 #&"(#('" .'')'" #,"#!#+&0(,#) #"#"((#$## &&")!&'#'(# "&'(&'# )(#"#!$$"2'($&# (.#(("'" &#!""("0#&-!$ 0?;'5C;
,,'
#&!#)!""#!"##'&!#!31",./!'"
!"#("#'!#""'#!#""##!(!#$"$ $"#!##!#!!")("#(-(-"#,"'!"""(!(
#!!'""!&+'#"##!#'""!&#",./
!"'#$!(!"."/#!#+"'"#$!"'# '#""!"!,!././+("#"'#" $&!"'!"!.5,3"#"$#
#7,6##"#"/,./!""'#"##'!""""#!","
'##! $'#!$""#! $'"#!"" ##""#%"*!""&#!"#&#!#$"##!$""+!", ##!#!!"#"#!"+!'!",)!#%$##"'(+
*#"&!$#!/0!""$""&&"/-"()&#%!.2*10 #&#&&"*#"#"&!'##*!!&#"#!!
$##*!#!$##"+ ,)#!"#'!##!"#!#
&##"#!#* # $##")#!!""&#"#!#!!"# "#!"+!!&",*"!"#%!#$"##!$""*!') !#$##)!!/."&"#"#!#$"##!$"")$##"!" #%!#!!"#"#!"+!!&,*!')#"""#%!"&$ !"$#&!"!$!'""#$"&$!"""'###$##*
""
"
#(, $%!
* $%!)'" (,
!$ %
$%"
$%"$%!
-+" *!
"$% +)#!,&'*&'! $&'$ , #!&.-)'&*'$
! ##!+$!*
#& '$
,,' !
-#) 0!"
."/
&!
0" .!/
?#
% <: 8,4( 5,9 ;;
% ;4 7,4( 5,8 ;<
<9 7,4( 5,< 97
;4 7,3( 6,8 :6
<3 7,9( 6,6 :<
<4 6,;( 5,< 89
$!433!"#)$"" $,$!"#"#'#"#!
!!"##!#'""!&,)"#"##:,9"#"##""#$)'!
!
!"',#
3*%#%4
%!'"%!"& 3*%#%4
"
('!'#"" ' "!2% !1
##! &'%!
%! !"
80< 70? 80> 80: 70< 70<
807 70; 908 909 70: 70:
80= 70; 90; 807 70; 70>
908 70< 908 70= 70< 70=
80> 808 907 70< 70= 70<
('"%'=0< "!&'&!'!'&&'(,0&+%!&'%"!"(&3 '4"%&'&'+
"'%%!!" 3*?4!!'%!'+%"&%*!'"#""0&+%!& " "!"(&3 " 4"%&'&'+"!,''%!'3!"!2%4"%'%%!!" 3%4+%"&%*/ &'&''+%"*%,&&'!9&$(!!%&+% (!!"% '*3!140('"%&'&'+
!!
$%
$% "
+
)1#+.!. 11., +,!+ *"1(
0 -)!0#-- -+!- ("..
0
,+#,/ *-*)(
/)+(
,+ ,-!.
*",, )",.
,
)-#*/!0 ))-+0
*(,-(
*+!) *,!,
+",, *",,
).
,)!0#-)!* 00)1
)-/+1 ,./( .0-,
,)!+ ,+!1 -(!0 -(!.
*"-. ("-. )",( )",(
! !
! !