Leaf Disease Detection Using Fuzzy Logic
Vinaya Mahajan1, N.R.Dhumale2
P.G. Student, Department of E&TC, Sinhgad College of Engineering, Pune, India1
Assistant Professor, Department of E&TC, Sinhgad College of Engineering, Pune, India1
ABSTRACT: Agricultural productivity is something on which economy highly depends. This is the one of the reasons that disease detection in plants plays an important role in agriculture field, as having disease in plants is quite natural. If proper care is not taken in this area then it causes serious effects on plants, due to which respective product quality, quantity and/or productivity is affected. For instance a disease named little leaf disease is a hazardous diseasefound in pine trees in United States. Detection of plant diseases through some automatic technique is beneficial as it reduces thetedious work of monitoring in big farms of crops, and at very early stage itself it detects the symptoms of diseases i.e. when they appear on plant leaves. This paper presents an algorithm for image segmentation technique which is used for automatic detection and classification of plant leaf diseases. Image segmentation, which is an important aspect for disease detection in plant leaf disease, is done using genetic algorithm. It uses fuzzy logic for detection of plant disease. The parameters are skewness, extract mean and extract deviation. A test image is taken and compared with database image and then dissimilarity is calculated with extracted parameters.
KEYWORDS: Extract Mean, Extract Deviation,fuzzy logic, GLCM feature extractionImage segmentation.
I.INTRODUCTION
Agriculture is an important source of income for Indian people. Farmers can grow variety of crops but diseases hamper the growth of crops. One of the major factors responsible for the crop destruction is plant disease. Diverse plants experience the ill effects of various diseases. The primary piece of plant to look at the sickness is leaf. The real classes of plant leaf ailments depend on viral, parasitic and microscopic organisms. The diseases of leaf can diminish both the quality and amount of products and their further development. The simple strategy to identify the plant diseases is assistance with the help of farming master knowing about plant ailments. Be that as it may, this manual location of plant sicknesses takes parcel of time and is an arduous work. Henceforth, there is a requirement for machine learning strategy to identify the leaf illnesses. Computer can assume a major part to build up programmed techniques for the discovery and order of leaf diseases. There can be different example acknowledgment and picture handling methods that can be utilized as a part of the leaf sickness identification. The leaf infection recognition and order of leaf illnesses is the way to keep the horticultural misfortune. Distinctive plant leaves bear diverse sicknesses. There are diverse sorts of techniques and classifiers to recognize plant leaf sicknesses. Programmed identification of plant infections is a vital errand as it might demonstrate valuable in checking expansive field of harvests, and consequently naturally identify ailments from side effects that show up on plant clears out. Thus automatic detection of plant disease with the help of image processing techniques provide more accurate and guidance for disease management. Comparatively, visual identification is less accurate and time consuming. Hence, it is required to design and develop a machine learning method to detect disease.
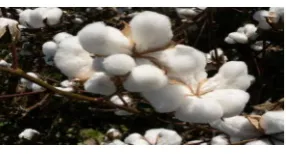
Following be the cotton plant description
• Cotton is a soft, fluffy staple fiber that grows in a boll, or protective capsule, around the seeds of cotton plants
of the genus Gossypium.
• Current estimates for world production are about 25 million tones annually. China is the largest cotton
production in world
• The United States are the largest exporter for many years.
Fig 1.1 cotton flower
The brief discussion about the further topics is described inthis section. The next section, section II describes about theprior and related work. In this section a summary of relatedwork is described elaborately with the demerit and accuracyobtained by the method used. Section III describes about theproposed methodology. In this section the methodology usedprocedure Section IV shows the experimental results obtained and discussion by the method used. Accuracy and Conclusion is explained in Section V. This section clearly portrays the drawback of the proposed system, gives a brief description about the work to be carried out in future.
II.RELATEDWORK
Sachin D. Khirade and et al [1]: Identification of the plant infections is the way to keeping the misfortunes in the yield and amount of the agrarian item. This paper likewise examined some Feature extraction and order systems to separate the highlights of contaminated leaf and the grouping of plant infections.The utilization of ANN techniques for characterization of infection in plants, for example, self-arranging highlight outline, proliferation calculation, SVMs and so forth can be proficiently utilized. We can precisely recognize and group different plant maladies utilizing picture preparing method.
Prof. Sanjay, B. Dhaygudeet al [2]: the use of surface measurements for distinguishing the plant leaf ailment has been clarified Firstly by shading change structure RGB is changed over into HSV space in light of the fact that HSV is a decent shading descriptor. Concealing and expelling of green pixels with pre-processed edge level.
Amandeep Singh, ManinderLal Singh et al [3]: the most critical test looked amid the work was catching the quality pictures with greatest detail of the leaf shading. This was taken care of by utilizing a Nikon made D5200 camera which served the undertaking extremely well. Second test confronted was to dispose of light conditions as from begin to the finish of paddy edit season, brightening changes a ton notwithstanding when the picture getting time is settled. However the answer for this is variable client characterized thresholding and making essential changes in accordance with the shades of LCC.
III.METHODOLGY
Fig. 3.1 shows the block diagram of the system. A digital camera or any other optical instrument for recording or capturing images, may be used for obtaining the image of the leaf. After obtaining the photo, the image is resized. The resized image is then filtered using median filter. After filtering, image segmentation is performed on the image. Otsu’s model is used for this purpose. This is followed by the process of feature extraction and classification. The classification step makes use of the fuzzy classifiers.
Fig. 3.1Block Diagram of the system
The block by block explanation of the system is given below. 1. Take image from leaf database
2. Pre-processing
Image pre-processing typically denotes a processing step transforming a source image into a new image which is fundamentally similar to the source image, but differs in certain aspects, e.g. improved contrast. According to the above definition, pre-processing results in changing the brightness of individual image pixels. This step includes the physical transformation of the RGB and the gray scale image. Image pre-processing typically denotes a processing step transforming a source image into a new image which is fundamentally similar to the source image, but differs in certain aspects, e.g. improved contrast. According to the above definition, pre-processing results in changing the brightness of individual image pixels. This step includes the physical transformation of the RGB and the gray scale image and resizing of the image. In that pre- processing image have been taken 320*220 pixel size for all data set.
3. Filtering:
In signal processing, a filter is a device or process that removes some unwanted components or features from a signal. Filtering is a class of signal processing, the defining feature of filters being the complete or partial suppression of some aspect of the signal.Most often, this means removing some frequencies or frequency bands. There are many type of filtering Median filtering, Gaussian filtering, low pass filtering, high pass filtering. In this paper use Median filtering technique use.
Median Filter: -
It is a nonlinear type of digital filter which is used to remove the noise from the signal and image. It is used to enhance the quality of the signal. The advantage of the median filter it gives the precise output and it preserves edges while removing noise. Median filtering is one kind of smoothing technique, as is linear Gaussian filtering.
4. Image Segmentation:-
Image segmentation is a crucial process for most image analysis consequent tasks. Especially, most of the existing techniques for image description and recognition are highly depend on the segmentation results. Segmentation splits the image into its constituent regions or objects. In that image segmentation technique by using otsu thresholding method detect the disease. First level of segmentation only detect defected area of leave then second level of segmentation detect the leaf disease part.
Input
Image
Resize
Filtering
Image
segmentation
Feature
Extraction
5.Feature extraction:-
In machine learning, pattern recognition and in image processing, feature extraction starts from an initial set of measured data and builds derived values (features) intended to be informative and non-redundant, facilitating the subsequent learning and generalization steps, and in some cases leading to better human interpretations. Feature extraction is related to dimensionality reduction.
For texture analysis
1. Contrast:
It returns a measure of intensity contrast between pixel and its neighbourhood over the whole image. Contrast will be
zero for a constant image. It is given by,
Contrast=∑( ( − )) ∗ ( , ) (1)
2. Dissimilarity
dissi =∑( ( − )∗ ( , ) (2)
3. Energy:
It returns the sum of squared element in GLCM. It is also called as uniformity or uniformity of energy or angular
secondary moment. Energy is one for a constant image.
Energy = ∑( ( , ) ) (3)
4. Homogeneity
It returns a value that measures the closeness of the distribution of element in GLCM to GLCM diagonal. It ranges
from [0 1]. Homogeneity is 1 for a diagonal GLCM. It is given by
Homogeneity=∑( ( , )(1 + ( − ))) (4)
5. Entropy
Frist order entropy is dependent on the homogeneity of the image. Homogeneity lowers the entropy of an image.
Entropy = ∑( ( , )∗log( , ) + ) (5)
Colour Movement
1. Skewness
Skewness is measure of symmetry or more precisely, the lack of symmetry a distribution or data set, is symmetric if it is looks same to the right and left of the centre of point.
2. Extract Kurtosis
A positive kurtosis image would have a fairly uniform distribution of gray levels but not too many at the external values while a negative kurtosis image would have mid-level gray levels that are fairly dominant and another wise uniform distribution.
3. Extract Mean
4. Extract standard deviation
The Standard deviation reveals something about the contrast of image in particular bin.
6. Classification
Here, we are using the fuzzy logic for the classification purpose. In recent years, the number and variety of applications of fuzzy logic have increased significantly. The applications range from consumer products such as cameras, camcorders, washing machines, and microwave ovens to industrial process control, medical instrumentation, decision-support systems, and portfolio selection.
In this phase of classification, extraction and comparison of co- occurrence features for the leaves with corresponding feature value are stored in the feature dataset.
Fuzzification is method of translating crisp value into linguistic value. Each input need to undergo fuzzification for the fuzzy controller to translate the input into output. In order to fuzzify a value, a membership function needed. Defuzzification is method of translating the linguistic value back into crisp value. The measurement of success of classification is done by using the classification gain and following eq. (6) is used for calculation:
Gain (%)= No of classification/ Total no of test images *100 (6)
IV.EXPERIMENTAL RESULTS
The GLCM technique is applied for extracting the feature of leaf. The dataset is created 57 infected leaf which is include Alternaria, Cerespora and Gery mildw.
Step 1: Take leaf image from database
Fig. 4.1 Leaf Step 2: Resize the leaf image
Step 3: Apply the filtering process
Fig. 4.3 Leaf Filtering Step 4: Segmentation of leaf image
Fig. 4.4 Leaf Segmentation Second level of segmentation
Fig. 4.5 OTSU’s Thresholding Apply fuzzy classifier
Fig 4.6 Alterneria Disease
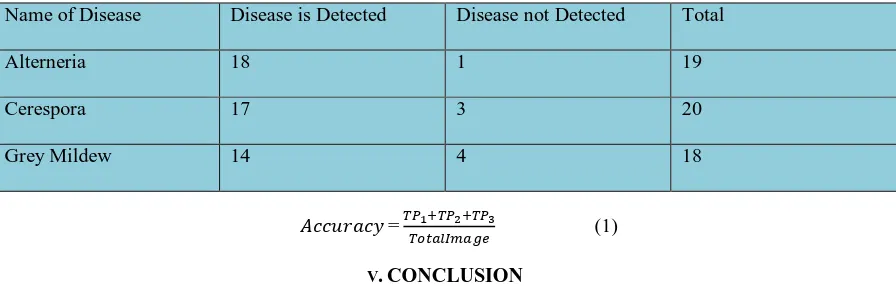
Table 5.1 Leaf Disease Detection
Name of Disease Disease is Detected Disease not Detected Total
Alterneria 18 1 19
Cerespora 17 3 20
Grey Mildew 14 4 18
= (1)
V.CONCLUSION
This project focusses on an image processing technique that has been used for detection of plant diseases. 57 images of leaves are tested. The system uses the Otsu’s method for segmentation purpose. The feature extraction parameters used are mean, standard deviation, entropy, extract standard deviation, extract kurtosis, skewness. The system gives higher accuracy as compared to the techniques used in the past. By using Fuzzy Logic it gives an accuracy of 88% for detection of leaf diseases.
REFERENCES
[1] Sachin D. Khirade, A.B Patil, “Plant Disease Detection Using Image Processing”, International Conference on Computing Communication Control and Automation”, 2015.
[2] Sanjay B. Dhaygude, Mr.Nitin P.Kumbhar, “Agricultural plant Leaf Disease Detection Using Image Processing”, International Journal of Advanced Research in Electrical, Electronics and Instrumentation Engineering Vol. 2, Issue 1, January 2013.
[3] Amandeep Prof Singh ,Maninder Lal Singh, “Automated Color Prediction of Paddy Crop Leaf using Image Processing”, International Conference on Technological Innovations in ICT for Agriculture and Rural Development (TIAR 2015), 2015.
[4] Mr. Pramod S. landge, Sushil A. Patil, Dhanashree S. Khot, “Automatic Detection and Classification of Plant Disease through Image Processing”, International Journal of Advanced Research in Computer Science and Software Engineering, Volume 3, Issue 7, 2013.
[5] M.Malathi, K.Aruli , S.Mohamed Nizar, A.Sagaya Selvaraj, “A Survey on Plant Leaf Disease Detection Using Image Processing Techniques”,International Research Journal of Engineering and Technology (IRJET),Volume: 02 Issue: 09, Dec 2015.
[6] Malvika Ranjan, Manasi Rajiv Weginwar, NehaJoshi, Prof.A.B. Ingole, “detection and classification of leaf disease using artificial neural network”, International Journal of Technical Research and Applications, 2015.
[7] Y.Sanjana, AshwathSivasamy, SriJayanth, “Plant Disease Detection Using Image Processing Techniques”,International Journal of Innovative Research in Science, Engineering and Technology, Vol. 4, Special Issue 6, May 2015.
[8] Mr. Pramod S. landge, Sushil A. Patil, Dhanashree S. Khot, “Automatic Detection and Classification of Plant Disease through Image Processing”, International Journal of Advanced Research in Computer Science and Software Engineering, Volume 3, Issue 7, 2013.
[9] Heeb Al Bashish, Malik Braik, and Sulieman Bani-Ahmad, “A Framework for Detection and Classification of Plant Leaf and Stem Diseases”, IEEE 2010.
[10] Satish Madhgoria, MarekSchikora, and Wolfgang Koch, “Pixel-BasedClassificationMethodforDetectingUnhealthy RegionsinLeafImages”, 2009
[11] PawanP.Warne, Dr.S.R. Ganorkar“ Detection of Diseases on Cotton Leaves Using K-Mean Clustering Method”, International Research Journal of Engineering and Technology(IRJET) Volume: 02 Issue: 04 | July-2015, 425-431.
[12] ]Daisy Shergill, AkashdeepRana, Harsimran Singh “Extraction of rice disease using image processing”,International Journal Of Engineering Sciences & Research technology,June, 2015,135- 143.