Leak-induced fracture propagation modeling
S. Patil ~), S. Krishnamurthy ~), A. Tripathi 2) 1) Fluidyn, Bangalore, India
2) Transoft International, Saint-Denis, France
ABSTRACT
A new method of fluid/structure interaction, implemented into
fluidyn-FSI,
has been used to simulate a crack propagation along the walls of a hollow cylinder and due to a fluid pressure wave. This method consists of coupling the finite volume approach for fluids to the finite element approach for structures inside the same solver.A crack propagation and fluid flow through the crack opening was simulated using the fluid-structure interaction code
fluidyn-FSI.
A hollow cylinder with an initial small axis crack contains high pressure fluid. The high pressure wave hitting the cylinder causes the crack to propagate and the crack opening area to widen. The study deals with tracking the crack propagation (Mode I).Two independent models, one for the two-phase flow through the leak and the other for the crack propagation were used to analyze the flow and temperature effect on the crack propagation. The coupling was done using an explicit boundary condition between the two models. The structural mesh consisted of thick plate elements with a crack energy estimation at the crack tip. A failure criteria based on a limiting Von Mises stress value was used to propagate the crack. The fluid flow was modeled in finite volumes with the two-phase representation through a Clausius-Clapeyron resolution to determine the liquid and gas phases. In the absence of any microscale measured data, the results were analyzed with respect to the qualitative representation of the physical phenomena.
The present paper demonstrates the capability of FLUIDYN-FSI code for simulating fluid-structure interaction problem involving crack propagation and fluid flow. The study also demonstrates the novel scheme of coupling finite- element-based stress solver and finite-volume-based fluid solver employed in FLUIDYN-FSI code. The simple and computationally efficient remeshing scheme employed in the code ensures compatibility between the structural and fluid meshes.
I N T R O D U C T I O N
High-speed interaction between two structures or a structure and a fluid requires simultaneous modeling of large deformations of structures and shock propagation in fluids. On one hand, modeling of varying flow regimes and boundary conditions in fluids is better managed by finite volumes. Physical representation is also easier because results do not suffer from the numerical distorsion related to the shape function of the finite elements. On the other hand, modelling of structural deformations is usually better done with finite elements because the structural tridimensional complexities are difficult to follow in finite volumes. It allows also for larger integration time-steps. However, until now, available softwares have been using exclusively one of the two methods to model both fluids and structures. Therefore the user had to accept approximate solutions either in fluids or structures depending on the method preferred.
fluidyn-FSI,
probably the only commercially available software of its kind. offers simultaneous use of bothstructures finite elements (for structures) and finite volumes (for fluid) formulations implemented inside the same solver. Therefore all kinds of structural state equations, laws of plastifications, damage and spalling, as well as all kinds of fluid state equations and boundary conditions, can be introduced without any hesitation. Boundary conditions between finite volumes and finite elements are exchanged automatically.
After a quick overview of
fluidyn-FSI
software, the case of the propagation of a crack in a cylindrical tank is presented. The geometry, meshes, boundary and initial conditions are described, before presenting and analyzing the results.T H E S O F T W A R E
fluidyn-FSI
gathers, inside one solver, two models • a fluid solver in finite volumes and a structural solver infinite elements. The two solvers are coupled through an automatic boundary information exchange. A more complete description of the solvers can be found in [ 1 ].
Fluid model
The fluid model is based on
fluidyn-NS
software, designed to solve the Navier-Stokes equations to compute internal and external flows in complex 3D geometries with high-order numerical schemes. Various finite volume schemes are available (Roe, Van Leer, Roe Preconditioned, AUSM, Partial Donor Cell, HLLC, etc) and can be chosen according to the kind of application encountered. The numerical precision of the schemes can be as high as the third order and the mesh can be structured, unstructured or hybrid. Several equations of state are also available, including two-SMiRT 16, Washington DC, August 2001
Paper # 2011phase equations of state for phase change or for two-phase dispersed flows. Flows range from incompressible (e.g. sloshing) to highly compressible phenomena (e.g. detonation). Simultaneous presence of multiple fluids is possible and, in certain conditions, two or more numerical schemes can be used for different parts of a same domain [2] [3] [4].
Structural model
Though
fluidyn-FSI
offers the possibility to model the structures in Finite Volumes whenever the strain rate is very high (such as in the case of target penetration), the finite element structural model is generally used for the modelling of complex 3-D structures [5] [6]. The elements available for general use are beams, thin plates and tetrahedrons. The formulation of high strain rates and displacements is constantly updated and has been validated through nuclear and aerospace industries cases. The material equation of state can be elastic, elasto-plastic, piecewise stress-strain curve with isotropic or orthotropic behaviour, etc., coupled with a material database. Generally admitted plastification and spalling laws, such as Steinberg, Guinan and Johnson & Cook, in which temperature and pressure effects, are also available. Stable timesteps for shell elements in particular are computed through the formulation of [7].Coupling of fluids and structures
At the fluid/structure interface, the structural solver computes the corresponding deformations and structure velocities, taking into account the loads due to the fluid pressure. The fluid mesh adjusts itself to the new position of the structure while preserving continuity of the normal component of the velocity. The fluid remeshing is automatic and the fluid variables are redistributed. The new distribution of fluid nodes leads to a new pressure field in the fluid. This cycle is repeated till convergence. When explicit integration is used for the stress model, the stable timestep for integration may be smaller tahn the fluid timestep. This necessitates a finite number of substeps of the stress model to complete one cycle of fluid model. However, by using implicit integration, one cycle of the stress model is sufficient to reach the timestep of the fluid cycle.
D E S C R I P T I O N OF CASE
The simulation undertaken here deals with a crack propagation along the length of a cylindrical container due to a fluid pressure wave. The pressure wave is generated at the center of the cylinder, as a large amount of energy is suddenly released and hits the wall. It is assumed that a longitudinal crack already exists at the center of the container wall. As the pressure wave moves closer to the structure, stresses at the crack tip start increasing and make the crack grow.
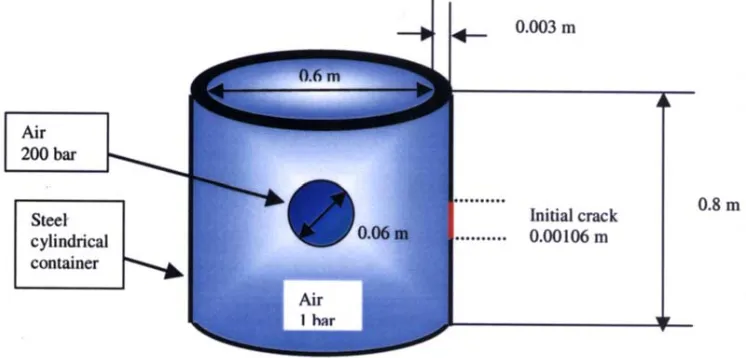
A schematic drawing of the case is presented in figure 1. The cylindrical container is made of steel. Its length is 0.8 m and its diameter is 0.6 m. The thichkness of the walls is constant and equal to 0.003 m. A longitudinal crack is assumed to already exist at 0.4 m from bottom (at the middle of the container wall). Initially, the crack is 0.0106 m long.
The container is filled with air at atmospheric pressure. At the initial time, the energy release is represented by a spherical region of 0.06 m of diameter at 200 bar of pressure and located at the spheroid of the cylinder.
Air 200 bar
Steel cylindrical container
0.06
0.003 m
Initial crack
0.00106 m m
0.8 m
MODEL
Finite element library for structural analysis includes 2 noded beam, 3 noded shell and 8 noded brick (hexahedral) elements. Though singularity elements achieves greater accuracy for a given computational effort, usage is made of simpler linear elements as they are found to be computationally attractive in explicit integration. Mode I fracture is considered in the present study. For crack propagation analysis, an initial crack is supposed to exist in the structure and the path of propagation of crack is known apriori. Also the crack is expected to propagate along edges of elements. In the finite element mesh of the structure, the elements are separated along the propagation path, but are initially 'bound' together using Multipoint Constraints. During transient simulation, stresses expected to develop at the crack tip and when a specified stress (principal Or Vonmises stress) at the crack tip reaches the specified limiting value, the displacement constraint at the node is released, effectively unbinding the structure at this crack tip. The new crack tip is now positioned at the next node along the crack propagation path (figure 4). Table 1 contains the material characteristics.
Table 1. Structural model
Material Steel
Integration scheme Equation of State Youn~ modulus Poiss0n ratio Density
Explicit Linear elastic
210 GPa 0.3 7800 kg/m 3
The fluid domain inside the cylinder is modeled with 6 noded wedge and 8 noded brick elements. Also employed is the degenerate hexahedron along the inner side of the crack propagation path. These degenerate elements have a degenerate face (zero face area) along the path of crack propagation. During simulation, fluid pressure causes the structure to deform. The fluid mesh is then remeshed autoadaptively to conform to the deforming structural mesh. The degenerate faces of the fluid mesh along the crack propagation path open up as the structure deforms due to pressure and as the crack propagates. The originally degenerate faces, which now open up, correspond to the crack opening and the fluid outflow through these faces constitute outflow through the crack opening (figure 5). Table 2 contains the characteristics of the fluid. The fluid inside the cylinder is air at two different initial pressures. For that purpose, a two- phase equation of state is used. The flow is compressible and laminar. The numerical scheme used is the HLLC scheme.
Table 2. Fluid model
Fluid Compressible Equation of State Laminar viscosity Prandtl number Scheme
Air
Yes Two-phase
0.0001001 0.91 HLLC
MESH
In view of symmetric characteristics of the case, only a quarter of model is considered for simulation (figure 2).
Fig. 2: Domain of simulation
crack propagation path is modeled with degenerate hexahedral elements with 2 edges collapsing (effectively forming a wedge). These elements participate during crack opening and become non-degenerate during simulation. The resulting meshes can be seen in figure 3.
S T R U C T U R A L M E S H F L U I D M E S H
Fig. 3 : Meshes : on the left-hand side, the structural mesh and on the right-hand side, the fluid mesh
B O U N D A R Y C O N D I T I O N S
Boundary conditions for structure
The top and bottom of the cylinder are fixed. In the symmetric model considered, all nodes at z=0.4 m are fixed and symmetry conditions are applied along the symmetry planes z = 0 and y = 0. The crack propagation path is in the symmetry plane y = 0. In this case, instead of the multipoint constraints, the specified displacement boundary conditions are relaxed during crack tip failure. The crack tip failure criterion is specified by the limiting Vonmises stress of 500 MPa. The shell surface is subjected to a constant l bar atmospheric pressure on the outside and a variable fluid pressure on the inside. The structure is initially at rest.
Line along which crack Propagates . Failure criteria
Von Mlses Stress
S T R U C T U R A L B O U N D A R Y C O N D I T I O N S
Zon,
Initial Crack T i p
Zoomed View Of A
FLUID B O U N D A R Y CONDITIONS "--}J
/ / .-." . .... ... .,... ~ :-~-~ - ~j,/., -~-,., ... , ,,"!..< .,,~
Y - M i n l m m u m Symmetry Plane ", _ . "
i'll ,, . !
Initial Degenarated Element- ii t i
This Face Opens Up as the li t /
Crack starts Widening and Is . . . !.i- ~X !
treated a s a p r e s s u i ' e o u t f l o w -'~" I " X
_J
Fig 4. Left : Structural boundary conditions along the line of crack propagation. Right : Fluid boundary conditions on Y-minimum plane
Boundary conditions for fluid
Fluid remesh conditions
During autoadaptive remeshing of the fluid domain, the fluid boundary at the fluid-structure interface follows the deforming structure. The inner nodes of the structure are moved appropriately to get a smooth fluid mesh. However, constraints need to be imposed on the remaining fluid boundary nodes so as to retain the integrity of the fluid domain. These are specified as remesh conditions influidyn-FSI. The following remeshing conditions are specified for the present study.
1. z-displacements are fixed for fluid nodes the bottom (symmetry plane) and top of the cylinder. 2. y-displacements are fixed for fluid nodes at Y = 0 plane (symmetry plane)
These conditions allow the fluid nodes in the symmetry planes to move in the plane during remeshing resulting in better aspect ratio for the new mesh generated.
INITIAL C O N D I T I O N S
Initially the structure is assumed to be at rest. At t=0, the central spherical portion of air (figure 1) is at a pressure of 200 bar and the surrounding fluid is at atmospheric pressure (1 bar). To model this, the fluid is initialized in terms of energy and density corresponding to 200 bar for the high-pressure zone and to 1 bar for the rest of the fluid. The fluid is assumed at rest initially.
Table 3 Initial fluid conditions according to the pressure regions
Zone Energy (MJ) Density (kg/m 3) Velocity (m/s)
High pressure (200 bar) 1.79 491.2 0
Low pressure (1 bar) 0.42 958.6 0
RESULTS AND DISCUSSION
Crack propagation
The initial crack tip reaches the failure limit around 0.26 ms at which time the boundary condition at this node is relaxed. The new crack tip is now positioned at node 3 and pressure acting on the structure now induces stresses to build up at the new crack tip. The process continues till the last node (24) along the crack path fails at 446 ms.
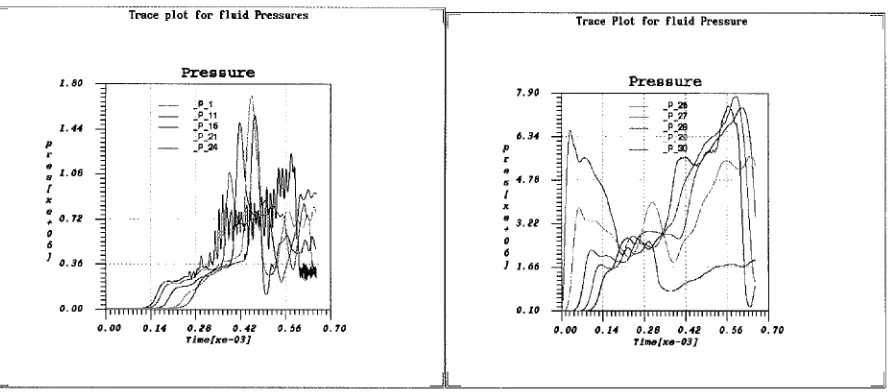
Figure 5 shows Von-Mises stresses at certain nodes along crack path. The plot shows gradual increase in stress due to fluid pressure and oscillations in stress value as the boundary condition is released at the node. The oscillations are due to sudden change in the boundary condition. Figure 6 shows, on the left, fluid pressure at the same location as the structure nodes in 6. The pressure oscillation start when the crack tip is opened. On the right of figure 6, fluid pressure are plotted at nodes in the radial direction. Pressure at P_26 (near the crack path) drops due to the opening of the crack tip and the subsequent outflow through the opening.
Trace Plot f o r Yon H i s e s S t r e s s e s
3 . 5 0
,~ 2 . 8 0 - - _
t =_
r -
B 2 . 1 0 -
_
l -
x 1 . 4 o - -
e -
-[ _
0
9 0 . 7 0 -
] -
O. O0 I l l O. O0
S t r e s s
YON211 i /
- - VONj16 : /
: VON.:21 i /
... i . . . i ... O . 1 4 O . 2 8 O . 4 ~ O . 5 6 O . 7 0
F l m e [ x e - 0 3 ]
Trace plot for f l u i d Pressures
I . 80
I . 4 4 _ C - _
p
r
_ e
s 1 . 0 8
[
_ x
O. 72 . . . .
0
6 -_
] 0 . 3 6 _
_
_
O . O0 - i i i i i i i i i 11 i i i i i i ii
O. O0 O. 1 4 O. 2 8 O. 4 2
r l m e [ x e - 0 3 ]
P r e s B u r e
ip l /i
-p-11
/ 1 6
i
: P-2i ~P-24
~. ,/;
i i i i i i i] i i i i 1 1 1 1
O. 50 O. 70
Trace Plot for f l u i d Pressure
7 . 9 0
15.34 -
P r
a
t s 4 . 7 8
l
x • 3 . 2 2 + 0 6 ] 1 . 6 6
0 . 1 0
P r e s s u r e __L p ~ --4-:: "p-ff
-P-28
'i ... i ... J ... i . . .
O. O0 O. 14 O. £ 8 O. 4 2 O. 56 O. 70 ~ l m e l x e - 0 3 ]
Fig 6: Left : fluid pressure along the crack propagation path. Right: from the center towards the crack opening.
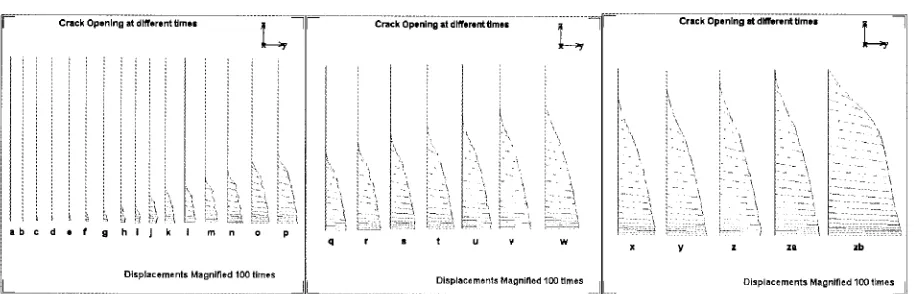
Figure 7 shows the propagation of the crack both in length and area. After the opening of the third node along the crack path at 0.32 ms, the crack propagation shows a sudden increase in velocity. Figure 8 show the crack opening areas at different times when various crack tips are formed. The deformations are magnified 100 times. The expansion of the cylinder happens till 0.37 ms and crack opening after this time. Subsequent deformations are large due to opening and release of the displacement constraint.
Fluid pressure and Von Mises stresses
Figure 9 shows the evolution of fluid pressure contour in half of the fluid mesh from 0.25 to 0.45 ms. At first, symmetric pattern of pressure is observed. A pressure build-up is observed near the crack opening. Figure 10 shows Von- Mises stresses before the first crack tip opening to 0.45 ms after. The zone of new stress concentration is clearly seen as the crack tip moves along the path.
T r a c e P l o t o f C r a c k L e n g t h v / s T i m e
O. 40 C U R V E S
. - - , ~ - OUR 1
C '
r 0 . 3 2 '
a
k k
O. £'4 --- . . . .
!".
°
!
q 0 . 1 6 t; h( o . o a . . . . . .
.
!
0.00 - ' " " " " ' ' " " ' " ' l " " ' " " l ' " ' " " ' l ' " " ' " '
0 . 0 0 0 . 0 9 0 . 1 8 0 . 2 7 0 . 3 6 0 . 4 5
I ' I 1 ~ ( m t l l s e c o n c h ¢ )
Trace plot of Crack opening area v/s Tt,,e
O. 4 8 _
_ _
0 . 4 1 A r
e
0 . 3 4 -
f _
x
e 0 . 2 7 :
- -_
0
3 _
] o . a o _
_
0 . 1 3 -
c r a c k o p e n i n g a r e a
' " ' " " ' 1 ' " " ' " ' " " ' " " I ' " ' " " ' l ' " " ' " °
0 . 2 8 0 . 4 2 0 . 5 6 0 . 70
T l m e . [ x e - 0 3 1
Fig 7: Left : propagation of crack length. Right : propagation of crack opening area
The present paper demonstrates the capability of
fluidyn-FSI
code for simulating fluid-structure interactionproblem involving crack propagation and fluid flow. Better results can be achieved by using a finer mesh for the structure along the crack path. As this is a highly transient and nonlinear phenomenon necessitating small time steps for integration, explicit time integration is justified. The study also demonstrates the novel scheme of coupling finite-
element-based stress solver and finite-volume-based fluid solver employed in
fluidyn-FSI
code. The simple andCrack Opening at dlfferent limes
L
a b c d e f g h i k m n o p
Displacements Magnified 100 times
Crack Opening at differenttime=
q r s t g ¥ w
Displacements Magnified 100 times
Crack Opening at different times m
¼
i ! ~ i',
ii. !
...
, - ; ; 2 - 2 . . . . :
! .. . . _ : - : \
x y z za zb
Displacements Magnified 100 times
Fig 8 : Crack opening from 0.2 to 0.5 ms
SUMMARY AND CONCLUSION
A new method of fluid/structure interaction, implemented into fluidyn-FSI, has been used to simulate a crack propagation along the walls of a hollow cylinder and due to a fluid pressure wave. This method consists of coupling the finite volume approach for fluids to the finite element approach for structures inside the same solver. Two independent models, one for the two-phase flow through the leak and the other for the crack propagation were used to analyze the flow and temperature effect on the crack propagation. The coupling was done using an explicit boundary condition between the two models. The structural mesh consisted of thick plate elements with a crack energy estimation at the crack tip. A failure criteria based on a limiting Von Mises stress value was used to propagate the crack. The fluid flow was modeled in finite volumes with the two-phase representation through a Clausius-Clapeyron resolution to determine the liquid and gas phases. In the absence of any microscale measured data, the results were analyzed with respect to the qualitative representation of the physical phenomena.
R E F E R E N C E S
1. Stassinopoulos, A., Suresh, K. and Ramesh, T.C., "Numerical modelling of conjugate heat transfer applications using a new 3D fluid-solid interaction approach," EUROTHERM, 1999.
2. Jameson, A., Baker, T.J. and Weatherbill, N.P., "Calculations of inviscid transonic flow over a complete aircraft", AIAA 86-0103, 1986.
3. Roe, P.L., "Approximate Tiemann solvers, parameter vectors and difference schemes," Journal of Computational Physics, Vol. 43, 1981, pp. 357-372.
4. Van Leer, B., "Flux vector splitting for Euler equations," Lecture Notes in Physics, Vol. 170, 1982, pp.507. 5. Kennedy, J.M., Belytschko, T. and Lin, J.I., "Recent developments in explicit finite element techniques and their applications to reactor structures," Journal of Nuclear Engineering and design, Vol. 97, 1986, pp. 343-354. 6. Fasoli-Stella, P. and Jones, A.V., Advanced Structural Dynamics, pp. 191-254, Applied Science Publishers, London, 1980.
FLUID PRESSURE I N HALF O F FLUID M E S H
ira.--
erel; (l'a.) AT 0.200010 n~
; . . . I 3 , 7 ~ . . . . . ~ ~
. ~,f~!. ~. : :
_ _ : ~ ' ~ ,
F L U I D PRESSURE IN HALF OF F L U I D NESH
e,e; (P,) AT 0,400015 rm~
~ .00[+00~ ~,?~[~oo 7.00[*00~
5.00[*O05
I
1 .oor.,.O07
F L U I D P R E S S U R E I N H A L F O F FLUID M E S H
. . . .
e~.~ (Pa) AT O,S6OOSS 7"~ooE~o5 s.75[~oo6
i /
! .OOE+O0?
~ l l l l l ~
FLUID PRESSURE IN HALF OF FLUID h'ESH
Pr*s (Po) AT 0.~.,5005 M
~ ,OOE+OO5 s .75E+006 ? .OOE.+O06 L .OOE'~O07
Fig 9. Pressure contour plot on half of the mesh at 0.25,0.35, 0.40 and 0.45 ms
YON HISFS STRESSES I N H A L F OF STRUCTURAL MESH
VO~ISES (Pa) AT 25 0 ,~
VON HISES STRESSES IN HALF OF STRUCrURAL HESI[
VOIItISES (P~.) RT O.410OOtl~ hi . . . .
YON H I S E S STIL]~SES I N HALF OF STBUCTUKAL HESH
vomlsEs ¢t,l ~T O.'~500~,S
~ ,oot~oo | .7,~+oce m .,,~ +ooe
VOHIII~[$ (P,*.) RT IO.qlOO531lPgE~.OOSq ! , 7 4 E + 0 0 9
~ .OOE+O06
... ~ i ... ~-~:,!: :
5.00E'*O08 _'~'___ V O H H I S E S STKESSES IN HALF O F STRUCTURAL HESH