ABSTRACT
SALLEY, CINDY T. An Improved Analytical Method for the Analysis of Reactive Dyes by High Performance Liquid Chromatography. (Under the direction of Keith R. Beck).
High Performance Liquid Chromatography or HPLC is a technique that is commonly used for the analysis of many different compounds. For the analysis of reactive dyes, ion-pair chromatography (IPC) is often implemented, but previous methods in the literature are a decade old and have not allowed for the analysis of highly complex dyes such as Reactive Blue 21, a copper pthlalocyanine reactive dye.
AN IMPROVED ANALYTICAL METHOD FOR THE ANALYSIS OF
REACTIVE DYES BY HIGH PERFORMANCE LIQUID
CHROMATOGRAPHY
by
CINDY T. SALLEY
A thesis submitted to the Graduate Faculty of North Carolina State University
in partial fulfillment of the requirements for the degree of
Master of Science
TEXTILE CHEMISTRY
Raleigh 2005
APPROVED BY:
________________________ _________________________
Dr. David Hinks Dr. Morteza Khaledi
DEDICATION
This thesis is dedicated to the memory of my grand-aunt, Ms. Christine Durham, who was a person that I always admired and was one of the most influential people in my
BIOGRAPHY
Cindy Salley was born in Portsmouth, VA on November 9, 1982 as the first and only child of Sidney and Merriel Salley. In 1999, Cindy received an Advanced Studies Diploma with Magnet Distinction from Israel Charles Norcom High School in Portsmouth, VA. She attended Spelman College in Atlanta, GA where she received a Bachelor of Science Degree in Chemistry in May of 2003. Her experiences conducting various scientific research as well as an encounter with a conservation scientist led Cindy to North Carolina State University, and more specifically, the College of Textiles. She is a candidate for the Master of Science in Textile Chemistry. On December 18, 2004, she married Elmo Sampson, III of
ACKNOWLEDGMENTS
I would like to thank Dr. Keith Beck, my committee chair, for your unwavering support and constant guidance in my research efforts. You were always willingly to clarify many key points, and I greatly appreciate your taking the time to mentor me. To my committee members, Dr. Morteza Khaledi and Dr. David Hinks, thank you for your insight and continued support. Dr. Harold Freeman, thank you for lending your expertise in dye synthesis. I am very grateful to Jeffrey Krauss for your assistance in the pilot lab with the dyeing experiments. I would also like to express great appreciation to Dr. Ahmed El-Shafei and Dr. Potjanart Suwanruji, who provided materials and encouragement to me during this project.
To Howie James, and the Waters Corporation, I thank you for your assistance, especially with the Alliance HPLC system and columns. Much gratitude also goes out to Ron Pedemonte and DyStar for providing dyes for this work.
TABLE OF CONTENTS
Page
LIST OF TABLES
viiiLIST OF FIGURES
x1. INTRODUCTION
12. LITERATURE REVIEW
22.1 High Performance Liquid Chromatography 2
2.1.1 Overview of Chromatography 2
2.1.2 HPLC System 3
2.1.2.1 Detectors 5
2.1.2.2 Columns 5
2.2 Ion Pair Chromatography 6
2.2.1 Ion-Pair Reagents 7
2.2.2 Advantages of IPC 9
2.2.3 Disadvantages of IPC 9
2.3 Reactive Dyes 10
2.4 Analysis of Reactive Dyes 14
2.4.1 UV-Visible Spectroscopy 14
2.4.2 Thin Layer Chromatography 14
2.4.3 Capillary Electrophoresis 16
2.4.4 High Performance Liquid Chromatography 16
2.4.4.1 Online HPLC 17
2.4.4.2 LC-MS 19
3. EXPERIMENTAL METHODS AND PROCEDURES
213.1.1 Mobile Phase Components 21
3.1.2 Mobile Phase Preparation 22
3.1.3 Dyes 22
3.1.4 Chromatographic Columns 26
3.1.5 Chemicals for Experiments 28
3.2 Instrumentation 28
3.2.1 UV-Visible Spectroscopy 28
3.2.2 High Performance Liquid Chromatography System 28
3.2.2.1 Breeze HPLC System 29
3.2.2.2 Alliance HPLC System 29
3.3 Experiments 30
3.3.1 Ion-Pair Reagents 30
3.3.2 Stationary Phases 31
3.3.2.1 Stationary Phase 31
3.3.2.2 Gradient Adjustments 32
3.4 C.I. Reactive Blue 21 Hydrolysis 33
3.4.1 Hydrolysis 33
3.4.2 Exhaust Dyeing 33
3.4.3 Pad Batch Dyeing 34
4. RESULTS AND DISCUSSIONS
354.1 Ion-Pair Experiments 35
4.1.1 TBAB and TBAHS on Symmetry Column 35
4.1.2 TBAB and TBAHS on Novapak Column 41
4.1.3 C. I. Reactive Blue 21 on Atlantis Column 46
4.2 Stationary Phase and Gradient Experiments 49
4.2.1 Stationary Phases 49
4.2.2 C.I. Reactive Blue 21 Gradient Adjustments 53
4.2.2.1 Gradient Elution 53
4.2.2.3 Gradient Time 62
4.2.2.4 Gradient Optimization 71
4.3 Reactive Blue 21 Experiments 74
4.3.1 Hydrolysis of Reactive Blue 21 75
4.3.2 Exhaust Dyeing with Reactive Blue 21 79
4.3.3 Pad Batch Dyeing of Reactive Blue 21 82
5. CONCLUSIONS
846. RECOMMENDATIONS FOR FUTURE WORK
86LIST OF TABLES
Page
Table 3.1 Commercial and C.I. Names of Dyes 23
Table 3.2 Columns for HPLC Analysis 27
Table 3.3 Guard Cartridges 27
Table 3.4 Gradient 1 30
Table 3.5 Columns and Dyes Examined by Ion-Pair Reagents 31
Table 3.6 Gradient 2 32
Table 3.7 Optimized Gradient for C.I. Reactive Blue 21 32
Table 4.1 Number of Resolved Peaks on Symmetry (C18) Column and Gradient 1 40
Table 4.2 k’ Values on Symmetry (C18) Column and Gradient 1 40
Table 4.3 Number of Resolved Peaks on Novapak (C18) Column and Gradient 1 46
Table 4.4 k’ Values on Novapak Column 46
Table 4.5 Resolved Peaks and k’ Values for C.I. Reactive Blue 21 on Atlantis Column 49
Table 4.6 Gradients 1 and 2 50
Table 4.7 Column Comparision for Reactive Dyes 50
Table 4.8 C. I. Reactive Blue 21 Atlantis (C18) Gradient Elution Adjustment Example 54
Table 4.10 Number of Peaks Resolved for C.I. Reactive Blue 21 Gradient
Curve 62
LIST OF FIGURES
Page
Figure 2.1 Schematic Diagram of an HPLC System 4
Figure 2.2 Possible Mechanism Sketch of IPC 7
Figure 2.3 Ion-Pair Formation 8
Figure 2.4 Triazines and Vinyl Sulfone Groups of Reactive Dyes 12
Figure 2.5 Diagram of Hydrolysis Reaction by Mock 13
Figure 3.1 Ion-Pair Reagents 22
Figure 3.2 Structure of C. I. Reactive Red 43 23
Figure 3.3 Structure of C. I. Reactive Red 180 24
Figure 3.4 Structure of C. I. Reactive Red 239 24
Figure 3.5 Structure of C. I. Reactive Yellow 3 24
Figure 3.6 Structure of C. I. Reactive Yellow 135 25
Figure 3.7 Structure of C. I. Reactive Blue 238 25
Figure 3.8 Structure of C. I. Reactive Blue 21 26
Figure 3.9 Ion-Pair Reagent Mobile Phase 30
Figure 4.1 C. I. Reactive Red 239 on Symmetry (C18) Using TBAB and Gradient 1 36
Figure 4.2 C. I. Reactive Red 239 on Symmetry (C18) Using TBAHS and Gradient 1 36
Figure 4.3 C. I. Reactive Yellow 3 on Symmetry (C18) Using TBAB and Gradient 1 37
Figure 4.5 C. I. Reactive Yellow 135 on Symmetry (C18) Using TBAB and
Gradient 1 38
Figure 4.6 C. I. Reactive Yellow 135 on Symmetry (C18) Using TBAHS and
Gradient 1 38
Figure 4.7 C. I. Reactive Yellow 168 on Symmetry (C18) Using TBAB and
Gradient 1 39
Figure 4.8 C. I. Reactive Yellow 168 on Symmetry (C18) Using TBAHS and
Gradient 1 39
Figure 4.9 C. I. Reactive Red 180 on Novapak (C18) Using TBAB and
Gradient 1 41
Figure 4.10 C. I. Reactive Red 180 on Novapak (C18) Using TBAHS and
Gradient 1 42
Figure 4.11 C. I. Reactive Red 239 on Novapak (C18) Using TBAB and
Gradient 1 42
Figure 4.12 C. I. Reactive Red 239 on Novapak (C18) Using TBAHS and
Gradient 1 43
Figure 4.13 C. I. Reactive Yellow 3 on Novapak (C18) Using TBAB and
Gradient 1 43
Figure 4.14 C. I. Reactive Yellow 3 on Novapak (C18) Using TBAHS and
Gradient 1 44
Figure 4.15 C. I. Reactive Yellow 168 on Novapak (C18) Using TBAB and
Gradient 1 44
Figure 4.16 C. I. Reactive Yellow 168 on Novapak (C18) Using TBAHS and
Gradient 1 45
Figure 4.17 C. I. Reactive Blue 21 on Novapak (C18) Using TBAB and
Gradient 1 47
Figure 4.18 C. I. Reactive Blue 21 on Symmetry (C18) Using TBAHS and
Figure 4.19 C. I. Reactive Blue 21 on Atlantis (C18) Using TBAB and
Gradient 1 48
Figure 4.20 C. I. Reactive Blue 21 on Atlantis (C18) Using TBAHS and Gradient 1 48
Figure 4.21 C. I. Reactive Blue 21 on Novapak (C18) (3-Good) and Gradient 1 51
Figure 4.22 C. I. Reactive Blue 21 on Zorbax Reliance (C18) (2-Better) and Gradient 1 51
Figure 4.23 C. I. Reactive Blue 21 on Atlantis (C18) (1-Best) and Gradient 1 52
Figure 4.24 C. I. Reactive Blue 21 Atlantis (C18) with 90_10 Gradient 54
Figure 4.25 C. I. Reactive Blue 21 Atlantis (C18) with 80_20 Gradient 55
Figure 4.26 C. I. Reactive Blue 21 Atlantis (C18) with 70_30 Gradient 55
Figure 4.27 C. I. Reactive Blue 21 Atlantis (C18) with 65_35 Gradient 56
Figure 4.28 C. I. Reactive Blue 21 Atlantis (C18) with 60_40 Gradient 56
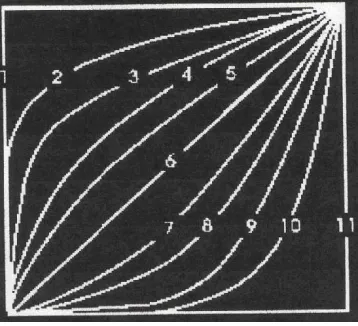
Figure 4.29 Profile of Gradient Curves 58
Figure 4.30 C. I. Reactive Blue 21 Atlantis (C18) with Curve 2 and Gradient 1 59
Figure 4.31 C. I. Reactive Blue 21 Atlantis (C18) with Curve 4 and Gradient 1 59
Figure 4.32 C. I. Reactive Blue 21 Atlantis (C18) with Curve 6 and Gradient 1 60
Figure 4.33 C. I. Reactive Blue 21 Atlantis (C18) with Curve 7 and Gradient 1 60
Figure 4.34 C. I. Reactive Blue 21 Atlantis (C18) with Curve 8 and Gradient 1 61
Figure 4.35 C. I. Reactive Blue 21 Atlantis (C18) with Curve 9 and Gradient 1 61
Figure 4.36 C. I. Reactive Blue 21 Atlantis (C18) with Curve 10 and Gradient 1 62
Figure 4.37 C. I. Reactive Blue 21 Atlantis (C18) with 1.5_3.5 Gradient Time 64
Figure 4.39 C. I. Reactive Blue 21 Atlantis (C18) with 3_5 Gradient Time 65
Figure 4.40 C. I. Reactive Blue 21 Atlantis (C18) with 4_6 Gradient Time 65
Figure 4.41 C. I. Reactive Blue 21 Atlantis (C18) with 5_7 Gradient Time 66
Figure 4.42 C. I. Reactive Blue 21 Atlantis (C18) with 6_8 Gradient Time 66
Figure 4.43 C. I. Reactive Blue 21 Atlantis (C18) with 7_9 Gradient Time 67
Figure 4.44 C. I. Reactive Blue 21 Atlantis (C18) with 8_10 Gradient Time 67
Figure 4.45 C. I. Reactive Blue 21 Atlantis (C18) with 9_11 Gradient Time 68
Figure 4.46 C. I. Reactive Blue 21 Atlantis (C18) with 10_12 Gradient Time 68
Figure 4.47 C. I. Reactive Blue 21 Atlantis (C18) with 11_13 Gradient Time 69
Figure 4.48 C. I. Reactive Blue 21 Atlantis (C18) with 12_14 Gradient Time 69
Figure 4.49 C. I. Reactive Blue 21 Atlantis (C18) with 13_15 Gradient Time 70
Figure 4.50 C. I. Reactive Blue 21 Atlantis (C18) with 14_16 Gradient Time 70
Figure 4.51 C. I. Reactive Blue 21 Atlantis (C18) with 10_12 Gradient Time, 70/30 Elution and C7 72
Figure 4.52 C. I. Reactive Blue 21 Atlantis (C18) with 10_12 Gradient Time, 60/40 Elution and C6 73
Figure 4.53 C. I. Reactive Blue 21 Atlantis (C18) with 10_12 Gradient Time, 60/40 Elution and C7 73
Figure 4.54 C. I. Reactive Blue 21 Prior to Adding Base for Hydrolysis 75
Figure 4.55 C. I. Reactive Blue 21 Hydrolysis at 65º-10 Minutes After Base was Added 76
Figure 4.56 C. I. Reactive Blue 21 Hydrolysis at 65º-25 Minutes After Base was Added 76
Figure 4.58 Hydrolysis of C. I. Reactive Blue 21 Predicted Dye Forms 79 Figure 4.59 C. I. Reactive Blue 21 Prior to Adding Base for Exhaust Dyeing 80 Figure 4.60 C. I. Reactive Blue 21 Exhaust Dyeing After Na2CO3 Addition 80
Figure 4.61 C. I. Reactive Blue 21 Exhaust Dyeing-40 Minutes After Na2CO3
Addition 81
1. INTRODUCTION
The primary focus of the present work is to develop a more efficient way of analyzing reactive dyes using High Performance Liquid Chromatography (HPLC), a widely used technique in the scientific community. The literature review that follows will cover information dealing with HPLC, ion-pair chromatography (IPC), reactive dyes, and other analytical methods for studying reactive dyes. IPC is often used for the analysis of reactive dyes to examine characteristics of the dye, such as the rate of hydrolysis. However, earlier methods are not as useful for analyzing some highly complex reactive dyes. The
development of an improved procedure for analysis is needed to reflect advances in technology and to examine more complex reactive dyes.
Two different ion-pair reagents will be examined as well as columns with varying column characteristics (length, inner diameter, and particle size). Gradient adjustments will be examined to optimize the analysis of Reactive Blue 21, and an improved method for analysis of this dye was developed. Hydrolysis, as well as exhaust and pad batch dyeing, were also conducted on Reactive Blue 21.
2. LITERATURE REVIEW
2.1 High Performance Liquid Chromatography (HPLC)
2.1.1 Overview of Chromatography
Column chromatography was first developed as a tool for separation science by
Tswett, who used fine particles of calcium carbonate to pack a glass column in order to
separate a mixture of plant pigments. This led to discoveries by scientists such as Martin and
Synge, who are credited with discovering modern liquid chromatography, from which HPLC
was born [1, 2]. The two major components that allow for separation of components in a
sample are the liquid mobile phase and a stationary phase, which can be solid or liquid
(bonded on a solid support) [1-4].
Chromatography is classified according to the mechanism used to interact with the
solute (sample), and the five major types of chromatography are adsorption, ion-exchange,
molecular exclusion, affinity, and partition. Adsorption chromatography utilizes a solid
stationary phase that adsorbs solutes being passed through a column using a liquid mobile
phase. The stronger the adsorption of the solute, the longer it takes to pass through a column
and be analyzed. This is also known as normal phase chromatography, and includes
thin-layer chromatography (TLC), though a column is not used for this method. Ion-exchange
chromatography (IEC) is often used to analyze samples that contain ionic groups, such as
amino acids. The stationary phase in IEC consist of anions (i.e. –SO3-, -COO-) or cations
are introduced through a liquid mobile phase, and sample ions of the opposite charge of the
resin are attracted to the stationary phase. A special type of IEC is ion chromatography,
which is used to separate organic acids and inorganic ions. Molecular exclusion
chromatography, also known as gel permeation chromatography, or gel filtration
chromatography, is separation based on molecular size and can analyze compounds like
polymers. The mobile phase carries the sample through the stationary phase, which is
actually a porous gel. Larger molecules elute first, since they are too big to enter the pores,
while the smaller molecules enter the gel, and take longer to move through the column.
Affinity chromatography is a very selective analytical procedure used on compounds like
proteins and lipids. Separation is achieved when the stationary phase only retains certain
groups of molecules, like a specific type of antigen. Partition chromatography involves a
liquid stationary phase, which is bonded to a solid surface like silica, and a liquid or gaseous
mobile phase. The solute partitions into the stationary phase, which allows for analyte
separation, and this is the type of chromatography from which HPLC was born [1, 4].
2.1.2 HPLC System
High performance liquid chromatography is one of the most popular techniques used
by scientists to separate mixtures into components. HPLC utilizes high pressure to force a
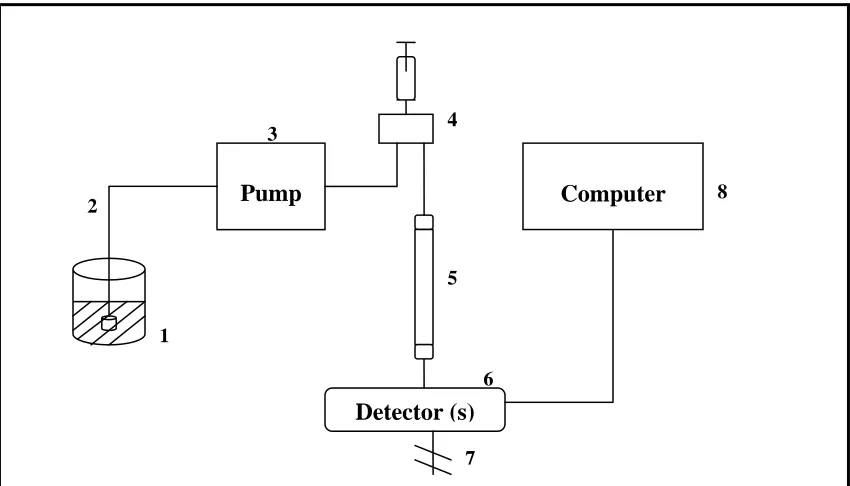
solvent (mobile phase) through a column. The basic components of an HPLC System
include: mobile phase reservoirs, pump, sample injector, column, and detector. A basic
Figure 2.1: Schematic Diagram of an HPLC System
Solvent reservoirs are utilized to store the mobile phase, which should be filtered and
degassed before it is used. The solvent is then transferred from these reservoirs into a
transfer line by a pump. Depending on the HPLC system and if utilizing a gradient method,
the solvents could be mixed through a solvent proportioning valve before going through the
pump, or could be mixed after the solvent flows through the pump. As the solvent or mobile
phase is running through the system, a sample can be introduced by an injector onto the
column. The sample migrates through the column, and is analyzed by a detector on the
other end of the column. The information collected from the detector is sent to a computer or
data readout, from which a chromatogram is obtained, while the solvent utilized for the
7
Detector (s) Pump
1 2
3 4
5
6
Computer 8
experiment and samples are sent to waste [1, 3, 4].
2.1.2.1 Detectors
An HPLC system is able to utilize different detectors, and this allows for the system
to be able to analyze a wide variety of samples. The most popular detector for HPLC is the
UV detector. Provided that a compound of interest can absorb light in the UV-Visible
region, a UV detector is ideal since it is fairly sensitive, fit for gradient elutions, and has a
wide linear range [4]. A basic UV detector allows for one or two wavelengths to be recorded
for analysis, but others have monochromators in them, which allow for the full wavelength
range of the spectra to be recorded. These types of UV-Visible detectors are called
photodiode array (PDA) detectors, and can be useful for sample components that absorb light
at different wavelengths. For more sensitive analytes, a fluorescence detector could be used,
but if a compound is not fluorescent, a fluorescent group must be tagged to the compound for
it to be recognized by the detector. A refractive index detector is very universal, because it
can respond to just about any analyte, but has a lower detection limit (1000x less than UV)
and is not good for gradient elution [1]. For more complex mixtures, other analytical
techniques can be coupled to HPLC, such as mass spectrometry [5-8] or FTIR [9].
2.1.2.2 Columns
The column is a key component in the HPLC system, since it is the basis for the
separation mechanism. Columns are made of smooth-bore stainless steel and typically have
liquid stationary phases bonded to a solid, which is often silica. The silica is modified at the
silanol group in order for functional groups, which interact with the sample to achieve
octadecyl (C18), amino (NH2), etc. Columns originally ranged from 10 to 30cm in length, 4
to 10mm in inner diameter (i.d.), and particle size packings from 5 to 10μm [3]. However,
newer technologies have allowed for columns to be packed with particles as small as 1.7μm,
to have i.d.’s as narrow as 1.0-2.1mm, and lengths shorter than 50mm. In addition,
application-specific columns that can analyze specific types of samples such as chiral
molecules, environmental samples, and peptide molecules are available [10]. This is
achieved by adjusting column factors such as chemistry of the stationary phase by adding
ligand groups, embedded polar groups, or difunctional bondings in silica [11]. With the
development of such columns, improved separation can be achieved better than before for
analytes targeted for that specific column [10].
2.2
Ion Pair Chromatography (IPC)
Ion pair chromatography is a form of reverse-phase high performance liquid
chromatography (RP-HPLC) that is utilized for the chromatographic separation and
determination of ionic species. IPC is a sister alternative to ion-exchange chromatography,
which uses columns packed with anion-exchange or cation-exchange resins for analysis of
ionic species. Ion exchange chromatography is best used for samples with small inorganic
and organic ions, such as those found in nucleotides. However, ion-exchange
chromatography is not ideal when dealing with mixtures of bases, acids, and certain neutral
products, and IPC is capable of dealing with all of these. Reversed phase chromatography,
allows for separation of charged species that would not otherwise be suitable for analysis.
solvent (preferably methanol or acetonitrile) and the ion pair reagent [3-4].
2.2.1 Ion-Pair Reagents
An ion-pair reagent contains an ion that interacts with a sample component of
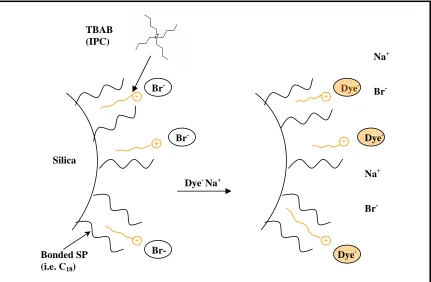
opposite charge. Figure 2.2 below is a sketch of how a sample (dye) interacts with the IPA
on a reversed phase column in HPLC. Here, the TBAB behaves like a small surfactant, where
the hydrophobic chain interacts with the dye increasing its retention. Ion-pair formation can
be achieved for a cationic sample that interacts with a negative ion, and an anionic sample
that interacts with a positive ion, which is simplified in Figure 2.3.
Figure 2.2: Possible Mechanism Sketch of IPC
Silica
Br
-Br
-Br-
Dye-Na+
Bonded SP (i.e. C18)
Dye
-Dye
-Dye
+
Na+ Br
-Na+ Br
+
+
+
+
+
Figure 2.3: Ion-Pair Formation
In IPC, it is essential to select an ion-pair reagent that is most suitable for the analytes of
interest. When choosing an ion-pair reagent (IPA), consideration should be given to pKa
values of analytes and the type of mixture being analyzed. For example, for the analysis of
sulfonated dyes, quaternary amines such as tetrabutylammonim phosphate are recommended
for IPC analysis [3-4].
To analyze structures that contain a variety of charged compounds, such as amino
acids or sugars, more than one ion pair reagent can be used for analysis. Meyer uses a
variety of ion-pair reagents to analyze three different types of natural organic compounds,
which include uronic acids, amino sugars, and carbohydrates. These compounds were being
analyzed after being derivatized by p-aminobenzoic acid for fluorescent tagging. The ion
pairing agents used in this experiment include hexadecyltrimethylammonium bromide,
tetrabutylammonium hydrogen phosphate, tetraethyl ammonium bromide,
tetramethylammonium bromide, and tetrapentylammonium iodide. Combinations of these
were examined along with columns, and though some mixtures influenced retention, a single
ion pairing agent, tetrabutylammonium hydrogen phosphate, yielded the best separation [12].
For reactive dye analysis, Zotou used 1mM cetyltrimethylammonium bromide
(CTAB) in the mobile phase for the analysis of the hydrolysis of flurotriazinic reactive dyes,
Cibracron Yellow F-4G and Cibacron Blue F-R [13]. Kanazawa also employed CTAB in the
BH+ + C8H17SO3-→ [BH+C8H17SO3-] pair
mobile phase to examine a monoazo dye [14]. However, the most common ion pairing
agent utilized for reactive dyes is tetrabutylammonium bromide (TBAB). This IPA is one of
the first used in the literature for dye analysis [15-16], and is a primary choice particularly for
the study of reactive dye hydrolysis [15-19]. TBAB has also been used not only as an IPA in
chromatography, but it is also used as a reagent for selective dye extraction [20].
2.2.2 Advantages of IPC
Ion-pair chromatography is utilized in reverse phase systems, so to employ the
ion-pair mechanism, a mobile phase change is made. Not only can different acid mixtures or
base mixtures be analyzed with this tehcnique, but also amphoteric molecules, which include
one cationic and one anionic group. This can not be accomplished through ion-exchange
chromatography or reversed phase HPLC alone [4]. IPC can be a preferred technique of
choice when the analytes have similar pKa values, since analyte selectivity can be influenced
by the ion-pair reagent. Also, there are many ion-pair reagents, such as sodium octyl sulfate,
tetrapropylammonium bromide, and perchloric acid, that are readily available for commercial
use [4, 6].
2.2.3 Disadvantages of IPC
IPC has many obvious advantages, but it has some disadvantages. Though ion-pair
reagents are readily available, depending on the technique being used, certain reagents can
not be used successfully. This is particularly an issue when dealing with HPLC-MS, where
examined this by observing the signal suppression of different IPAs in electrospray MS (for
LC-MS) when sulphonated dyes were analyzed. So reagent selectivity is especially key in
such cases [6-7]. Analysis can not be done over a wide pH range, and thus ion
chromatography would be preferred in such cases. In order to maintain the appropriate levels
of pH needed for experiments, a buffer is used in the mobile phase. This is not a huge
problem, but in general, ion pair systems take time to equilibrate, so this does cause the
preparation and closing steps for HPLC analysis to be lengthened by adding a water wash
step at the beginning and end of each day of IPC runs or if the mobile phase
composition needs to be changed [13]. In addition to this, though adjusting the mobile
phase is all that is needed for IPC, it is recommended that a column that is being used for
ion-pair chromatography should be distinguished for only IPC, since the ion-ion-pair reagents tend to
be harmful to silica [4].
2.3
REACTIVE DYES
The origin of the earliest dye is very difficult to determine, but it is speculated that the
first color applied to a textile was probably a juice or berry stained to a fabric like animal
skin. Since then, different natural dyes have been utilized by many ancient civilizations,
such as the Egyptians, Greeks, Indians, and Chinese to name a few [21]. However, the field
of synthetic dyes is fairly new. In 1855, the first synthetic dye was a black vat dye named
fuschin, which was made by Natanson, a professor at Warsaw University. A year later,
William Henry Perkin synthesized mauve or aniline purple [21-22]. Today, there are over
In 1956, ICI introduced a new class of dyes known as reactive dyes or fiber reactive
dyes. Reactive dyes are different from other dye classes in that they form covalent bonds
with fibers such as cotton, and they are currently one of the most popular types of dyes used
today, because of their excellent properties [21-23]. Fiber reactive dyes typically have
brilliant shades and the ability to be applied to a fabric using a variety of different
applications. They are more stable to light and wet treatment than direct dyes, and have a
more simplistic application than vat dyes [22]. However these dyes after covalently bonding
with the fiber usually leaves a substantial amount of dye unfixed (from 10 to 40 percent).
This unfixed dye is hydrolyzed during the dyeing process, and must be washed off, but is
essentially wasted dye [21]. The wasted dye, especially those dyes that contain metal
complexes, can pose an environmental problem since special waste treatment are required to
comply with environmental regulations [24-25].
Reactive dyes are classified by the groups that facilitate covalent bonding to the fiber.
Two of these reactive dye classifications are triazines (monocholoro and dichloro) and
vinylsulfones, which are shown below in Figure 2.4. The sulfatoethylsulfone is the reactive
Figure 2.4: Triazine and Vinyl Sulfone Groups of Reactive Dyes
N
N N
Cl
NHR
Dye N
N N
Cl
Cl Dye
Monochlorotriazine (MCT) Dichlorotriazine (MCT)
Dye-SO2-CH2-CH2-O-SO3- Na+ Dye-SO
2-CH=CH2
Sulfatoethylsulfone (SES) Vinyl Sulfone (VS)
Hydrolysis of a reactive dye occurs when alkali is introduced to an aqueous dye
mixture. This mixture is typically heated to a certain temperature, and can be conducted with
or without fabric. The general reaction for what occurs for a vinyl sulfone dye can be seen
below in Figure 2.6 from Mock [21]. In the absence of a fabric, the dye is able to undergo
hydrolysis only. In the presence of a fabric, hydrolysis takes place along with the dyeing
Figure 2.5: Diagram of Hydrolysis Reaction by Mock [21]
Fiber reactive dyes are usually applied by either pad-batch or exhaust dyeing.
Exhaust dyeing occurs by step-by-step addition of dye and chemicals or they can all be added
at the same time. When added at the same time, the dyebath starts at a low temperature and
is gradually raised to a higher temperature. When added step-by-step, the dye is exhausted
using salt, and the pH is allowed to change gradually so the dye can react with the fabric. In
pad-batch dyeing, the mixture of dye and dyeing auxiliaries are padded on a flat woven fabric
and allowed to stand while fixation takes place. After the reaction has occurred, the fabric is
rinsed in cold water to remove the hydrolyzed dye. Hydrolysis is not desirable, because this
decreases the amount of dye that will covalently bond to the fabric. [21, 26].
2.4 ANALYSIS OF DYES
There are a variety of different methods that can be used to analyze a dye including
UV-Visible Spectroscopy (2.4.1), Thin Layer Chromatography (2.4.2), Capillary
Electrophoresis (CE) (2.4.3), and the main focus of this study, HPLC (2.4.4).
2.4.1 UV-Visible Spectroscopy
An UV-Visible spectrophotometer is often used before HPLC work in order to
determine λmax of organic compounds like dyes, but it can also be helpful for other analytical
techniques [14]. Comparison of the UV-Visible spectra of natural dyes and dye extracts is a
good way of determining how close the chemical identity of the dyed fabric extract is to the
natural dye. For example, marigold had the same λmax for the dyed fabric extract and the
natural dye as well as similar UV-Visible spectra, however the jackwood dye and dyed fabric
extract had different UV-Visible spectra. This is important since the dye is not overly
affected by the extraction method used for the dyed fabric in certain cases, but in others, a
different method of dye extraction would be needed [27]. Bhattacharyya also used
UV-Visible Spectrophotometry to determine if any interactions had taken place in mixtures of
certain reactive dyes [28].
2.4.2 Thin Layer Chromatography
In thin layer chromatography (TLC), separation occurs on a flat, solid plate that is
coated with a thin layer of silica or alumina. The plate is spotted with a sample, the position
solvent is touching the bottom of the plate. Similar to elution in liquid chromatography, the
sample is then carried through the stationary phase (plate coating) by the eluent (solvent)
which travels up the plate, and allows for components in the sample to separate [2-3]. For
each component separated, the retention factor (RF) is calculated according to Equation A
where dR is the distance from the sample origin to the center of the spot or where maximum
intensity occurs on the sample spot, and dM is the distance from the sample origin to the
solvent front [3].
(A) RF = dR / dM
Benefits of TLC include speed and low cost of equipment and supplies. These factors
may explain why this technique is still popular, despite the technological advances of other
techniques like HPLC and CE [2-3]. The two main types of plates in TLC are conventional
and high performance plates. High performance plates are typically thinner with smaller
particle sizes, and can theoretically give smaller RF than that of conventional plates, but are
limited in sample capacity [3]. Both types of plates have been utilized for analysis of dyes.
Natural dyes such as turmeric and indigo blue along with their fabric extracts were
analyzed by Bhattacharyya using TLC. Their RF values were compared and it was shown that
the natural dye samples and those extracted from fabrics have very similar if not identical
values [27]. Sokolowska-Gadja utilized TLC to monitor the progress of reactions utilized to
synthesize disperse dyes and cationic dyes from acid dyes [29]. Konstantinova [19] used
while Koprivanac [30] monitored reactive dyes during the dyeing process in order to produce
a method that is more environmentally friendly. Bhattacharyya developed a high
performance thin layer chromatographic technique to monitor the alkaline hydrolysis of
reactive dyes [27].
2.4.3 Capillary Electrophoresis
Capillary electrophoresis is a technique that allows ions to be separated based on their
migration under an electric field. One of the major benefits of CE is the superior resolution
obtained over the packed columns of HPLC. Another benefit is the low sample volume
needed in CE. This is helpful, especially when dealing with samples with low analyte
concentration [1, 31-32]. Croft and Hinks examined different types of dyes such as acid,
basic, and reactive dyes by CE. It was found that CE gave superior resolution for the
analysis of these dyes, when compared with HPLC [32]. Hansa analyzed a group of five
reactive dyes using HPLC and HPCE via UV detection. Results showed superior resolution
by HPCE of the reactive dyes, while HPLC exhibited co-elution of a blue and green dye.
However, further studies would be needed to improve reproducibility of HPCE runs and for
hydrolysis to be successfully conducted under HPCE [31].
2.4.4 High Performance Liquid Chromatography
High pressure or high performance liquid chromatography is helpful for analyzing
samples that are thermally unstable or not volatile. For natural dyes, according to
analyzed on an octadecylsilica (C-18) column using a photodiode array detector (PDA).
Results showed the analysis of several dyes including identification of a mixture of
manjishtha with alizarin. This natural mixture was very similar to a mixture of dyes analyzed
by extraction [27]. Kanazawa measured the water soluble products and precipitates of the
degradation of Acid Orange 10 via HPLC [14].
For reactive dye hydrolysis, HPLC is often the technique of choice and ion-pair
chromatography is often utilized to improve the analysis. Smith measured the hydrolysis of a
commercial sample of Reactive Violet 5 with and without the use of ultrasound energy using
HPLC. The use of ultrasound energy was found to increase the rate of dye hydrolysis, which
is shown in the chromatograms by the dramatic rise of the hydrolyzed dye peak [16].
Hydrolysis of several reactive fluorotriazine dye mixtures was also measured using HPLC
with and without fabric samples. Zotou found that the absence of the fabric produced
different hydrolysis behavior in all of the different mixtures between the 60 to 90 minutes
time frame, while the presence of the fabric gave the same hydrolysis behavior throughout
the dyeing process [13]. Klančnik utilized HPLC to measure the hydrolysis kinetics of
several fiber reactive dyes in HPLC [17]. The kinetics of hydrolysis and methanolysis of a
reactive dye [9], as well as the influence of pH on these processes were also examined [19].
HPLC can also be utilized with on-line methods (2.4.4.1) and HPLC-MS (2.4.4.2) for
analysis of different dyes.
2.4.4.1 On-line HPLC
On-line HPLC methods, particularly for reactive dyes, are of interest, because of the
with other techniques, such as flow injection analysis, sequential injection analysis,
immunoextraction, and infrared spectroscopy.
Flow injection analysis (FIA) allows for a sample to be injected into a constantly
moving non-segmented carrier stream and transported to a detector, such as a
spectrophotometer [33]. Wallace coupled FIA with HPLC in order to monitor dye
exhaustion and hydrolysis on-line. This system can be utilized to help determine the most
efficient method of dyeing with a reactive dye [1,33]. Sequential injection analysis (SIA) is
similar to FIA, but SIA utilizes a selection valve to measure the volumes of carrier stream
and sample in the system. Draper conducted a comparison study with SIA and FIA to
monitor batch dyeing processes. It was found that both systems are comparable based on
precision, accuracy, and monitoring capabilities with SIA having a slight advantage of the
ability to adjusting sample size easily, though more sample is required for each measurement
[33]. Further studies in this area could lead to a SIA-HPLC method similar to that of the
FIA-HPLC.
Another aspect of textile wet processing is waste management. Bouzige utilized
on-line immunoextraction with HPLC to measure the trace amounts of dyes and their
intermediates in surface water and other industrial waste. The on-line immunoextraction
involved utilizing a pre-column that was packed with an immunosorbent, which was
specifically designed to target certain types of compounds, such as those which would be
found in certain dyes and their intermediates. The major benefit of this technique is the
ability to directly link it to HPLC on-line without utilizing exhaustive solid phase extraction
textile wastes and used a bioreactor coupled with a dual HPLC system to monitor the
degradation of an azo dye [35]. Jones examined the degradation of dyes such as Reactive
Blue 74 and Acid Blue 25, as well as pesticides with the assistance of HPLC-FTIR [9].
2.4.4.2 LC-MS
HPLC coupled with mass spectrometry is one of the most popular analytical
techniques used today, due to its capability of analyzing a wide variety of samples very
efficiently. Particularly in the area of biochemistry, where samples often include analytes
with highly complex structures, chromatographic separation alone is not completely
sufficient, since peak determination is very difficult for such samples. Therefore, the
addition of a mass spectrometer as a detector allows for fairly quick determination of
structure. LC-MS is heavily used in pharmokinetics to analyze compounds like nucleic acids
and proteins [5], but is also a proven technique for the analysis of dye structures. However,
just as HPLC methods can vary for different types of dyes, the method of mass spectrometry
used can vary and as such, the HPLC coupled with it would utilize different methods that
would reflect the ionization technique.
For natural dyes that are found in historical textiles, analysis of these dyes by LC-MS
can be somewhat difficult due to the harsh extraction methods. Zhang developed a method
using ethylenediaminetetracetic acid (EDTA) and formic acid, which is a milder extraction
technique than using HCl. This allowed for the extracted dyes to be analyzed by LC-MS,
without destroying glycosidic linkages in the cellulose [8]. For sulfonated dyes, Holčapek
[7]. However, this method poses a problem when dealing with ion pairing agents, because
they can suppress the signal of the mass spectrometer, and can be the source of
contamination. A variety of different ion-pairing agents were examined for this effect, and it
was found that dialklyammonium acetates and trialkylammonium acetates are the best
ion-pairing agents to use to minimize signal suppression [6]. This is particularly important, since
dyes analyzed by ion-pair chromatography often used tetraalkylammonium agents, so
adjustments would need to be made for such dyes to be examined using the coupled
electrospray mass spectrometry technique. For reactive dye analysis, Van Cott was able to
utilize HPLC coupled with matrix assisted laser desorption/ionization mass spectrometry
(MALDI-TOF MS) for analysis of dichlorotriazine dyes in optical films [36].
3. EXPERIMENTAL METHODS AND PROCEDURES
3.1 Materials
Materials used in this study included mobile phase components, dyes, a variety of
HPLC columns, and chemicals for experiments.
3.1.1 Mobile Phase Components
The mobile phase for these experiments consisted of an organic phase containing an
ion pairing agent (IPA) and a mixed phase that included some of the first organic phase
combined with an aqueous phase that contains a buffer. HPLC grade acetonitrile (AN) was
obtained from Acros Organics and the 18M ohm water used was obtained from a US Filter
Purelab Plus system. Ion pairing agents were tetrabutylammonium bromide (TBAB) from
Acros Organics, and tetrabutylammonium hydrogen sulfate (TBAHS) from Fluka Chemika.
ACS grade monobasic ammonium phosphate (NH4H2PO4) was obtained from Fisher
Figure 3.1: Ion-Pair Reagents
N+ N+
Br HSO4
-TBAB TBAHS
3.1.2 Mobile Phase Preparation
The mobile phases were prepared in 1-L increments for both phase A (mixed phase)
and phase B (organic phase). TBAB (10.477g, 0.025 mol) or TBAHS (11.035g, 0.025 mol)
was added to 1.30L of AN and stirred to make mobile phase B. NH4H2PO4 (4.026g, 0.050
mol) was added to 0.70L of H2O and stirred. A 0.30-L portion of phase B was added to the
NH4H2PO4 buffer and further stirred to generate mixed phase A. These two solutions were
filtered using 0.22μm, 47mm MAGNA Nylon filters (Fisher Chemical) and placed in the
solvent reservoirs of the HPLC system. The organic phase was placed in reservoir B, and the
mixed phase was placed in reservoir A.
3.1.3 Dyes
All of the dyes used in this study were commercial. Table 3.1 shows the dyes’
prepared by placing 30 mg of dye in a volumetric flask and diluting to 100.00mL with HPLC
grade water. To prepare for HPLC analysis, each dye solution was filtered using 0.2μm,
17mm PVDF syringe filters obtained from Alltech Associates Inc.
Table 3.1: Commercial and C.I. Names of Dyes
Colour Index Name (C.I.) Commercial Name
Reactive Red 43 Cibacron Scarlet 2G-E
Reactive Red 180 Evermax Red SF-3B
Reactive Red 239 Remazol Brilliant Red 3BS-A
Reactive Yellow 3 Cibacron Yellow R
Reactive Yellow 135 Procion Yellow H-E6G
Reactive Yellow 168 Cibacron Yellow C-R-01
Reactive Blue 21 Remazol Turquoise G-A
Reactive Blue 52 Cibacron Blue TR-E
Reactive Blue 238 Cibacron Navy C-B
Figures 3.2, 3.3, 3.4, 3.5, 3.6, and 3.7 are the structures of Reactive Red 43, Reactive
Red 180, Reactive Red 239, Reactive Yellow 3, Reactive Yellow 135, and Reactive Blue 238
respectively. Reactive Blue 21 is shown in Figure 3.8.
Figure 3.2: Structure of Reactive Red 43
N N N MeO
SO3H N N
OH
N H
Cl
N
H SO3H
Figure 3.3: Structure of Reactive Red 180
SO3Na
NaO3S
N H O
N
O NH
SO3Na
NaO3SOCH2CH2O2S
Figure 3.4: Structure of Reactive Red 239
N SO3Na
SO3Na
N N
NaO3S
OH HN
SO3Na N N
Cl N
H SO2CH2CH2SO3Na
Figure 3.5: Structure of Reactive Yellow 3
N N
Cl N
SO3H
SO3H
N N
NH
H3COC
N H
Figure 3.6: Structure of Reactive Yellow 135
N
SO3H HO3S
N N
N N
Cl
CH
SO3H
NH N
N N
CH3
O N OH
N N
SO3H HO3S
N H
Cl N H
SO3H C H O
N H2
N H N
CH2CH3 CH3 O
N H2
OH O
Figure 3.7: Structure of Reactive Blue 238
O
N N
OH
HO3S
NH2
SO3H N N
SO2CH2CH2OSO3H N
H
HO3SOCH2CH2SO2CH2H2C
Reactive Yellow 3, Reactive Yellow 135, and Reactive Red 43 are
monochlorotriazine dyes, while Reactive Red 180 is a vinylsulfone dye. Reactive Blue 238
has two sulfatoethylsulfone groups, so they are bireactive dyes, since they contain two
sulfatoethylsulfone group, so it is a heterobireactive dye, or a dye that contains two different
reactive groups. Bireactive dyes are important, because they can increase the amount of dye
fixed to the fabric, and thus decreasing the amount of dye wasted [21]. Reactive Blue 21 is a
copper-complex reactive dye with sulfatoethylsulfone groups. A general structure of
Reactive Blue 21 can be seen in Figure 3.8 below.
Figure 3.8: Structure of Reactive Blue 21
N N
N
N
N
N N
N Cu
(SO3H)
SO2CH2CH2OSO3H NH
SO2 3-1
1-3
3.1.4 Chromatographic Columns
The columns utilized in this study are listed in Table 3.2, which includes the name of
the column, type of stationary phase, its dimensions (length and inner diameter), particle size,
manufacturer, and designation for cartridge columns. Those columns denoted as cartridge
columns also contained guard cartridges within the cartridge. These guard cartridges are
shown in Table 3.3 below along with their name, dimensions, particle size and manufacturer.
introduced to the stationary phase. When all analytical runs were completed on a given
column or at the end of the day, the column was subjected to another 30-minute water wash
at the same flow rate to ensure that the buffer salts were completely removed from the
column. That wash was followed by a 15-minute rinse at 1mL/min with either 100%
acetonitrile or the storage solvent. Prior to the washing, these solvents were vacuum filtered.
Table 3.2: Columns for HPLC Analysis
Column SP L (mm)
I.D. (mm)
Particle Size
(um) Manufacturer Cartridge
(Y or N)
Adsorbosphere C18 250 4.6 5 Alltech N
Alltima C6H5 250 4.6 5 Alltech N
Atlantis dC18 C18 150 3.9 3 Waters N
Exsil Butyl 300A C4 250 4.6 5 Alltech Y
Exsil ODS C18 250 4.6 5 Alltech Y
Exsil TMS 100A C1 250 4.6 5 Alltech Y
Nova-Pak C18 60A C18 150 3.9 4 Waters N
Symmetry C18 150 4.6 5 Waters N
Zorbax Reliance C6H5 40 4.6 3 MAC-MOD Y
Table 3.3: Guard Cartridges
Guard
Cartridge L (mm) I.D.(mm)
Particle Size
(um) Manufacturer
Exsil Butyl 300A 10 4.6 5 Alltech
Exsil ODS 10 4.6 5 Alltech
Exsil TMS 100A 10 4.6 5 Alltech
3.1.5 Chemicals for Experiments
Reactive Blue 21 was examined following its hydrolysis, as well as by exhaust dyeing
and pad batch dyeing. The pH paper used in these experiments was obtained from Fisher
Scientific, and the fabric used in the dyeing experiments was a white woven cotton fabric,
that was desized, scoured, and bleached. For hydrolysis experiments, HCl and NaOH were
obtained from Aldrich Chemical. Na2CO3 and Na2SO4·10 H2O for the exhaust dyeing were
both certified ACS grade and were obtained from Fisher Scientific. Penentrant EH, a
wetting agent, was obtained from Clariant, while the 42ºBe Na2SiO3 and 50% NaOH were
obtained from Fisher Scientific for the pad batch dyeing.
3.2 Instrumentation
3.2.1 UV-Visible Spectroscopy
For UV-Visible analysis, all dyes were diluted at least 1 to 10 from the standard stock
solution of 30mg of commercial dye diluted to 100.00mL in water. A Cary 3E UV-Visible
(Varian, Inc.) spectrophotometer was used with Cary WinUV software operated in Scan
mode. The lambda max (λmax) of the dyes was obtained and used to select wavelength of
analysis in HPLC.
3.2.2 High Performance Liquid Chromatography System (HPLC)
Two HPLC systems were utilized in this study. The first system used was a Breeze
3.2.2.1 Breeze HPLC System
The Breeze chromatographic system consisted of a Waters 1525 Series binary HPLC
pump system with the Waters 2487 Dual Absorbance Detector and Waters 2414 Refractive
Index Detector. Samples were introduced into the system via a Rheodyne 7725i injector with
a 20-μl sample loop. The loop was loaded by manual injection using a Hamilton 100-μl
syringe. Data collection, storage, and peak analysis were performed by the Breeze Version
3.2 on a Dell Dimension 4100 computer workstation.
3.2.2.2 Alliance HPLC System
The Alliance chromatographic system was operated through a Dell Optiplex GX270
workstation. The Waters Alliance 2695 Separations Module system consisted of a
four-bottle solvent reservoir, solvent management system, Performance Plus inline degasser, and
an autosampler. Analyte detection was performed using two systems which consisted of a
setup of two of the following detectors: Waters 2487 Dual Absorbance Detector, Waters
2414 Refractive Index Detector, and an updated 2996 Waters Photodiode Array detector.
System 1 used the 2487 detector and the 2414 refractive index detector, while System 2
consisted of the 2996 PDA and the 2414 refractive index detector. Samples were introduced
to the column via automatic injection through a 250-μl syringe into a 100-μl sample loop,
where 10 μl of sample was injected onto the column. Data collection, storage, and peak
3.3 Experiments
3.3.1 Ion-Pair Reagents (IPA)
Two ion-pair reagents (IPA), tetrabutylammonium bromide (TBAB) and
tetrabutylammonium hydrogen sulfate (TBAHS), were examined to determine which is more
suitable for the analysis of reactive dyes by HPLC. The experiment was conducted on the
Alliance System 1. The basic mobile phase used for the runs consisted of the two mobile
phases listed in Figure 3.9, where IPA represents the ion-pairing agent used.
Figure 3.9: Ion-Pair Reagent Mobile Phase
The gradient used to compare the ion pair reagents is denoted as Gradient 1 and this method
is shown below in Table 3.4.
Table 3.4: Gradient 1
Flow (mL/min) Time A B
1 Initial 70 30
1 1.5 50 50
1 3.5 70 30
Mobile Phase A: 30% of MP B/70% H2O + 0.05M NH4H2PO4
This mobile phase gradient is based on the method of Smith and Thakore with some
adjustments [23]. The order of the mobile phases was switched in order to reflect the
standard in high performance liquid chromatography, where mobile phase A is the most
aqueous mobile phase. The flow rate was reduced, and the gradient was shortened.
Three different columns (Symmetry, Novapak, and Atlantis) were used to compare
the ion-pair reagents. All of the columns were packed with a C18 stationary phase and were
the same length, but varied in inner diameter and particle size. Table 3.5 shows the dyes
analyzed by the two IPA mobile phases and the columns used for analysis.
Table 3.5: Columns and Dyes Examined by Ion-Pair Reagents
Dyes Symmetry Novapak Atlantis
Reactive Red 180 X
Reactive Red 231 X X
Reactive Yellow 3 X X
Reactive Yellow 135 X
Reactive Yellow 168 X X
Reactive Blue 21 X X X
3.3.2 Stationary Phases
3.3.2.1 Stationary Phases
Stationary phases were examined to determine which phase provided optimal analysis
of reactive dyes. The stationary phases of interest included C1, C4, C18, and phenyl. Several
previously listed in Table 3.2.
3.3.2.2 Gradient Adjustments
Gradient 1 was previously shown in Table 3.4. The gradient used in the Breeze
system is shown in Table 3.6, and is referred to as Gradient 2.
Table 3.2: Gradient 2
Flow (mL/min) Time A B
1 Initial 70 30
1 5.0 50 50
1 13.0 70 30
Gradient 2 was also utilized for the C18 and C4 cartridge runs on the Alliance HPLC System
1. Since Reactive Blue 21 has a more complex structure than the other dyes, further
adjustments were made to the gradient to optimize analysis of this particular dye. In Table
3.7, a preferred method for the analysis of Reactive Blue 21 is shown.
Table 3.7: Optimized Gradient for Reactive Blue 21
Flow (mL/min) Time A B
1 Initial 70 30
1 10 50 50
3.4 Reactive Blue 21 Hydrolysis
Hydrolysis of Reactive Blue 21 and two different types of dyeings, exhaust dyeing
and pad batch dyeing, were carried out to determine if any of the peaks in the dye could be
assigned as sulfatoethylsulfone (SES), vinyl sulfone (VS), or hydroxyethylsulfone (HES).
3.4.1 Hydrolysis
Reactive Blue 21 was prepared by placing dye (100 mg) in a volumetric flask and
diluting with HPLC water to 100.00mL. A 5g/L NaOH solution was made by adding HPLC
water (0.10L) to NaOH (0.5g, 20-40 mesh beads), while an HCl solution was prepared by
adding 37% HCl (0.25mL) to 100mL of HPLC water. The dye solution (50mL) was added
to the NaOH solution (50mL) in a beaker and placed in a heating bath. Once the temperature
of the dye mixture reached 65ºC, a 1-mL aliquot was taken, followed by aliquots every five
minutes for an hour. Each aliquot was neutralized by the HCl solution to pH 7 (pHydrion
papers (1 to 12)) and placed on ice. These samples were diluted to 5.00mL with HPLC
water, filtered with PVDF syringes, and analyzed by HPLC.
3.4.2 Exhaust Dyeing
The exhaust dyeing was conducted on an Ahiba 1000 Texomat machine. Na2CO3
(20g) was added to 100mL of hot H2O in a 250-mL beaker. Water (100mL) was heated to
30ºC and Na2SO4·10 H2O (28g) was added to it. Reactive Blue 21 (0.4g) was added to the
salt solution and diluted with water to 389mL. Cotton fabric (20g) was placed in the dye
solution (2.75mL) was added. A second sample was taken, and the dye solution was heated
to 60ºC at a rate of 1.5ºC/min. After the temperature in the dyebath reached 60ºC, the
Na2CO3 solution (8.75mL) was added, and a third sample was taken. The dyebath
temperature was held at 60ºC, and 30 minutes later, a fourth aliquot was removed.
Subsequently two more samples were taken at ten minute intervals. All extracted samples
were immediately neutralized with HCl to pH 7, placed in an ice bath, and later diluted to
5.00mL with water, filtered with PVDF syringes, and analyzed by HPLC.
3.4.3 Pad Batch Dyeing
The dye was applied to 100% cotton fabric on a Werner Mathis AG HVF padder. A
bath of Reactive Blue 21 was prepared by adding deionized water (150mL) to dye (20g), and
Penentrant EH (0.8g). The first sample (0.5mL) was pipetted from this solution and diluted
to 50.0mL in water. An alkali solution was then made by first adding 50% NaOH (5mL) to
42ºBe Na2SiO3 (10mL) in 20mL of water, and this was diluted with deionized water to
50.00mL. The alkali solution was then added to the remaining dye solution, and this
mixture was used to pad a 12” x 12” swatch of cotton at 100% wet pick up. The
fabric was placed in a plastic bag to dwell overnight, and the next day, the fabric was washed
with water, and the water left was then neutralized with HCl to pH 7 and diluted with water
to 1.00L. This sample, along with the first sample, was filtered with PVDF syringes, and
4. RESULTS AND DISCUSSION
4.1 Ion-Pair Experiments
Ion-pair chromatography has been used successfully for the analysis of reactive dyes
[13-18, 37]. In order to develop an improved method, two particular ion-pair reagents
(TBAB and TBAHS) were examined. The purpose of this experiment was to deduce which
of the ion pair reagents would work best for the analysis of these particular reactive dyes.
The two ion-pair reagents were compared using Gradient 1 (see Table 3.4) on two different
columns (Symmetry, Novapak) for the dyes, while Reactive Blue 21 was examined on an
additional column (Atlantis). The dyes analyzed with the ion-pair reagents on a particular
column were listed in Table 3.5. Factors used to compare the results obtained using the
ion-pair reagents include the number of separated peaks and k’.
4.1.1 TBAB and TBAHS on Symmetry Column
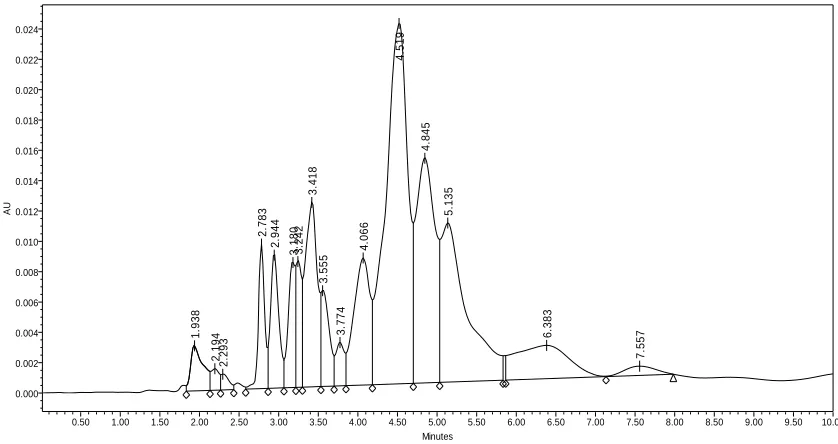
Figures 4.1, 4.3, 4.5, and 4.7 are the chromatograms of the C. I. Reactive Red 239, C.
I. Reactive Yellow 3, C. I. Reactive Yellow 135, and C. I. Reactive Yellow 168 on the
Symmetry column using TBAB as the ion-pair reagent, while Figures 4.2, 4.4, 4.6, and 4.8
are the same dyes analyzed using TBAHS. All HPLC chromatograms are shown as
Figure 4.1: C. I. Reactive Red 239 on Symmetry (C18) Using TBAB and Gradient 1
AU
0.00 0.02 0.04 0.06 0.08 0.10 0.12 0.14 0.16 0.18 0.20 0.22
Minutes
0.50 1.00 1.50 2.00 2.50 3.00 3.50 4.00 4.50 5.00 5.50 6.00 6.50 7.00 7.50 8.00 8.50 9.00 9.50 10.00
3.878
4.123
4
.375
5
.266
Figure 4.2: C. I. Reactive Red 239 on Symmetry (C18) Using TBAHS and Gradient 1
AU
0.000 0.005 0.010 0.015 0.020 0.025 0.030 0.035 0.040 0.045 0.050 0.055
Minutes
0.50 1.00 1.50 2.00 2.50 3.00 3.50 4.00 4.50 5.00 5.50 6.00 6.50 7.00 7.50 8.00 8.50 9.00 9.50 10.00
3.
400 3.555
4
.241
4.
505
5.
41
2
6.
717
8.
57
Figure 4.3: C. I. Reactive Yellow 3 on Symmetry (C18) Using TBAB and Gradient 1
AU
0.00 0.05 0.10 0.15 0.20 0.25 0.30 0.35 0.40 0.45 0.50 0.55
Minutes
0.50 1.00 1.50 2.00 2.50 3.00 3.50 4.00 4.50 5.00 5.50 6.00 6.50 7.00 7.50 8.00 8.50 9.00 9.50 10.00
1.
945
2.0
7
4
2.
27
0
2.
69
4
2.
91
9
3
.536
3
.667
3.
866
4
.140
Figure 4.4: C. I. Reactive Yellow 3 on Symmetry (C18) Using TBAHS and Gradient 1
AU
0.00 0.05 0.10 0.15 0.20 0.25 0.30 0.35 0.40 0.45 0.50
0.50 1.00 1.50 2.00 2.50 3.00 3.50 4.00 4.50 5.00 5.50 6.00 6.50 7.00 7.50 8.00 8.50 9.00 9.50 10.00
1
.680
2.0
4
4
2
.415
2.897
Figure 4.5: C. I. Reactive Yellow 135 on Symmetry (C18) Using TBAB and Gradient 1 AU 0.000 0.002 0.004 0.006 0.008 0.010 0.012 0.014 0.016 0.018 0.020 0.022 0.024 0.026 Minutes
0.50 1.00 1.50 2.00 2.50 3.00 3.50 4.00 4.50 5.00 5.50 6.00 6.50 7.00 7.50 8.00 8.50 9.00 9.50 10.00
1.
24
3
1
.392 1.67
2 1. 979 2. 177 2 .541 2.6 9 0 2. 85 3 3 .136 3. 279 3. 57 8 3. 74 3 3. 969 4. 089 4. 333 5.6 3 6 9 .700
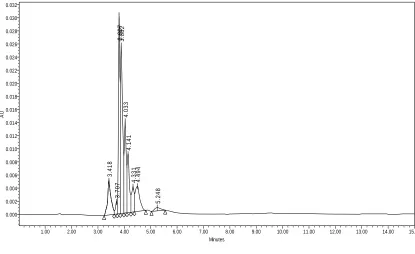
Figure 4.6: C. I. Reactive Yellow 135 on Symmetry (C18) Using TBAHS and Gradient 1
AU 0.000 0.001 0.002 0.003 0.004 0.005 0.006 0.007 0.008 0.009 0.010 0.011
0.50 1.00 1.50 2.00 2.50 3.00 3.50 4.00 4.50 5.00 5.50 6.00 6.50 7.00 7.50 8.00 8.50 9.00 9.50 10.00
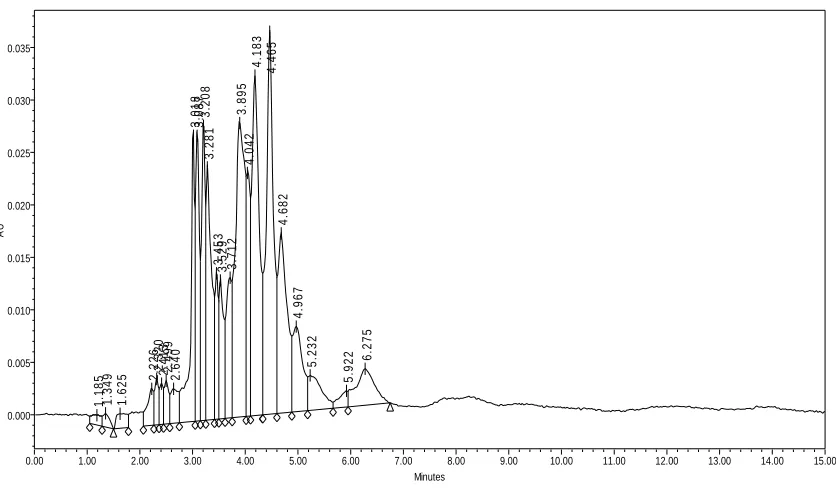
Figure 4.7: C. I. Reactive Yellow 168 on Symmetry (C18) Using TBAB and Gradient 1
AU
0.00 0.05 0.10 0.15 0.20 0.25 0.30 0.35 0.40 0.45
Minutes
0.50 1.00 1.50 2.00 2.50 3.00 3.50 4.00 4.50 5.00 5.50 6.00 6.50 7.00 7.50 8.00 8.50 9.00 9.50 10.00
2.
110
2.434 2.542 2.6172.702 2.956
3.
181
3.
38
1 3.59
8
3.
803
3.9
3
8
4
.163
4
.814
Figure 4.8: C. I. Reactive Yellow 168 on Symmetry (C18) Using TBAHS and Gradient 1
AU
0.00 0.02 0.04 0.06 0.08 0.10 0.12 0.14 0.16 0.18 0.20 0.22 0.24 0.26 0.28 0.30 0.32 0.34 0.36
0.50 1.00 1.50 2.00 2.50 3.00 3.50 4.00 4.50 5.00 5.50 6.00 6.50 7.00 7.50 8.00 8.50 9.00 9.50 10.00
1
.527 1.782 2.043
2.523
2.
67
8
2.8
8
4
2
.997
3.
17
9
3.393
3.909 4.1
7
0
4
.429
The retention factor is calculated using Equation 4.1, where t is the retention time of
the analyte, and tm is the dead volume, or time needed for a molecule of mobile phase to pass
through the column:
(4.1)
m m
t
t
t
k
'
=
−
Table 4.1 shows a comparison of number of resolved peaks in the chromatograms, while
Table 4.2 shows the retention factor (k’) of the main (highest percent area) analyte peak for
each chromatogram.
Table 4.1 Number of Resolved Peaks on Symmetry (C18) Column and Gradient 1
Dyes TBAB TBAHS Diff
Reactive Red 239 4 7 -3
Reactive Yellow 3 9 7 2
Reactive Yellow 135 17 14 3
Reactive Yellow 168 13 13 0
Table 4.2 k’ Values on Symmetry (C18)Column and Gradient 1
Dyes TBAB TBAHS
Reactive Red 239 3.38 5.72
Reactive Yellow 3 1.92 1.90
Reactive Yellow 135 4.64 3.45
Reactive Yellow 168 2.18 2.18
For these four dyes, separation is slightly better using the TBAB as the ion-pair reagent.
With the TBAB, slightly more peaks are resolved when compared with the TBAHS. Both
resolved using the TBAHS and their retention factor is higher. This shows that Reactive Red
239 spends more time migrating through the column with TBAHS, but this effect is not
necessarily better for separation since peak broadening occurs with this IPA, but not with the
TBAB. This same effect is also seen with the Reactive Yellow 135 with TBAB, but not with
TBAHS.
4.1.2 TBAB and TBAHS on Novapak Column
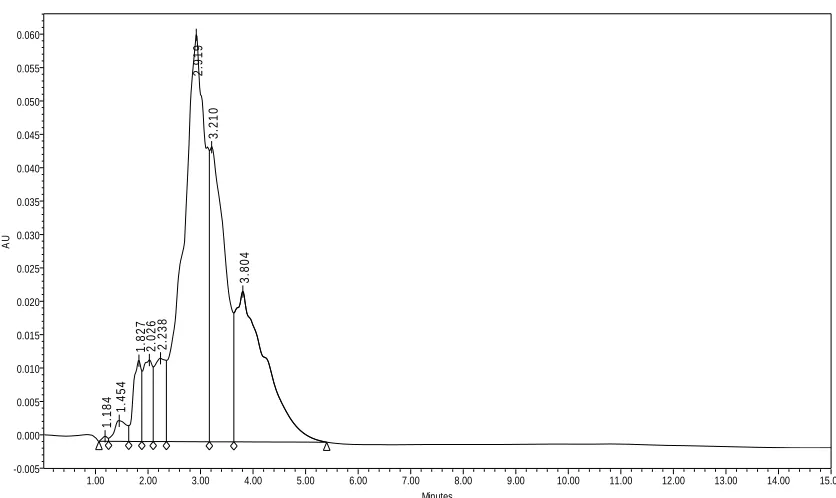
Figures 4.9, 4.11, 4.13, and 4.15 are the chromatograms of the Reactive Red 180,
Reactive Red 239, Reactive Yellow 3, and Reactive Yellow 168 on the Novapak column
using TBAB as the ion-pair reagent, while Figures 4.10, 4.12, 4.14, and 4.16 are the
chromatograms for the same dyes using TBAHS.
Figure 4.9: C. I. Reactive Red 180 on Novapak(C18) Using TBAB and Gradient 1
AU
0.00 0.02 0.04 0.06 0.08 0.10 0.12 0.14 0.16 0.18 0.20 0.22 0.24 0.26 0.28 0.30 0.32 0.34 0.36 0.38
0.00 0.20 0.40 0.60 0.80 1.00 1.20 1.40 1.60 1.80 2.00 2.20 2.40 2.60 2.80 3.00 3.20 3.40 3.60 3.80 4.00 4.20 4.40 4.60 4.80 5.00
2.
15
3
2.43
4
2.59
5
3.48
Figure 4.10: C. I. Reactive Red 180 on Novapak(C18) Using TBAHS and Gradient 1
AU
0.00 0.02 0.04 0.06 0.08 0.10 0.12 0.14 0.16
Minutes
0.00 0.20 0.40 0.60 0.80 1.00 1.20 1.40 1.60 1.80 2.00 2.20 2.40 2.60 2.80 3.00 3.20 3.40 3.60 3.80 4.00 4.20 4.40 4.60 4.80 5.00
1
.908 2.12
2
2.
23
2
2
.373
2.
4
9
6
2.
823
3.
058
3.
708
Figure 4.11: C. I. Reactive Red 239 on Novapak(C18) Using TBAB and Gradient 1
AU
0.00 0.05 0.10 0.15 0.20 0.25 0.30 0.35 0.40 0.45
Minutes
0.20 0.40 0.60 0.80 1.00 1.20 1.40 1.60 1.80 2.00 2.20 2.40 2.60 2.80 3.00 3.20 3.40 3.60 3.80 4.00 4.20 4.40 4.60 4.80 5.00
2.
568
2.
72
1
2.
829
3.
Figure 4.12: C. I. Reactive Red 239 on Novapak (C18) Using TBAHS and Gradient 1
AU
0.00 0.02 0.04 0.06 0.08 0.10 0.12 0.14 0.16 0.18
Minutes
0.00 0.20 0.40 0.60 0.80 1.00 1.20 1.40 1.60 1.80 2.00 2.20 2.40 2.60 2.80 3.00 3.20 3.40 3.60 3.80 4.00 4.20 4.40 4.60 4.80 5.00
2.56
0
2.88
3
Figure 4.13: C. I. Reactive Yellow 3 on Novapak (C18) Using TBAB and Gradient 1
AU
0.00 0.05 0.10 0.15 0.20 0.25 0.30 0.35 0.40 0.45 0.50 0.55
Minutes
0.20 0.40 0.60 0.80 1.00 1.20 1.40 1.60 1.80 2.00 2.20 2.40 2.60 2.80 3.00 3.20 3.40 3.60 3.80 4.00 4.20 4.40 4.60 4.80 5.00
1.
4
7
4
1
.578
2.
3
4
Figure 4.14: C. I. Reactive Yellow 3 on Novapak (C18) Using TBAHS and Gradient 1
AU
0.00 0.05 0.10 0.15 0.20 0.25 0.30 0.35 0.40 0.45 0.50
Minutes
0.00 0.20 0.40 0.60 0.80 1.00 1.20 1.40 1.60 1.80 2.00 2.20 2.40 2.60 2.80 3.00 3.20 3.40 3.60 3.80 4.00 4.20 4.40 4.60 4.80 5.00
1.13
8
1.4
2
3
1.
64
0
2.29
5
2.
46
3
Figure 4.15: C. I. Reactive Yellow 168 on Novapak (C18) Using TBAB and Gradient 1
AU
-0.02 0.00 0.02 0.04 0.06 0.08 0.10 0.12 0.14 0.16 0.18 0.20 0.22 0.24 0.26 0.28 0.30 0.32 0.34 0.36 0.38 0.40
Minutes
0.20 0.40 0.60 0.80 1.00 1.20 1.40 1.60 1.80 2.00 2.20 2.40 2.60 2.80 3.00 3.20 3.40 3.60 3.80 4.00 4.20 4.40 4.60 4.80 5.00
1.
372
1.
602
1.
667
2.
07
4
2
.490
2.
652
2.
765 2.88
1
3.
12
9
3.