Selvam College of Technology, Namakkal, Tamilnadu, India
A Detailed Study on Copper Composite Bar
Using ANSYS Finite Element Method
Pushparaja.M, Ramesh.S, Vetrivel.S
PG Scholar, Department of Mechanical Engineering, Sona College of Technology, Salem, India
Professor & Head of the Department of Mechanical Engineering, KCG College of Technology, Karapakkam,
Chennai, India
Assistant Professor, Department of Mechanical Engineering, Sona College of Technology, Salem, India
ABSTRACT: In the recent trends of material science, both Powder and Fibre Composites have been widely discussed due to various important properties of the composites like high strength, light in weight, better conductivity, etc. Taking into account the better conductive properties of the composites which are basically copper based, a new composition of copper based composite material is determined for a wide range of applications. The composite is then subjected to various tests in ANSYS workbench namely Total heat flux, Directional heat flux (Y axis), Maximum principal Stress, Maximum principal Elastic Stress, Equivalent Elastic Strain, Equivalent (von-misses) Stress, Total Deformation, Strain Energy, Modal test.
I. INTRODUCTION
1.1. Composite Materials
Composites are combinations of two materials in which one of the materials, called the reinforcing phase, is in the form of Fiber sheets or particles and are embedded in the other material called the matrix phase. The primary functions of the matrix are to transfer stresses between the reinforcing fibers/particles and to protect them from mechanical and/or environmental damage whereas the presence of fibers/particles in a composite improves its mechanical properties such as strength, stiffness etc.
A composite is therefore a synergistic combination of two or more micro-constituents that differ in physical form and chemical composition and which are insoluble in each other. The main objective is to take advantage of the superior properties of both materials without compromising on the weakness of either. Several light weight and high strength applications have successfully substituted the traditional materials by Composite materials. High strength-to-weight ratio, high tensile strength at elevated temperatures, high creep resistance and high toughness are the reasons why composites are selected for such applications.
Typically, in a composite, the reinforcing materials are strong with low densities while the matrix is usually a ductile or tough material. If the composite is designed and fabricated correctly it combines the strength of the reinforcement with the toughness of the matrix to achieve a combination of desirable properties not available in any single conventional material. The strength of the composites depends primarily on the amount, arrangement and type of Fiber and/or particle reinforcement in the resin.
II. LITERATURE REVIEW
XueyanLin and Qiang Wang revealed that copper bar as the research object, using ANSYS workbench to analyse the temperature distribution and characteristics of copper bar under different thermal conditions and the same current load, provide a basis for the choice of the design of the copper [1].
A.Dalirbod, Y. A. Sorkhe, H. Aghajani revealed fabricated the Alumina dispersion hardened copper-base composite by internal oxidation method. The high temperature tensile fracture of Cu-Al2O3 composite was studied and
Selvam College of Technology, Namakkal, Tamilnadu, India
means of optical microscope and field emission scanning electron microscope (FESEM) with energy dispersive spectroscopy (EDS). Results show that, ultimate tensile strength and yield strength of copper alumina nano-composite decrease slowly with increasing temperature. The yield strength reaches 119 MPa and ultimate tensile strength reaches 132 MPa at 780 °C. Surface fractography shows a dimple-type fracture on the fracture surface of the tensile tests where dimple size increases with increasing testing temperature and in some regions brittle fracture characteristics could be observed in the fracture surface [2].
V. V. Izmailova, I. N. Ushakovab, E. I. Drozdovab, O. P. Chernogorovab, and E. A. Ekimov revealed the electrical and tribological properties of a copper-based composite material reinforced by superelastic hard carbon
particles. Composite material specimens have been produced
using the high temperature pressing of mixtures of copper and fullerene powders. Electrical and tribological reciprocal tests carried out using the plane-on-plane arrangement have shown that the coefficient of friction of the composite material–Ni pair is lower than that of the reference L63 brass–Ni pair at similar values of contact electrical resistance. The abrasive wear resistance of the composite material is 40 times higher than that of brass. The developed copper-based composite materials reinforced by superelastic carbon particles hold promise for use in sliding electrical contacts [3].
S.G. Tantawi, V. Dolgashev, G. Bowden, J. Lewandowski, and C.D. Nantista have been developed and reported a resonant cavity with high quality factor and an interchangeable wall for testing of superconducting materials. A compact TE01 mode launcher attached to the coupling iris selectively excites the azimuthally symmetric cavity mode, which allows a gap at the detachable wall and is free of surface electric fields that could cause field emission, multifactor, and RF breakdown. The shape of the cavity is tailored to focus magnetic field on the test sample. They describe cryogenic experiments conducted with this cavity. An initial experiment with copper benchmarked our apparatus. This was followed by tests with Nb and MgB2. In addition to characterizing the onset of superconductivity
with temperature, our cavity can be resonated with a high power klystron to determine the surface magnetic field level sustainable by the material in the superconducting state. A feedback code is used to make the low level RF drive track the resonant frequency [4].
Guarded heat flow meter test method is used to measure the thermal conductivity of Copper powder filled epoxy composites using an instrument Unit herm TM Model 2022 in accordance with ASTM-E1530. In the numerical study, the finite-element package ANSYS is used to calculate the conductivity of the composites. Three-dimensional spheres-in-cube lattice array models are used to simulate the microstructure of composite materials for various filler concentrations. This study reveals that the incorporation of copper particulates results in enhancement of thermal conductivity of epoxy resin and thereby improves its heat transfer capability. The experimentally measured conductivity values are compared with the numerically calculated ones and it is found that the values obtained for various composite models using finite element method (FEM) are in reasonable agreement with the experimental values [5].
Surya Satish Adapa, JanardhanJaggavarapu and VijaykumarVedangiperformed an analytical analysis, a numerical model and an experimental investigation of a 3-point bending test on copper honeycomb with multi-layer sandwich panel are proposed. Here the copper honeycomb is developed as a single solid and multilayer of equivalent properties. In order to compute the effective properties of the single honeycomb core and analytical homogenization of the multi-layer one analytical and numerical (finite element) homogenization approaches are used. The experimental results obtained for the copper honeycomb core with stainless steel face sheets and copper core are compared with the results obtained from the numerical simulation (finite element) of 3-point bending test. Sandwich structure consists of copper honey comb core with stainless steel facing 2mm thick and copper sheet are used for sample preparations. Numerical simulations are carried out to study the deflection for various loads and for various core heights and compared with experimental values. Mostly honeycombs are an array of hollow hexagonal cells with thin vertical walls. Copper honey comb has numerous applications and it is low density permeable material [6].
Selvam College of Technology, Namakkal, Tamilnadu, India
Raj Mohan R, R. Venkatraman& S. Raghuramancarried out a work to identify the deformation behaviour of pure copper and its flow behaviour along the die using ANSYS V12. The Analysis is performed for different channel angles of 90˚, 110˚ and 120˚ for different hydrostatic pressure conditions. The results show that deformation along the die during pressing is inhomogeneous for various channel angles under different hydrostatic pressure conditions. Total displacement of sample during pressing decreases with increases with channel angle [8].
Titty Susan Thomas, Asraff A amdAirin M employed the modified Gurson model known as the Gurson-Tvergaard-Needleman (GTN) model for constitutive modeling of a high conductivity-high ductility copper alloy (Cu-Cr-Zr-Ti alloy) used in a rocket engine thrust chamber at three temperatures (300 K, 550 K, 700 K). The model parameters are evaluated from tensile tests conducted on smooth round subscale sized specimens in a high temperature UTM. Stress analysis of the tensile specimens has been performed using solid of revolution elements, considering both material and geometric nonlinearities. The Multilinear Isotropic Hardening plasticity model in association with Gurson model is used for damage modeling of the material using the ANSYS FEA code. Nine GTN model parameters of the alloy have been identified based on comparison of engineering stress strain graphs from tests and analysis. The parameters thus evaluated are subsequently used for collapse analysis of a simply supported beam and a heated pressure vessel made of copper alloy. Load testing of the beam is also conducted in 3 point bending and test results compared with analysis predictions [9].
D. Kiener, P. Hosemann, S. A. Maloy, and A. M. Minor showed that yield strengths approaching macroscopic values are measured from irradiated ~400 nm diameter copper specimens. Quantitative in situ nano-compression testing in a transmission electron microscope reveals that the strength of larger samples is controlled by dislocation-irradiation defect interactions, yielding size-independent strengths. Below ~400 nm, size-dependent strength results from dislocation source limitation. This transition length-scale should be universal, but depend on material and irradiation conditions. We conclude that for irradiated copper, and presumably related materials, nano-scale in situ testing can determine bulk-like yield strengths and simultaneously identify deformation mechanisms [10].
B.Jayachandriah, K. Rajasekhar studied and determined the various thermal properties of copper as mentioned below [11]:
1. Thermal Conductivity - 400 W/m ˚C 2. Density - 8933 kg/m3
3. Specific Heat - 385 J/kg ˚C
Thomas Stoebe demonstrated the process of work hardening in copper, i.e., hardening the metal by deformation. If an appropriate furnace is available, it also demonstrates the softening process of annealing. Copper wire or tubing is quite soft in its initial state, allowing for a variety of uses where the tubing needs to be bent to a desired shape. Upon bending, the copper hardens due to work hardening (also called strain hardening). Enough bending will make it impossible to return it to its original shape. However, annealing at a high enough temperature causes new, strain-free material to form and the copper will return to its original soft condition [12].
Selvam College of Technology, Namakkal, Tamilnadu, India
III. MATERIALS AND METHODS
This chapter describes the materials and methods used for the processing of the composites under this investigation. It presents the details of the characterization and thermal conductivity tests which the composite samples are subjected to. The numerical methodology related to the determination of thermal conductivity based on finite element method is also presented in this chapter of the thesis.
3.1. Copper
Copper bar is a high current conductive products, which is made of copper material, its cross section is rounded. Since copper bar has low resistivity, good conductivity, and the advantages of large bent, copper bar in the electrical equipment, especially the power distribution equipment has been widely applied. In the power system, the copper bar connect each branch circuit in the distribution unit together, plays a role of Collection, distribution and transmission of electrical energy.
Large current flows through a copper bar will produce thermal and mechanical effects. Since copper bar is a passive component, heat is mainly generated by the Joule heat loss I R2 when the current through and therefore the greater the current, the more heat is generated, causing copper to heat. If the heat cannot effectively transfer out, must make a dramatic increase in the temperature of copper bar. Which will overheat and burn.
In order to make the heating effect to meet the job requirements, need to reduce the resistance R to reduce the joule heat, or rapidly transfer heat to achieve thermal equilibrium. There exists electric power in copper bar when current through, which can generate vibration, if not fixed tightly, there will appear vibration and noise, the greater the current, the larger the electric power will be, and the greater the noise. Moreover if the copper bar is too small may lead to destroy because of insufficient strength, mechanical effect need to meet the use requirements.
The current carrying capacity should be considered when using copper bar. Carrying capacity refers to the effective value of current the copper bar can carry under specified condition. Copper-carrying capacity is formulated under constant load and a given reference conditions, it is associated with multiple factors, such as ambient temperature, air convection, laying methods and the surrounding environment.
After the copper bar determined, carrying capacity will depend on the environmental conditions. There are many problems in terms of treating copper carrying capacity in China's copper manufacturing industry, user departments, some of the technical organization and publishing sector.
Engineering and technical personnel will follow the technical manual or use the experience to choose the copper carrying capacity parameters in determining the copper bars. Technical information provides correction factor of carrying capacity in the different given ambient temperature, there also has the simple calculation formula considering only the temperature rise.
3.2. Copper Properties and Applications
The word copper comes from the Latin word 'cuprum', which means 'ore of Cyprus'. This is why the chemical symbol for copper is Cu. Copper has many extremely useful properties, including:
Good electrical conductivity
Good thermal conductivity
Corrosion resistance It is also:
Easy to alloy
Easily joined
Ductile
Tough
IV. MODELLING AND MESHING
4.1 Modelling
Selvam College of Technology, Namakkal, Tamilnadu, India
Fig.4.1. Dimension of the specimen
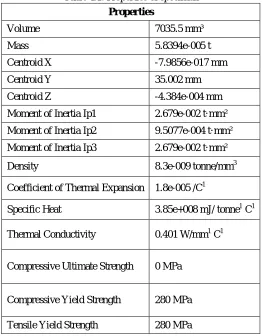
4.2Material Properties
The properties of the specimen are shown in below Table 4.1. These properties are used as input to the various analyses of the copper specimen rod in ANSYS workbench.
Table 4.1. Properties of specimen
Properties
Volume 7035.5 mm³
Mass 5.8394e-005 t
Centroid X -7.9856e-017 mm
Centroid Y 35.002 mm
Centroid Z -4.384e-004 mm
Moment of Inertia Ip1 2.679e-002 t·mm²
Moment of Inertia Ip2 9.5077e-004 t·mm²
Moment of Inertia Ip3 2.679e-002 t·mm²
Density 8.3e-009 tonne/mm3
Coefficient of Thermal Expansion 1.8e-005 /C1
Specific Heat 3.85e+008 mJ/ tonne1 C1
Thermal Conductivity 0.401 W/mm1 C1
Compressive Ultimate Strength 0 MPa
Compressive Yield Strength 280 MPa
Selvam College of Technology, Namakkal, Tamilnadu, India
Tensile Ultimate Strength 430 MPa
Shear Modulus 41045 MPa
Young's Modulus 1.10E+05 MPa
Poisson's Ratio 0.34
Bulk Modulus 1.15E+05 MPa
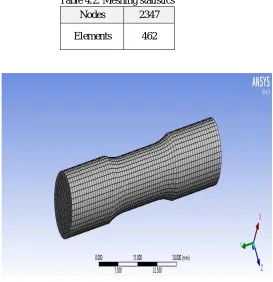
4.3 Meshing
Meshing is done in analysis for accurate and efficient solutions. A mesh well suited for a specific analysis can be generated with a single mouse click for all parts in a model. Tetrahedron element type is selected to mesh the copper specimen.
Table 4.2. Meshing statistics
Nodes 2347
Elements 462
Selvam College of Technology, Namakkal, Tamilnadu, India
V. RESULT AND DISCUSSION
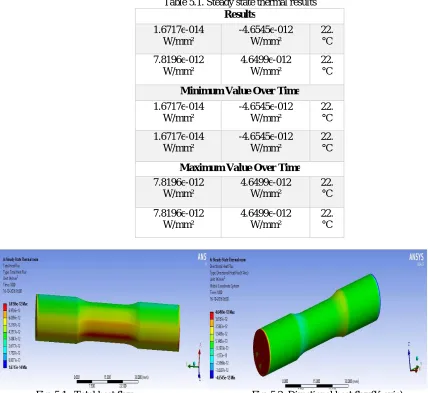
5.1 Steady state thermal
Table 5.1. Steady state thermal results
Results 1.6717e-014 W/mm² -4.6545e-012 W/mm² 22. °C 7.8196e-012 W/mm² 4.6499e-012 W/mm² 22. °C
Minimum Value Over Time
1.6717e-014 W/mm² -4.6545e-012 W/mm² 22. °C 1.6717e-014 W/mm² -4.6545e-012 W/mm² 22. °C
Maximum Value Over Time
7.8196e-012 W/mm² 4.6499e-012 W/mm² 22. °C 7.8196e-012 W/mm² 4.6499e-012 W/mm² 22. °C
Fig. 5.1. Total heat flux Fig. 5.2. Directional heat flux(Y axis)
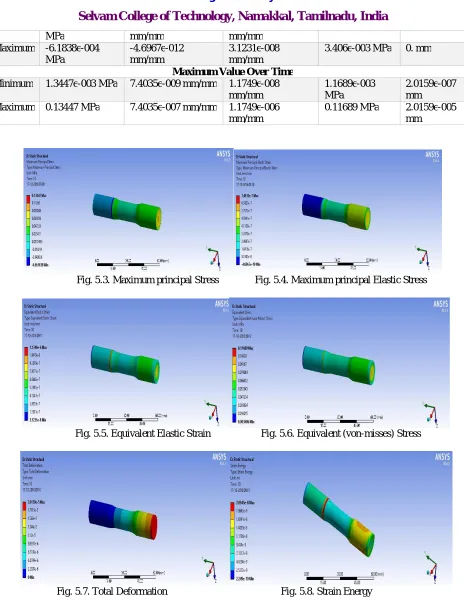
5.2. Static structural
Table 5.2. Static structural results
Results
Minimum -6.1838e-002 MPa
-4.6967e-010 mm/mm
3.1231e-008 mm/mm
3.406e-003 MPa 0. mm
Maximum 0.13447 MPa 7.4035e-007 mm/mm 1.1749e-006
mm/mm
0.11689 MPa 2.0159e-005 mm
Minimum Value Over Time
Selvam College of Technology, Namakkal, Tamilnadu, India
MPa mm/mm mm/mm
Maximum -6.1838e-004 MPa
-4.6967e-012 mm/mm
3.1231e-008 mm/mm
3.406e-003 MPa 0. mm
Maximum Value Over Time
Minimum 1.3447e-003 MPa 7.4035e-009 mm/mm 1.1749e-008 mm/mm
1.1689e-003 MPa
2.0159e-007 mm
Maximum 0.13447 MPa 7.4035e-007 mm/mm 1.1749e-006
mm/mm
0.11689 MPa 2.0159e-005 mm
Fig. 5.3. Maximum principal Stress Fig. 5.4. Maximum principal Elastic Stress
Fig. 5.5. Equivalent Elastic Strain Fig. 5.6. Equivalent (von-misses) Stress
Selvam College of Technology, Namakkal, Tamilnadu, India
5.3. Modal
Fig. 5.9. Modal Frequency of copper Bar Fig 5.10. Modal test
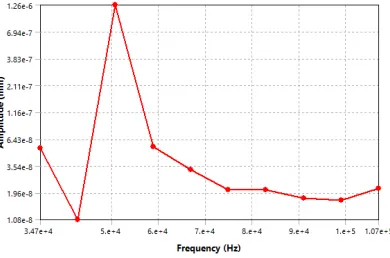
5.4. Harmonic Analysis
Harmonic analysis is carried out to determine the amplitude of vibration at the copper bar testing
Fig 5.11. Harmonic Analysis
VI. CONCLUSION
The analyses of the pure copper material in the form of a test specimen specified under the section 4.1 in the Fig. 4.1 is performed and the results are tabulated in the previous chapter. From the results, it is clear that the percentage variation in the maximum heat flux at 60 ⁰C and 400 ⁰C is found to be improved by 89%. When the test specimen is subjected to a rotational velocity of 100 rad/s, the maximum principal stress obtained is found to be 0.13447 MPa which is well within the limit of the yield strength of copper as mentioned in the Table 4.2. The test specimen has the first mode of frequency at 26690 Hz.
REFERENCES
1. XUEyanLin A and QIANG Wang, Analysis and Research on Different Thermal Conditions of Copper bar.2005.
2. XueLiang Ma. High voltage switch cabinet bus selection process. Shenyang Huali Energy Equipment Manufacturing Co., Ltd.2003. 3. DeGui Chen. Progress in the thermal analysis of low voltage apparatus. Low voltage electrical apparatus.2008.
4. Qun He, Fei Mo. Application of bare copper in the deexcitation of the switch cabinet. Electrician abstracts.2009.
5. Kunal K Saraf. study on effective thermal conductivity of copper particle filled polymer composites national institute of technology,rourkela,may, 2011
Selvam College of Technology, Namakkal, Tamilnadu, India
7. Sampath S S, Anil Antony Sequeira, ChithiraiPonSelvan M, Sawan Shetty. Comparative Thermal Analysis of Bar Element Connected to Different Heating Sources Dubai, UAE,2014.
8. Raj Mohan R, R. Venkatraman& S. Raghuraman.analysis on deformation behaviour for pure copper processed through equal channel angular pressing die SASTRA University, Thanjavur, 613401, India, 2012.
9. Titty Susan Thomas, Asraff A.K, Airin M. G Damage. Modeling of Highly Ductile Copper Alloy,Structural Dynamics & Analysis Group, LPSC, Trivandrum, Kerala,2014
10. D. Kiener, P. Hosemann, S. A. Maloy and A. M. Minor. In situ nano-compression testing of irradiated copper University of California, Berkeley, CA 94720 (USA),2012.
11. B.Jayachandriah, K. Rajasekhar. Thermal Analysis of Tubular Heat Exchangers Using ANSYS srikalahasteeswara institute of technology, Srikalahasti Corresponding author e-mail:[email protected],2014.
12. Thomas Stoebe. Work Hardening and Annealing of Copper University of Washington Seattle, WA [email protected]
13. Sha Xu, XianLongJin. Vibration and noise analysis and control of low voltage and heavy current busbar bridge. Chinese Journal of Mechanical Engineering.2007.
14. Ciyuan Yu, XiangZhen Yu. A preliminary study on the thermal design, thermal analysis and thermal testing technique of electronic equipment. Microelectronics.2000.
15. GuoDong Ma. Discussion on cable ampacity correction and practical algorithm in different laying conditions and load flow reference value set. Electric power construction.1998.
16. Jianfeng Zhang, CuiLin Wang. Application of ANSYS finite element analysis software in thermalanalysis. Energy for metallurgical industry.2004.
Website references
1. Contemporary Approaches in Material Science and Materials Processing Technologies 10.4028/www.scientific.net/AMR.1120-1121