ABSTRACT
MORALES, DANIEL HUMPHREY. Hydrogel Actuation by Electric Field Driven Effects. (Under the direction of Dr. Michael D. Dickey and Dr. Orlin D. Velev).
Hydrogels are networks of crosslinked, hydrophilic polymers capable of absorbing and releasing large amounts of water while maintaining their structural integrity. Polyelectrolyte hydrogels are a subset of hydrogels that contain ionizable moieties, which render the network sensitive to the pH and the ionic strength of the media and provide mobile counterions, which impart conductivity. These networks are part of a class of “smart” material systems that can sense and adjust their shape in response to the external environment. Hence, the ability to program and modulate hydrogel shape change has great potential for novel biomaterial and soft robotics applications. We utilized electric field driven effects to manipulate the interaction of ions within polyelectrolyte hydrogels in order to induce controlled deformation and patterning. Additionally, electric fields can be used to promote the interactions of separate gel networks, as modular components, and particle assemblies within gel networks to develop new types of soft composite systems.
First, we present and analyze a walking gel actuator comprised of cationic and anionic gel legs attached by electric field-promoted polyion complexation. We characterize the electro-osmotic response of the hydrogels as a function of charge density and external salt concentration. The gel walkers achieve unidirectional motion on flat elastomer substrates and exemplify a simple way to move and manipulate soft matter devices in aqueous solutions.
gel to induce relief patterns and evoke localized stress, causing rapid folding in air. The ionically patterned hydrogels exhibit programmable temporal and spatial shape transitions which can be tuned by the duration and/or strength of the applied electric field.
We extend the use of ionoprinting to develop multi-responsive bilayer gel systems capable of more complex shape transformation. The localized crosslinked regions determine the bending axis as the gel responds to the external environment. The bending can be tuned to reverse direction isothermally by changing the solvent quality or by changing the temperature at a fixed concentration. The multi-responsive behavior is caused by the volume transitions of a non-ionic, thermos-sensitive hydrogel coupled with a superabsorbent ionic hydrogel.
Hydrogel Actuation by Electric Field Driven Effects
by
Daniel Humphrey Morales
A dissertation submitted to the Graduate Faculty of North Carolina State University
in partial fulfillment of the requirements for the degree of
Doctor of Philosophy
Chemical Engineering
Raleigh, North Carolina 2015
APPROVED BY:
_______________________________ ______________________________
Dr. Orlin D. Velev Dr. Michael D. Dickey
Committee Co-Chair Committee Co-Chair
________________________________ ________________________________ Dr. Jan Genzer Dr. John Muth
DEDICATION
This dissertation is dedicated to my grandfather, Michael Paul Stucky, who left us too soon. His fierce intelligence and passion for helping others will inspire me throughout my life. I
BIOGRAPHY
ACKNOWLEDGMENTS
With much gratitude and admiration, I would like to thank Dr. Michael Dickey and Dr. Orlin D. Velev for their unwavering support and guidance during my graduate studies. I have learned so much about the scientific process, paper writing, experimental design and presenting over the past five years because of them. I am also grateful to my committee members, Dr. Jan Genzer, Dr. Peter Fedkiw and Dr. John Muth for their guidance and insight throughout my time at NC State. In particular, Dr. Genzer was always available for useful discussions about polymers and allowed me to work in his lab extensively with the ellipsometer. I would also like to thank Dr. David Aspnes and Dr. Nicholas Stoute for their assistance and guidance with ellipsometry.
I would like to thank the Research Triangle MRSEC for the education and outreach opportunities and for the financial support that made part of this research possible. The knowledge, experience and comradery gained in the MRSEC has been vital to my graduate experience.
I am grateful to past and present members of the Dickey and Velev research groups. In particular, the dynamic duo, Dr. Ju-Hee So and Dr. Hyung Jun Koo whom mentored me when I first began my program. Following in their footsteps, I pass the hydrogel research torch to Timothy Shay. Keep working hard and pursuing great ideas! I am forever grateful for the times I shared working with Dr. Etienne Palleau and Dr. Bhuvnesh Bharti in the lab, both of whom taught me so much.
thank my family who provide an unending well of support, even though they don’t
TABLE OF CONTENTS
LIST OF TABLES ... xi
LIST OF FIGURES ... xii
CHAPTER 1 ...1
General Introduction of Hydrogel Based Actuation by Ion Driven Effects ...1
1.1 Introduction ... 1
1.2 General Hydrogel Background ... 1
1.3 Equilibrium Swelling Behavior ... 3
1.4 Electro-Osmotic Effect ... 8
1.5 Electrolysis Effect... 14
1.6 Ionic Binding Effects... 18
1.7 Ionic Conductivity within Gels ... 21
1.7.1 Ionic Devices ...21
1.7.2 Polyelectrolyte hydrogel adhesion ...23
1.8 Gel Bilayer Systems ... 26
1.9 Gel/Particle Composite Systems ... 29
1.10 Layout of this Dissertation ... 33
1.11 Publications ... 34
1.12 References ... 35
CHAPTER 2 ...49
Electro-actuation hydrogel walkers with dual responsive legs ...49
2.1 Introduction ... 49
2.2 Experimental Section ... 50
2.2.2 Hydrogel Fabrication ...51
2.2.3 Gel Walker Fabrication ...52
2.2.4 Hydrogel Equilibrium Swelling ...52
2.2.5 Electro-Actuation ...53
2.2.6 Mechanical Testing ...55
2.2.7 Charge Density Measurements...55
2.2.8 NMR Experiments ...56
2.3 Results and Discussion ... 57
2.3.1 Gel Walker Fabrication and Assembly ...57
2.3.2 Gel Walker Motion Mechanism ...61
2.3.3 Electro-Actuation ...64
2.3.4 Charge Density Analysis ...70
2.3.4 Effect of Mechanical Properties on the Bending Curvature ...79
2.4 Conclusions ... 81
2.5 Acknowledgements ... 82
2.6 References ... 83
CHAPTER 3 ...89
Reversible patterning and actuation of hydrogels by electrically assisted ionoprinting ...89
3.1 Introduction ... 89
3.2 Experimental Section ... 90
3.2.2 Hydrogel fabrication ...91
3.2.3 EPR measurements ...91
3.2.4 ICP-OES measurements ...91
3.2.4 Indentation measurements ...92
3.3 Results and Discussion ... 92
3.3.1 Principles of the Ionoprinting Technique ...92
3.3.2 Reversible High-Fidelity Ion Crosslinking ...99
3.3.3 Properties of Ion Patterns for Differential Swelling and Shrinking ...100
3.3.4 Hydrogel Bending Behavior in Ethanol ...106
3.3.5 Ionoprinting for Soft Matter Actuation...110
3.3.6 Proof of Concept of the Ionoprinting Technique with Other Divalent Ions ...112
3.4 Conclusions ... 114
3.5 Acknowledgements ... 114
3.6 References ... 115
CHAPTER 4 ...118
Ionoprinted Multi-Responsive Hydrogel Bilayers ...118
4.1 Introduction ... 118
4.2 Methods ... 120
4.2.1 Materials...120
4.2.2 Hydrogel Polymerization...120
4.2.3 Bilayer Fabrication ...121
4.2.5 Bending Curvature Analysis ...123
4.3 Results and Discussion ... 123
4.3.1 Strategy for Bilayer Design and Bending Direction Tunability ...123
4.3.2 Response Analysis of Individual Gel Layers ...126
4.3.3 Response of Hydrogel Bilayers to External Stimulus ...130
4.3.4 Effect of Ionoprinting on the Bending Behavior...134
4.3.5 Demonstration of Complex Shapes using Ionoprinting...138
4.4 Conclusions ... 140
4.5 Acknowledgements ... 140
4.6 References ... 141
CHAPTER 5 ...146
Directing the Self-reconfiguration of Thermoresponsive Hydrogels by Field-Assembled Particle Endoskeletons ...146
5.1 Introduction ... 146
5.2 Methods ... 148
5.2.1 Materials...148
5.2.2 Particle Alignment by Dielectrophoresis ...148
5.2.3 Hydrogel Polymerization...149
5.2.4 Bending Curvature ...149
5.2.5 Diffraction Pattern Analysis ...149
5.2.6 COMSOL Simulations ...151
5.3.1 Particle Embedded Hydrogel Sheet Fabrication ...151
5.3.2 Temperature Response ...154
5.3.3 PE Gel Sheets with Aligned Particles vs Non-Aligned Particles ...157
5.3.4 Effect of Endoskeletal Structure Morphology on Bending ...163
5.3.5 Micro-patterned Shape Reconfiguration ...169
5.4. Conclusions ... 173
5.5 Acknowledgements ... 173
5.6 References ... 174
CHAPTER 6 ...179
Summary and Future Work ...179
6.1 Conclusions ... 179
6.2 Future Outlook ... 182
LIST OF TABLES
Table 2.1. Summary of NMR analysis to determine amount of unpolymerized
LIST OF FIGURES
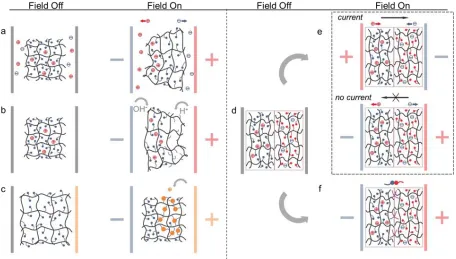
Figure 1.1. Illustration of a polyelectrolyte hydrogel network This hydrogel has fixed anionic charge groups on the polymer backbone, denoted as circles containing ‘-‘ symbols. Some of the charge groups are non-ionized due to the pH of solution or counter ion condensation, denoted as open circles. ...2 Figure 1.2. Electric field driven ion effects (a) Electro-Osmotic Effect (b) Electrolysis
Effect (c) Ionic Binding (d) Ionic Conductivity within Hydrogels (e) Ionic Devices (f) Polyelectrolyte Hydrogel Adhesion ...8 Figure 1.3. Principles of electro-osmotic gel bending (a) Schematic illustration of the
electro-osmotic bending mechanism. The black circle represent the anode side and the white circle cathode side.37 (b) Bending of a polyacrylamide (pAAm) hydrogel with carboxylic groups towards the cathode under application of a DC electric field (8 V/cm).25 (c) Electro-osmotic bending of an anionic gel equilibrated in 0.01 M NaCl and immediately placed in the external salt solution before application of a 5 V/cm electric field. Positive values indicate bending toward the cathode and negative values indicate bending toward the anode. Bending curvature is defined as 1/R.34 (d) Above: Variation of osmotic pressure with external Na+ concentration for various amounts of fixed SO-3 groups. The black arrow (anode side) drops to a lower fixed charge line. The gray arrow (cathode side) jumps to a higher fixed charge line. The switch in osmotic pressure distribution reverses the bending direction. Below: Illustrations of steady state bending conformations for high and low cross-link anionic gels.46 ...11 Figure 1.4. Examples of electro-osmotic gel actuators (a) Illustrations depicting the
upward, ready to propel. During the propelling phase, the aquabot rapidly moved upward by the propulsion of all four tentacles (15 V).11 Scale bar =1 mm. (c) Example of oil droplet sorting for a gel actuator fixed between two silver electrodes.47 Scale bar = 1 mm. ...13 Figure 1.5. Principles and applications of electrolysis driven shape change (a)
Evolution of pH changes within a hydrolyzed pAAm gel containing carboxylic groups in a 0.1 M KCl solution with universal pH indicator. The pink front represents movement of hydroxide ions and the deep purple front represents movement of hydroxide ions. Widths of the pH fronts plotted against time for both cases. Solid lines represent fits of the pH propagation distance versus time (~t1/2 and ~t, respectively).25 (b) Image of hydrogel grabber using pH responsive gel rods in air.50 (c) Schematic and optical microscope images of pH-responsive gel posts using electrolysis. The top row shows directional actuation using flat posts. The bottom row shows actuation using a honeycomb patterned surface. Left column: contracted hydrogel. Middle column: transition state hydrogel showing a sharp boundary between the two states. Right column: swollen hydrogel. 62 Scale bars = 20 µm. (d) Above: Images of acidic actuation wave propagating along an array of hydrolyzed pAAm hydrogel cilia (15 µm thick) and illustrated by the orange squares underneath. Below: Shrinking of a single cilium (t0-t3 = 4 seconds).48 ...16 Figure 1.6. Principles and applications of ion binding to hydrogels (a) By applying a
potential to a patterned Cu anode, Cu2+ ions complex locally with anionic hydrogels.79 (b) Above: Side view of an ionoprinted pNaAc gel at various time steps (5 V). The current determines the amount of copper bound to the hydrated network, which controls the depth of imprinting and degree of gel curvature as a result of ionic crosslinking. Scale bar = 3 mm. Below:
Demonstration of shape memory by shaping the gel and subsequently promoting ionic crosslinking.81 (d) Shape changing of selectively locally annealed acrylonitrile based hydrogel with thickness of 0.5 mm after immersion in 50% ZnCl2 solution...20 Figure 1.7. Hydrogel based ionic devices (a) Current density as a function of applied
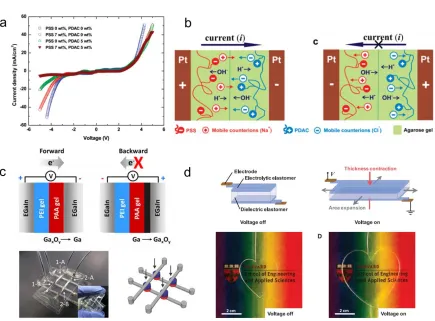
bias for junctions prepared with different gel combinations. The I-V curves demonstrate that only junctions prepared from two oppositely charged polyelectrolyte gels show significant current rectification.84 (b) Structure and operating mechanism of a polyelectrolyte gel based diode. In the forward direction, mobile counterions cross the interface to generate current. In the reverse direction, hydronium and hydroxide meet at the interface, forming water and reducing the current drastically.84 (c) Above: A schematic of the hydrogel diode with asymmetrically configured polyelectrolyte gels in contact with liquid metal under forward and reverse bias. Below: A photograph of an entirely soft memristor circuit with individual gel diode nodes.85,86 (d) Schematic and images of a transparent actuator with rapid, frequency dependent actuation. When subject to high voltage (~kV) two layers of the electrolytic elastomer (pAAm hydrogel with NaCl) collect ions of opposite charge on each side of the dielectric elastomer. The attractive oppositely charged interfaces cause the dielectric to reduce its thickness and expand its area.88 ...22 Figure 1.8. Examples of electrostatic hydrogel adhesion (a) Ionized
have broken. Abbreviations: chitosan10:gelatin gels containing 10% chitosan; PGA10 and PGA20: gelatin gels containing 10% and 20% sodium poly(g-glutamate), respectively.92 (e) Image of the bilayers at 20 C (left column) and 40 C (right column). Above: The bilayer separates at 40 C. Below: The bilayer has been re-swelled in an ethanol mixture and remains attached at 40 C.95 All scale bars are 4 mm. ...26 Figure 1.9. Examples of multilayer hydrogel actuators (a) Illustration of the response
mechanism of a typical bilayer gel actuator in solution.99 (b) Encapsulation of yeast cells by star-like thermo-responsive bilayer actuators.101 (c) Self-folding hydrogel trilayer origami. When the temperature is increased, the hydrogel polymer layer deswells, causing the Randlett’s bird configuration to revert to an unfolded flat sheet.103 (d) Example of a bidirectional hydrogel actuator containing two active layers, which incur different swelling ratios as a function of salt concentration. (e) Schematics illustrating reversible self-folding of a thermo-responsive microgripper. Above 36 °C, the pNIPAMAAc layer excludes water and contracts which, causes the gripper to first open flat and then close such that the PPF segments face outward. Below 36 °C, the active layer absorbs water and then closes in the opposite direction.96 ...29 Figure 1.10. Hydrogel/particle systems with directional properties (a) I-V curves for
for a randomly distributed sample and the aligned magnetic sample in two directions.119 ...31 Figure 2.1. Bending curvature as a function of time for various sodium acrylate gel
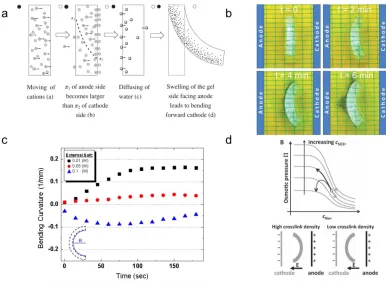
compositions and external salt concentrations. There is good agreement between the two gel diameters after normalizing the bending date to 2 mm. This indicates that the bending degree is linearly related to the diameter of the gel cylinder after equilibration. ...54 Figure 2.2. Overview of the direction of gel bending in electrolyte solution in response
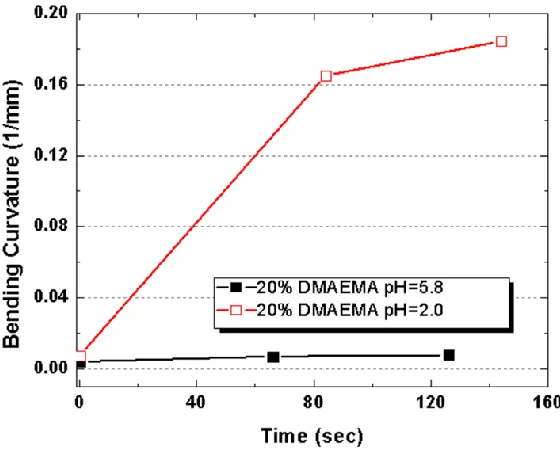
to an electric field. (a) Illustrations of the bending direction for gel networks equilibrated in NaCl solutions as a function of the sign of the fixed charge groups (anionic in gray, cationic in blue). (b) Graph of the inverse radius of curvature (1/R = bending curvature) as a function of time. Positive curvature indicates bending toward the cathode and negative curvature indicates bending toward the anode. ...57 Figure 2.3. Bending curvature of a 20% DMAEMA hydrogel as a function of time.
Bending is observed in acid medium since fixed charges are only present upon protonation of the tertiary amine groups. ...58 Figure 2.4. Overview of the gel walker fabrication process. (a) Illustration of the laser
amine groups used to promote covalent bonding at the interface between the gel legs. ...59 Figure 2.5. Bending curvature for 20% DMAEMA-Q gels and 20% NaAc gels,
respectively, as a function of time. (a) The results indicate that within experimental error, equilibration in EDC and BPB did not affect the bending curvature. This implies that the amine/carboxylic coupling reaction, initiated by EDC, only proceeding to a minimal degree within the gel network. (b) The EDC did not affect the bending degree of the 20% NaAc gel after equilibration...61 Figure 2.6. Actuation mechanism of the gel walker. (a) Illustrations depicting the two
modes of actuation depending on the direction of the applied electric field. Fc and Fa are the friction force of the cationic leg (dark blue) and anionic leg (light grey) respectively. (b) Photographs of a gel walker in 0.01 M NaCl composed of 50% NaAc and 30% DMAEMA-Q legs with an applied field of 5 V/cm. Scale bar = 5 mm ...62 Figure 2.7. The Young’s modulus plotted as a function of crosslinker to monomer ratio
for a 20% DMAEMA-Q gel. Increasing the crosslinker within the gel increases the modulus within the range studied. ...63 Figure 2.8. The bending magnitude as a function of external salt concentration for each
sodium acrylate/acrylamide gel composition. (a) Illustration of the mobile ion distribution for an anionic gel after application of an electric field. Higher osmotic pressure at the anode side of the gel drives bending toward the cathode. The radius of curvature is indicated by R. (b-i) The bending curvature as a function of applied electric field time in various NaCl solutions. The mole fraction of sodium acrylate in the gel network increases for each subsequent graph. ...66 Figure 2.9. Plot of the rate of increasing bending curvature as a function of the sodium
Figure 2.10. Bending curvature as a function of time for the sodium acrylate gels equilibrated in 0.01 M NaCl. Immediately after placing in 0.05 M NaCl and applying an electric field (5 V/cm), the bending is greatly diminished. The direction of bending temporarily reverses when placed in a salt solution with a concentration much higher than the equilibration solution (0.1 M NaCl). ...70 Figure 2.11. (a) Plot of sodium ions initially in the gel and those expelled into a
Cu2SO4 solution as a function of the gel composition. The good agreement indicates that the amount of sodium acrylate groups in the precursor solution is the same as in the polymerized gel. (b) Plot of the effective charge density (f) (calculated from Eqn. 8 and S4) and equilibrium swelling ratio in water as a function of the gel composition. The dotted line represents the expected charge density (F) if all of the sodium acrylate groups present in the gel were ionized. The amount of effective charge groups begins to plateau past 50% NaAc (c) Plot of the measured (points) and calculated (lines) volume swelling ratio as a function of the external salt concentration. The ratios of effectively charged groups calculated from theory in water (f) were used to predict the gel swelling in salt solutions. ...72 Figure 2.12. NMR spectra of wash water samples retrieved from equilibrated
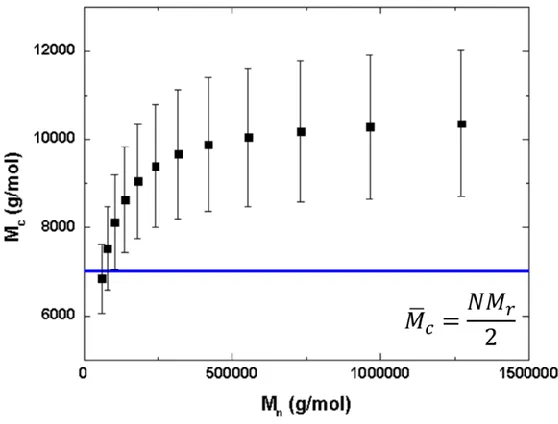
hydrogels. ...76 Figure 2.13. Plot of the molecular weight between crosslinks as a function of the
polymer chain molecular weight in the absence of crosslinker. The blue line is the molecular weight between crosslinks if all of the crosslinker molecules formed ideal crosslinks as calculated by the inset equation. The error bars represent the s.d. from five separate pure acrylamide equilibrium swelling values. ...77 Figure 2.14. Plot of Young’s modulus as a function of the gel composition equilibrated
with increasing fixed charge density, indicating that a lower modulus does not correspond to increased gel bending. ...80 Figure 3.1. Principles and example of the ionoprinting process. (a) By applying a
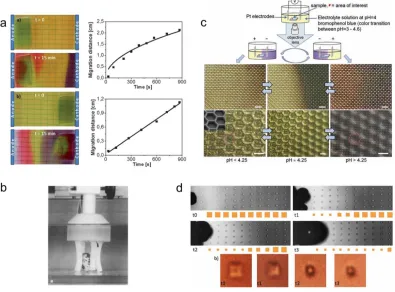
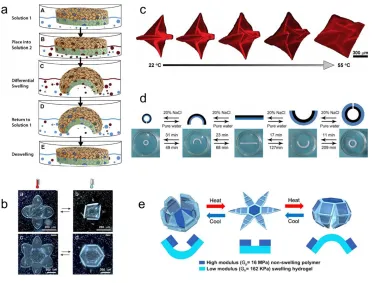
potential to a patterned Cu anode, Cu2+ ions complex locally with anionic hydrogels; (b) Side view of an ionoprinted pNaAc (poly sodium acrylate) gel using a 3.2 mm diameter copper cylinder at various time steps (5 V). The current determines the amount of copper bound to the hydrated network which controls the depth of imprinting and degree of gel curvature as a result of ionic crosslinking. Scale bar = 3 mm; (c) Ionoprinting current and imprinted depth versus time based on triplicate experiments (5 V). The error bars represent s.d. The depth of the copper imprinted layer was measured by micrographs of cross sectional slices of the hydrogel. The superimposed blue line is only used to guide the eyes. Using inert graphite electrodes results in a background current of 15 mA/cm² for the natural ionic conduction of the hydrogel. ...93 Figure 3.3. Copper complexation vs. applied potential during the ionoprinting process.
The onset of passivation of the copper ion complexation is shown for 3 V and 15 V applied potentials. The inset graph compares the integral of the applied potential vs. the amount of copper bound during the ionoprinting process. The amount of bound copper was quantified by inductively-coupled plasma optical emission spectroscopy (ICP-OES). Experiments were conducted in triplicate and error bars represent s.d...95 Figure 3.4. Ionoprinting process vs. hydrogel composition Micrographs and the
groups near the electrode and the larger distance between charge groups. However, the stress induced by the ion complexation generates self-delamination of the layer containing the complexed Cu2+ ions up to 60 % of AA content. Above this threshold, the ionoprinted layer is observed to remain joined to the rest of the hydrogel due to the abundance of fixed charge groups near the electrode. The fast protonation of charge groups near the electrode limits further complexation deeper in the gel and reduces imprint depth. Each measurement was conducted in triplicate and the error bars indicate s.d. ...97 Figure 3.5. Imprinted depths vs. applied potential during the ionoprinting process. 5
mm diameter copper pellets were used to ionoprint 1 cm thick pNaAc gels with various potentials: 1V, 3V, 5V, 10V, 20V. The depth of the copper imprinted layer was measured by micrographs of cross sectional slices of the hydrogel. Figures 3.1b and 3.1c of the manuscript demonstrate how the depth of the patterns of ions can be tuned by varying the ionoprinting time. We explain in the manuscript that a voltage threshold of 2-3 V is required to initiate the ion complexation process. (a) Visual patterns of ions produced at various voltages during 15s. (b) the depth of the imprints can be tuned by controlling the applied voltage. We notice a plateau trend above 10 V meaning that enough ions are provided and complexed with the hydrogel network, which begins to saturate. Experiments were conducted in triplicate and errors bars represent standard deviation. Superimposed lines are plotted to guide the eye. ...98 Figure 3.6. Reversible two and three dimensional patterning by ionoprinting. (a) An
diameter circular pattern, ionoprinted on a pNaAc gel, is erased by immersion in EDTA (Ethylenediaminetetra acetic acid) for 4 h. The pattern disappears due to the chelation and the gel shrinks due to osmotic equilibrium in 0.1 M EDTA. The hydrogel sample was extracted from solution to take the corresponding photos. ...99 Figure 3.7. Area change of virgin gels and ionoprinted layers vs. immersion time
Normalized area as a function of time for non-imprinted pNaAc gels immersed in ethanol, HCl , NaOH and imprinted gels immersed in ethanol. Experiments were conducted in triplicate and error bars represent s.d. ...101 Figure 3.8. Spatially and sequentially programmable three dimensional gel shapes. (a)
3 mm thick gel ionoprinted with 5 lines. As a result of the stresses developed during ionoprinting, the gel initially bends perpendicular to the imprinted directions (green arrow). Once immersed in EtOH (ethanol), the stiffer ionoprinted regions guide the asymmetric shrinking and reshaping of the gel structure (blue arrow). The initial shape recovers when placed in water. Scale bars = 15 and 10 mm respectively; (b) Example of a controlled shape by differential ionoprinting and subsequent time-dependent shape transformation after immersion in EtOH and EDTA (Ethylenediaminetetra acetic acid) respectively. Scale bar = 5mm. (c) A sequentially imprinted gel cube. The ionic crosslinks bind the imprints at the joints and provide a rigid frame controlling the structure during shrinking and swelling. Scale bar = 2 mm; d, Repetitive ethanol/water cycles of bending of a hydrogel strip imprinted with a single line, showing ~30% reduction in bending after ten cycles as measured by the end to end distance. ...103 Figure 3.9. Example sequence of spatial and temporal bending control by differential
compared to i+, which exhibits a much larger degree of curvature due to higher cupric ion complexation in the i+ region. ...105 Figure 3.10. Characterization of the bending behavior of ionoprinted gel slabs in
ethanol. (a) Bending curvature vs. immersion time in EtOH (ethanol) for ionoprinted gels of various widths and a constant thickness of 3 mm. (b) Bending curvature vs. immersion time in EtOH for ionoprinted gels of various thickness and a constant width of 5 mm. (c) Bending curvature as a function of the gel thickness. The simulation curve corresponds to Timoshenko’s model corrected with a fitting parameter of 0.5. Scale bar = 1 cm; (d) Mass of a fully ionoprinted gel and a virgin one after immersion in EtOH. The amount of water rapidly expelled from the fully ionoprinted gel is compared to the virgin one. Inset gridlines are 5 mm apart. All above experiments were conducted in triplicate and error bars represent s.d. ...107 Figure 3.11. Mass loss of pNaAc gels as a function of immersion time in EtOH.
Experiments were conducted in triplicate and the errors bars represent standard deviation. ...110 Figure 3.12. Prototypes of soft actuators. (a) The stress induced by an applied potential
folds the gel towards the anode. By alternating the field, the soft tweezers can handle and release a 0.1 g PDMS (polydimethylsiloxane) cube. Scale bar = 10 mm; (b) An X-shape gel suspended with a wire permits extraction of a small 1 g blue cube of PDMS from ethanol solution and subsequent release in water. Scale bar = 10 mm. ...111 Figure 3.13. Comparison of the ionoprinting of 2D/3D pNaAc gel structures using
various electrodes. Proof of concept using other divalent ions to control ion chain crosslinking with an electric field. The middle column illustrates the ion diffusion after five minutes. The right column shows the degree of bending in air immediately after ion complexation. ...113 Figure 4.1. Theoretical bilayer bending curvature as a function of the thickness ratio.
Figure 4.2. Schematic illustration of the adhesion and bending behavior of a hydrogel bilayer. The thermo-responsive gel layer is shown in grey and the superabsorbent gel layer is shown in white. (a) The two layers are allowed to equilibrate in DI water to reach full swelling capacity. (b) An applied electric field (10 V/mm) promotes electrostatic polyion complexation at the interface of the two gels. The green chains represent the anionic carboxylic chains of the pNaAc gel and the red chains represent the cationic primary amine group chains of the PEI polymer. (c) After adhesion the bilayer is equilibrated in in a 1 mM EDC solution. The bilayer is flat in room temperature water, bends toward the pNIPAAm in warm water and toward the pNaAc layer in EtOH. (d) By applying an oxidative potential to a copper wire, Cu2+ ions complex locally within the anionic hydrogel creating a rigid, highly crosslinked region. In warm water, the ionoprint is on the interior of the curvature and parallel to the bending axis. In EtOH, the ionoprint is on the exterior of the sample and perpendicular to the bending axis. ...125 Figure 4.3. Response of the individual hydrogel layers to temperature and solvent
quality. All reported values are relative to the reference state of room temperature water. (a) The actuation strain of pNIPAAm gel strips, ε1, in various mixtures of EtOH and water as a function of temperature. (b) The actuation strain, ε1, above and below the LCST as a function of solvent quality. (c) The actuation strain of pNaAc gel strips, ε2, in various mixtures of EtOH and water as a function of temperature. (d) The actuation strain, ε2, at 24 oC and 40 oC as a function of solvent quality. The errors bars represent the S.D of five samples. ...129 Figure 4.4. Bending behavior of bilayer gel actuators at various temperatures and
T. (e) Bilayer bending behavior at x2 = 0.05 as function of T. (f) Bilayer bending behavior at x2 = 0.35 as function of T. The solid blue lines are the fit curves from Equation 4.1. The dashed lines provide a guide for the transition from positive to negative curvature. (g) Photographs of a bilayer gel actuator showing positive curvature in pure water at 40 oC and subsequent negative curvature after immersion in EtOH at 24 oC (x2 = 0.5). The last frame shows that the amplification of the bending magnitude of the temperature is increased to 40 oC to induce the UCST behavior of pNIPAAm. The pNaAc layer has been stained with brilliant green dye for visualization. Scale bar = 2mm...132 Figure 4.5. Ionoprinted multiresponsive bilayer actuators (a) Micrograph of the a
cross-section of the bilayer with an external ionoprint. Inset: Top down view of an ionoprinting bilayer. Scale bar = 12 mm. (b) The final orientation of the curvature relative to the ionoprint direction at 40 oC. Left column: Gel bilayers with the internal ionoprints located at the interface. Right column:
Gel bilayers with the external ionoprints located at the top. Insets: Photographs of the bilayer bending behavior. ...136 Figure 4.6. Position of the line of zero strain as a function of the pNIPAAm thickness.
The dashed line marks the interface between the two gel layers. ...137 Figure 4.7. Unique shape responses of hydrogel bilayers enabled by external
ionoprints. Left column: Schematic of the ionoprint design Middle column: Equilibrium shape in water at 40oC. Right column: Equilibrium shape in EtOH at x2 = 0.5. Scale bar = 5 mm. ...138 Figure 4.8. Prototype gel actuator that combines internal and external ionoprints. In
water at 40 oC the actuator resembles a Venus flytrap shape. In EtOH at 40 o
C the actuator resembles a pyramid shape. Scale bar = 1 cm. ...139 Figure 5.1. Schematics of the DEP particle assembly and PE gel sheet polymerization
process...153 Figure 5.2. Swelling response of the particle depleted PNIPAAm hydrogel sheets (a)
polymerization) as a function of hydrogel composition. The standard gel is defined as 1.5 M with a crosslinker ratio of 1:100. The errors bars represent the S.D. of three samples. (b) Compressive strain as a function of temperature for the pNIPAAm gel used in this study. The line provides a guide for the eye. The errors bars represent the S.D. of five samples. ...154 Figure 5.3. Effect of colloidal endoskeleton morphology on the hydrogel equilibrium
bending. (a) Schematic illustrating the different modes of latex spheres assembly in hydrated pNIPAAm matrix. (b) The equilibrium shapes of the hydrogels upon increasing the temperature beyond the LCST. (c) Experimental images of the equilibrium configurations of the bent/curled hydrogel. (di) Schematic illustrating UV induced polymerization of the NIPAAm monomer around the latex particles. (dii-div) Fluorescence micrographs showing the field-driven arrangement of particles in the pNIPAAm matrix. The scale bars in (ci-civ) and (d2) correspond to 0.5 mm and 50 µm respectively. The images show isotropic hydrogel shrinking in the absence of the latex particles, whereas in particle embedded hydrogels, the anisotropic bending is determined by the arrangement of the particles in the hydrogel...155 Figure 5.4. Effect of temperature on interparticle spacing and hydrogel bending
particles. The scale bar corresponds to 0.5 mm. The curves provide a guide for the eye...158 Figure 5.5. Micrograph of a PE gel sheet equilibrated in 40 oC methanol. In these
conditions the methanol/pNIPAAm interactions may be preferred to the particle/pNIPAAm interactions causing the gel to swell and leave void spaces around the particles. The arrow is pointing to a void space. Scale bar = 10 µm. ...159 Figure 5.6. Dynamic light scattering results for latex particles in the presence of linear
NIPAAm chains (a) The correlation function vs time for bare particles and particles in the presence of linear NIPAAm chains at 24 oC. (b) The size distribution between bare particles and particles in the presence of linear NIPAAm chains at 24 oC. ...160 Figure 5.7. The bending curvature as a function of the particle volume fraction along
the primary bending axis observed for gel sheets with monolayers of randomly distributed particles...161 Figure 5.8. Diffraction patterns during PE gel sheet shrinking (a) Photographs of the
diffraction patterns during the transition from room temperature to the LCST. (b) Scattering intensity profile of the first peak of an aligned PE gel sheet, ϕ=0.40, as the gel approaches the LCST. The straight lines represent the Gaussian curve fits. (c) The interparticle spacing as a function of time determine from the Gaussian curve fits. The errors bars represent the standard deviation determined from the FWHM. ...163 Figure 5.9. Effect of particle volume fraction on bending curvature at the LCST (a)
Figure 5.10. Scattering intensity profiles as a function of time approaching the LCST. The black data represents the scattering profile parallel to the alignment axis. The blue data represents the scattering profile orthogonal to the alignment axis. ...168 Figure 5.11. Degree of crystallinity as a function of the particle volume density of
various aligned PE gel sheets. There is a distinct shift in the contribution of particles in crystalline domains to the overall scattering intensity profile above ϕ=0.45. ...169 Figure 5.12. Self-reconfiguration of PE hydrogel sheets controlled by the spatial
orientation of particle chains in the hydrogel (a) COMSOL simulations of the electric field distributions, which determine the particle alignment relative to the hydrogel orientation. The corresponding electric field intensity (V/mm) is shown on the left. (b) Micrographs of the equilibrated hydrogel sheets hydrated in water at 24 °C. (c) Micrographs of the hydrogel sheet folding behavior at 33 °C. The scale bar is 1 mm. ...170 Figure 5.13. Design of DEP facilitated soft particle embedded gel sheet from an
emulsion (a) Droplets of Tween 20 stabilized NIPAAm monomer emulsion droplets in a mixture of acrylamide (AAm) and water. The NIPPAm monomer phase separates from the pre-gel mixture when the microchamber setup is heated above the LCST. These droplets aligned into chains under the presence of an AC electric-field. (b) Top down view of the soft particle embedded gel sheet after polymerization at 36 oC. Side view of the gel sheet showing bi directional curling at 36 oC. ...172 Figure 6.1. Hydrogel networks containing both pNIPAAm and pNaAc monomers (a)
CHAPTER 1
General Introduction of Hydrogel Based Actuation by Ion Driven Effects
1.1 Introduction
The main objective of my doctoral research is to utilize electric field driven effects to develop engineered stimuli-responsive hydrogel systems, which sense and change their shape in response to the external environment. Towards this end, this thesis describes new types of hydrogel actuation and patterning techniques. Hydrogels are a form of organic soft matter made of highly hydrated polymer networks. Due to their high water content, hydrogels are often biologically inert and ion-conductive making them a medium well-suited for functionalized soft matter research and applications. The main body of this thesis describes 4 topics: (1) hydrogel walkers based on electro-osmotic actuation, (2) a novel hydrogel patterning technique called ‘ionoprinting’ that is based on crosslinking promoted by electric fields, (3) the extension of ionoprinting to multi-responsive hydrogel bilayers and (4) the use of AC field promoted colloidal assemblies as hydrogel endoskeletons. This chapter provides context for this research by reviewing hydrogel manipulation by directional ionic effect in terms of single component, bilayer, and particle composite gel systems.
1.2 General Hydrogel Background
nature and soft matter research as they are structurally similar to the extracellular matrix of many tissues.1 Furthermore they can manipulate and interface with biological components due to their mostly aqueous, biocompatible nature.2 Hydrogel networks can be composed of naturally derived polymers such as fibrin, collagen, gelatin, starch, hyaluronic acid, alginate and agarose. Alternatively, they can be composed of synthetic polymers from the reaction of monomers such as poly(acrylic acid) (pAA), poly(ethylene glycol) (pEG), poly(vinyl alcohol) (pVA), poly(N-isopropylacrylamide) (pNIPAAm) and their combinations. Polyelectrolyte hydrogels are a subset of hydrogels that contain ionizable moieties, which render the network sensitive to the pH and the ionic strength of the media and provide mobile counterions, which impart conductivity. Figure 1.1. illustrates the structure of an anionic polyelectrolyte hydrogel. The crosslinks that impart hydrogels with their elastic properties can be covalently bound to the polymer chains due to crosslinking reactions, or physically bound due to hydrogen bonding or van der Waals interactions.
The field of stimuli responsive hydrogels has attracted scientific interest since the discovery that hydrogels can exhibit discontinuous volume phase transitions by small variations of external parameters.3–5 Stimuli responsive hydrogels reversibly transduce various environmental stimuli into mechanical motion, especially in aqueous environments, without the use of external mechanical actuation. Examples of external triggers include light, heat, pH, solvent composition, humidity and external fields.6–10 The gel networks can also be functionalized to recognize and respond to specific analytes in solution, enabling the possibility to incorporate actuating, sensing/signaling, transport/release and homeostatic capabilities.11,12 Furthermore, hydrogel networks can be pre-patterned for directional actuation in response to the environment.13–15 The ability to reversibly change volume, interface with biological components and conduct ions enables the use of hydrogels in a tremendous range of applications in the areas of soft actuators and sensors, biomaterials and flexible electronics. In the next section, we will discuss various ways in which ion-induced effects can be directed to manipulate hydrogels towards developing functional, soft matter systems.
1.3 Equilibrium Swelling Behavior
developed for a gel with fixed anionic groups assuming crosslinking in the presence of pure water and a Gaussian chain length distribution between crosslinking points. When a polyelectrolyte gel is submerged in solvent there are three mixing contributions to the total chemical potential of the system:
𝜇1− 𝜇1𝑜 = (∆𝜇
1)𝑚𝑖𝑥+ (∆𝜇1)𝑒𝑙 + (∆𝜇1)𝑖𝑜𝑛 (1.1)
where 𝜇1is the chemical potential of the swelling solvent in the gel/solvent mixture and 𝜇1𝑜 is the chemical potential of the pure solution. At equilibrium, the chemical potential of the solvent, 𝜇1, is equal to the chemical potential of the solvent surrounding the gel, 𝜇1∗ which gives
(∆𝜇1∗)
𝑖𝑜𝑛− (∆𝜇1)𝑖𝑜𝑛 = (∆𝜇1)𝑚𝑖𝑥+ (∆𝜇1)𝑒𝑙 (1.2)
The mixing contribution is derived from the entropy change after mixing, which is typically favorable due to the increased volume accessible to each component and the heat of mixing which is determined by the nature of the polymer/solvent interactions:
(∆𝜇1)𝑚𝑖𝑥 = 𝑅𝑇[ln (1 − ν2,𝑠) + ν2,𝑠+ 𝜒ν2,𝑠2 ] (1.3)
where R is the gas constant, T is the temperature, 𝜒 is the solvent interaction parameter and
ν2,𝑠 is the polymer volume fraction in gel at equilibrium swelling so that 𝑞𝑣 = 1/ν2,𝑠. The
elastic contribution is derived from the statistical theory of rubber elasticity:20
(∆𝜇1)𝑒𝑙= 𝑅𝑇 (υ̅MV1 c ̅̅̅̅) (1 −
2M̅̅̅̅c Mn
̅̅̅̅̅) ν2,r[( ν2,s ν2,r)
1 3 ⁄
−12(ν2,s
ν2,r)] (1.4)
where, 𝑉1 is the molar volume of the solvent, 𝜐̅ is the molar volume of the polymer repeat unit, 𝑀̅̅̅̅𝑐 is the number average molecular weight between crosslinks, 𝑀̅̅̅̅𝑛 is the number
average molecular weight in the absence of crosslinks and 𝜈2,𝑟 is the volume fraction of
interactions, the equilibrium swelling is related to the degree of polymerization, the number of crosslinking reactions and the thermodynamic compatibility of the polymer/solvent system.
Polymer backbones containing ionizable moieties are able to incur much higher swelling ratios due to the osmotic pressure contribution21,22 and the high charge density provides various means to modulate the volume change. Hydrogel networks in ionic solutions incur a chemical gradient between the mobile ions in solution and the mobile counterions within the gel. Donnan equilibrium is established when the chemical gradient between the mobile ions in gel and solution balances the opposing the electrical gradient developed due to charge separation.23 The number of oppositely charged ions on each side of the gel/solution interface remains balanced to maintain electro neutrality within the system. At equilibrium the chemical potential of the ions inside the gel equals the chemical potential of the ions in the external solution. The left hand term of Equation 1.2 is expressed as
(∆𝜇1∗)
𝑖𝑜𝑛− (∆𝜇1)𝑖𝑜𝑛 = 𝑉1𝑅𝑇 ∑ (𝑐𝑗 𝑗− 𝑐𝑗∗), where 𝑐𝑗 and 𝑐𝑗∗are the concentrations of ions of
species j in the gel and external solution, respectively. For an anionic gel, the concentration of positive charges and negatives charges outside the gel and the positive charges within the gel are due to the mobile ions only. The concentration of negative charges within the gel is a sum of the negative mobile ions and ionized moieties on the polymer backbone. The degree of ionization is a function of the sensitivity of the fixed ionic groups to pH where 𝑖 =
( Ka
10−pH+K a) =
[𝑅𝐶𝑂𝑂−]
[𝑅𝐶𝑂𝑂𝐻]+[𝑅𝐶𝑂𝑂−] for a model gel with anionic carboxylic groups. The ionic contribution term for equilibrium swelling is then given as:
(∆𝜇1∗)
𝑖𝑜𝑛− (∆𝜇1)𝑖𝑜𝑛 = 4𝐼𝑀V1 𝑟(
ν2,s2 υ ̅ ) (
Ka 10−pH+K
a) 2
where, I is the ionic strength of the external solution and 𝑀𝑟 is the molecular weight of the polymer repeat unit. This expression shows that the pH relative to the pKa of the polymer chains will affect swelling equilibrium. By combining Equations 1.2-1.5, the equilibrium swelling of an anionic polyelectrolyte hydrogel in solution is given as:
V1
4𝐼𝑀𝑟(
ν2,s2
υ̅ ) (
Ka
10−pH+ K a)
2
= [ln(1 − ν2,s) + ν2,s+ χ1ν2,s2]
+ ( V1 υ
̅M̅̅̅̅c) (1 − 2M̅̅̅̅c
Mn
̅̅̅̅̅) ν2,r[( ν2,s ν2,r)
1 3 ⁄
−12(ν2,s
ν2,r)] (1.6)
Hence, the swelling and conductivity of polyelectrolyte hydrogels is sensitive to the sign and valence of the ionic charges, the concentration of the ionic charges, the pKa of the ionic groups and the external pH and ionic strength of the surrounding medium.
salt solution. The electric field distributes the mobiles ions asymmetrically between the gel and solution, inducing osmotic pressure differences that swell and deform the gel.
Figure 1.2. Electric field driven ion effects. (a) Electro-Osmotic Effect (b) Electrolysis Effect (c) Ionic Binding (d) Ionic Conductivity within Hydrogels (e) Ionic Devices (f) Polyelectrolyte Hydrogel Adhesion
1.4 Electro-Osmotic Effect
mechanism attributes bending to the electric field pulling on the charge groups attached to the gel.4,25 Osada et al. proposed that electrophoretic migration of cations drags water molecules along with them and thereby causes anisotropic contraction.25–27 Section 1.4 describes bending induced by a pH effect caused by electrochemical reactions at the electrodes. Each of these mechanisms would cause an anionic gel to bend toward the anode, which is not the observed phenomena for gels equilibrated in solution.28–34
While these each of these mechanisms may contribute to the bending behavior at longer time steps, for short time steps (t < 5 min) it is generally agreed upon that the main driving force is the ion concentration difference between the inside and outside of the gel at both interfaces.25,31,34,35 Applying an external electric field to an equilibrated anionic hydrogel causes mobile counter cations to migrate preferentially toward the cathode due to the high gel permselectivity (preferential permeation of specific ionic species through hydrated polymer networks) to cations. The counter cations do not leave the gel to maintain electroneutrality.36,37 A higher concentration of mobile ions migrate to the side of the gel closest to the cathode and hence the osmotic pressure at the interface of the gel closest to the anode, 𝜋1, becomes larger than that at the cathode interface, 𝜋2.25,28,31,37,38 The osmotic
contribution from this equilibrium is given by the equation below:
𝜋𝑖𝑜𝑛 = 𝑅𝑇 ∑ (𝑐𝑗− 𝑐𝑗∗)
𝑖 (1.7)
∆𝜋𝑖𝑜𝑛 = 𝜋1− 𝜋2 (1.8)
Figure 1.3. Principles of electro-osmotic gel bending (a) Schematic illustration of the electro-osmotic bending mechanism. The black circle represent the anode side and the white circle cathode side.37 (b) Bending of a polyacrylamide (pAAm) hydrogel with carboxylic groups towards the cathode under application of a DC electric field (8 V/cm).25 (c) Electro-osmotic bending of an anionic gel equilibrated in 0.01 M NaCl and immediately placed in the external salt solution before application of a 5 V/cm electric field. Positive values indicate bending toward the cathode and negative values indicate bending toward the anode. Bending curvature is defined as 1/R.34 (d) Above: Variation of osmotic pressure with external Na+ concentration for various amounts of fixed SO-3 groups. The black arrow (anode side) drops to a lower fixed charge line. The gray arrow (cathode side) jumps to a higher fixed charge line. The switch in osmotic pressure distribution reverses the bending direction. Below: Illustrations of steady state bending conformations for high and low cross-link anionic gels.46
Figure 1.4. Examples of electro-osmotic gel actuators (a) Illustrations depicting the two modes of actuation depending on the direction of the applied electric field. Fc and Fa are the friction force of the cationic leg (dark blue) and anionic leg (light grey) respectively. Photographs of a gel walker in 0.01 M NaCl with an applied field of 5 V/cm.34 Scale bar = 5 mm. (b) Locomotion of ‘octopus’ aquabot under an asymmetric electric field. During the receding phase (7 V), all four tentacles were slowly bent upward, ready to propel. During the propelling phase, the aquabot rapidly moved upward by the propulsion of all four tentacles (15 V).11 Scale bar =1 mm. (c) Example of oil droplet sorting for a gel actuator fixed between two silver electrodes.47 Scale bar = 1 mm.
Kwon et al., developed functionalized microbots, such as the octopus shown in Figure 1.4b, which achieved mean swimming speeds of 0.76 mm/s. Rapid action at the micro scale has bolstered the used of hydrogels as active components in microdevices such as valves45,47, pumps53, and drug delivery devices.54 Lee et al. demonstrated the biocompatibility and rapid response of a hydrogel actuator in a microchannel to sort live cells (Figure 1.4c).47 Small electric fields (2 V/mm) prevented electrolysis and bubble formation and the actuator exceeded a 5 Hz oscillation frequency response. Hydrogels actuated by the electro-osmotic effect have further shown promise as active biomaterials by providing mechanical and electrical cues to enhance the proliferation and differentiation of human mesenchymal stem cells.46
1.5 Electrolysis Effect
Application of 1.2 V (relative to the standard hydrogen electrode, SHE) across an aqueous solution generates the following electrolysis reactions at the electrodes:55
6𝐻2𝑂(𝑙) → 𝑂2(𝑔)+ 4𝐻3𝑂(𝑙)+ + 4𝑒− (anode)
2𝐻2𝑂(𝑙) + 2𝑒− → 𝐻
2(𝑔)+ 2𝑂𝐻− (cathode)
electrostatic repulsion and osmotic pressure. On the side of the gel facing the anode, the fixed charges are protonated (if pH < pKa) and the gel shrinks. The mobility of the hydronium and hydroxide ions and the thickness of the actuator govern the response time, similar to the electro-osmotic effect.25,48,56 In this case however, the ions are not readily available and need to be generated at the electrode first. Unlike the electro-osmotic effect, this mechanism can be triggered both in solution and in air, with the electrodes touching the gel, since only the water in the gel is necessary to induce electrolysis.57,58
during expansion and contraction. Injection of hydrogen ions from the anode protonates the pAAc layer forcing water into the pAAm layer. This results in an actuator that expands in the normal plane and contracts in the parallel plane relative to the electrodes.
Figure 1.5. Principles and applications of electrolysis driven shape change (a) Evolution of pH changes within a hydrolyzed pAAm gel containing carboxylic groups in a 0.1 M KCl solution with universal pH indicator. The pink front represents movement of hydroxide ions and the deep purple front represents movement of hydroxide ions. Widths of the pH fronts plotted against time for both cases. Solid lines represent fits of the pH propagation distance versus time (~t1/2 and ~t, respectively).25 (b) Image of hydrogel grabber using pH responsive gel rods in air.50 (c) Schematic and optical microscope images of pH-responsive gel posts using electrolysis. The top row shows directional actuation using flat posts. The bottom row shows actuation using a honeycomb patterned surface. Left column: contracted hydrogel.
Middle column: transition state hydrogel showing a sharp boundary between the two states.
The pH responsive hydrogels have shown great promise as active components for microfluidic devices. Fast response times (8 sec) have been reported for small gel actuator valves (0.15 mm) in microfluidic systems subject to pumping solutions of various pH.56 The volume change can be controlled more precisely and reversibly by applying electric fields.62 Bio-inspired microscale surfaces containing passive “bone” structures have been created, made of epoxy microposts, surrounded by active “muscle” components composed of a
pNaAc/pAAm copolymer hydrogel.62 The posts bend in one direction, analogous to the asymmetric distribution of actin filaments, which govern unidirectional cellular motion. Placing the micropost substrate in a solution at the pKa of the gel system (pH = 4.25) cause the posts to bend during contraction or stiffen during swelling. Operating near the pKa lowers the amounts of hydronium and hydroxide ions needed to induce shape change. Only small electric fields were required (0.5 V/mm) to fully reverse the pH gradient in a matter of minutes. A similar system was developed inspired by motile ‘cilia’ as shown in Figure 1.5d. The artificial cilium (15 µm thick) could be reversibly shrunk to 89% of their original volume within 4 seconds after contact with the acidic front.48
1.6 Ionic Binding Effects
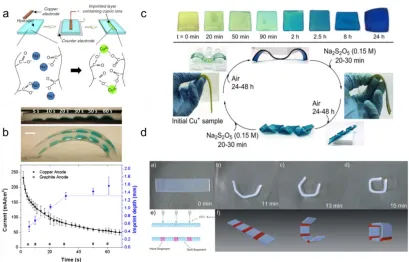
Interesting opportunities arise for patterning, actuation and shape memory devices when the ions present in the solution surrounding the gel are capable of binding to the fixed charges within the hydrogel. Multivalent counterions can affect both the ionic and the mixing contributions to the total swelling free energy. Polyacid interactions with divalent ions can result in complexes which effectively lower the polymer/solvent compatibility leading to gel shrinking24,65 and increased hydrophobicity in the bound region.66,67 Various studies have characterized the binding affinities of alkali earth and transition metals to polyacids.68–72 The binding affinity and degree of complexation are affected by the chemical properties of the metal ion, the charge density and structure of the polymer chains and environmental conditions such as temperature and pH. Generally, the binding of alkaline earth metals to polyanionic gels is completely reversible since the divalent ions only interact with charge sites through Coulombic interactions.24 Transition metals can form robust chelate complexes with polyacidic groups with binding affinity typically decreasing with increasing ionic radius.73,74 Thus, polyelectrolyte hydrogels have shown promise as membranes for toxic metal removal in wastewater sources.71,74–76
Figure 1.6. Principles and applications of ion binding to hydrogels (a) By applying a potential to a patterned Cu anode, Cu2+ ions complex locally with anionic hydrogels.79 (b) Above: Side view of an ionoprinted pNaAc gel at various time steps (5 V). The current determines the amount of copper bound to the hydrated network, which controls the depth of imprinting and degree of gel curvature as a result of ionic crosslinking. Scale bar = 3 mm.
Below: Ionoprinting current and imprinted depth versus time (5 V). The superimposed blue line is only used to guide the eye.79 (c) Above: Conversion of Cu+ doped hydrogels to Cu2+ by oxidation in air. Below: Demonstration of shape memory by shaping the gel and subsequently promoting ionic crosslinking.81 (d) Shape changing of selectively locally annealed acrylonitrile based hydrogel with thickness of 0.5 mm after immersion in 50% ZnCl2 solution.
1.7 Ionic Conductivity within Gels
1.7.1 Ionic Devices
been demonstrated by contacting two agarose gel layers embedded with oppositely charged photosensitive ions.87
Recently, it was demonstrated that hydrogels can be used as stretchable, ionic conductors with operating voltages and frequencies much higher than typically associated with such devices (Figure 1.7d).88 The device consists of two capacitors in series by placing a pAAm gel swollen in NaCl solution in contact with a dielectric (D) and sandwiching them between two electrodes. At the gel/electrode interface, the electric double layer (EDL) behaves as a capacitor; if the voltage is low enough to prevent ions and electrons from crossing the interface and no electrochemical reactions occur. The capacitance across the EDL (nm separation) is much higher than that of the dielectric layer (mm separation). For an applied voltage, the two capacitors add the same amount of charge, cDADVD = cEDLAEDLVEDL, where c is capacitance, A is area and V is voltage. For AEDL/AD ~ 0.01 and cEDL/cD ~ 107, VEDLis very low while VD ~10 kV. This prevents electrochemical reactions at the EDL and enables electromechanical transduction across the dielectric. These devices are optically transparent, and achieve large actuation strains in fractions of a second. While devices with ionic current based operation will not replace conventional electronics, they can potentially function in aqueous environments where regular circuits would be unusable.
1.7.2 Polyelectrolyte hydrogel adhesion
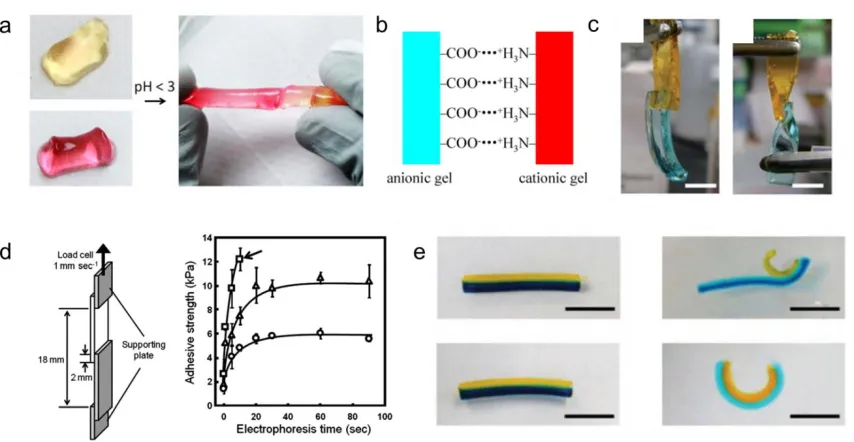
other carboxyl or amide groups across the interface, promoting adhesion. At pH above the pKa, the carboxyl groups deprotonate, the two gels exhibit electrostatic repulsion and separate. Similar gel/gel adhesion effects have been achieved by promoting electrostatic interactions between charged functional groups. Mashelkar et al. demonstrated gel welding between two acryloyl-6-amino caproic acid (A6ACA) based hydrogels using transition metal coordination complexes.67 Tamagawa et al. demonstrated the use of salt linkages between oppositely charged gels containing ionized carboxylic and amine groups to promote gel/gel adhesion and to modulate the hardness of an individual amphoteric gel network containing both functional groups (Figure 1.8b).90,91
Figure 1.8. Examples of electrostatic hydrogel adhesion (a) Ionized acryloyl-6-aminocaproic acid hydrogels at pH=7.4 (left) heal in low pH solution pH < 3 (right).89 (b) Salt-linkages at the interface of anionic and cationic gels.90 (c) Images of samples used to test adhesion strength twisted at 0o and 180o. Anionic and cationic networks are shown in blue and yellow respectively.92 (d) Experimental setup for adhesion strength tests (left). Adhesion strength as a function of applied electric field duration (2.5 V/mm) for gelatin/PGA10 (circle), chitosan10/PGA10 (triangle), and chitosan10/PGA20 (square) gels. The arrow shows where the adhered gels have broken. Abbreviations: chitosan10:gelatin gels containing 10% chitosan; PGA10 and PGA20: gelatin gels containing 10% and 20% sodium poly(g-glutamate), respectively.92 (e) Image of the bilayers at 20 C (left column) and 40 C (right column). Above: The bilayer separates at 40 C. Below: The bilayer has been re-swelled in an ethanol mixture and remains attached at 40 C.95 All scale bars are 4 mm.
1.8 Gel Bilayer Systems
polymerized gel layer.96,97 Li et al., first illustrated the use of modulated gel composites that bend in response to a uniform external stimulus.98 A typical bilayer setup (Figure 1.9a) includes a passive layer, which is unresponsive to the external stimulus, attached to an expanding and or contracting active layer.99 The amount of expansion or contraction the active layer would incur in the absence of the other layer is called the actuation strain.100 The bending strain is the actual strain incurred by the bilayer to minimize its elastic energy. These bilayer systems reversibly transition from 2-D to 3-D structures that can act as self-folding capsules97,101,102, origami structures103 and soft robotic components.96,98,104,105
Ionov et al. developed star-like patterned actuators101 and self-rolling tubes97 composed of polycaprolactone (pCL)-poly(N-isopropylacrylamide) (NIPAAm) bilayers, which reversibly encapsulate/release yeast cells and microparticles in response to a temperature signal (Figure 1.9b). Such actuators could be used to control the activity of microorganisms, such as bacteria and fungi, by determining their accessibility to the external environment or assembling into 3D scaffolds. More recently, the goal of achieving more complex folding structures and “intelligent” response mechanisms has led to the development of trilayer and
Figure 1.9. Examples of multilayer hydrogel actuators (a) Illustration of the response mechanism of a typical bilayer gel actuator in solution.99 (b) Encapsulation of yeast cells by star-like thermo-responsive bilayer actuators.101 (c) Self-folding hydrogel trilayer origami. When the temperature is increased, the hydrogel polymer layer deswells, causing the Randlett’s bird configuration to revert to an unfolded flat sheet.103
(d) Example of a bidirectional hydrogel actuator containing two active layers, which incur different swelling ratios as a function of salt concentration. (e) Schematics illustrating reversible self-folding of a thermo-responsive microgripper. Above 36 °C, the pNIPAMAAc layer excludes water and contracts which, causes the gripper to first open flat and then close such that the PPF segments face outward. Below 36 °C, the active layer absorbs water and then closes in the opposite direction.96
1.9 Gel/Particle Composite Systems
Figure 1.10. Hydrogel/particle systems with directional properties (a) I-V curves for pristine hydrogels (black), random CNTs (red), across the vertically aligned CNTs and along the vertically aligned CNTs (blue). Phase contrast image of vertically aligned CNTs embedded in a methacrylated gelatin hydrogel. Scale bar = = 0 µm. (b) Orthogonal platelet reinforced bilayers removed at a cutting angle of 0 (above) and π /8 (below). Scale bar = 500 µm.117
(c) A glass stage featuring a metal sphere on a tee supported by three cylindrical pillars of magnetically structured hydrogels. The left column contains co-facially oriented repulsive nanosheets parallel to the cylinder cross-section. In the right column, the nanosheets are orthogonal to the cylinder cross-section.118 (d) Schematic of magnetothermal effect for a randomly distributed sample and the aligned magnetic sample in two directions.119
addition to having directionally dependent conductivity, the hydrogels were mechanically reinforced along the vertical chain alignment axis. Studart et al. used weak magnetic fields to align magnetically functionalized Al2O3 platelets in bilayer gels, inspired by the passive, but rigid microstructures found in nature which anisotropically restrict swelling and shrinking.117 In this system, pNIPAAm bilayer gels contained aligned platelets in which the orientation in bottom layer is at a fixed angle relative to the top layer. The orientation of the platelets drives programmable shape change since the gel composite incurs 250% higher swelling and 200% higher shrinkage in the direction perpendicular versus parallel to the reinforcement axes (Figure 1.10b). As opposed to programmable shape change, Aida et al. harnessed electrostatic repulsion interactions between magnetically aligned platelets to create hydrogel composites with mechanical properties analogous to articular cartilage.118 The composite deforms easily under shear forces applied parallel to the embedded titanate nanosheets (TiNS) and resists compressive forces applied orthogonally (Figure 1.10c). Addition of an electrolyte such as Me4NOH screened the internal electrostatic repulsions enabling the separation distance to be tuned according to Debye theory. Gu et al. recently tackled the problem of how to control the heating of hydrogels remotely after they have been implanted inside the body.119 They aligned chains of magnetic nanospheres within pAAm hydrogels in order to enhance the magnetothermal effect induced by applying an alternating magnetic field to the composite. For the magnetic nanoparticles fixed inside the hydrogel, the
magnetothermal behavior is related to the Neel relaxation time given by, 𝜏𝑁 = 𝜏0𝑒𝑥𝑝 𝐾𝑉 𝑘𝑇⁄ ,
two equilibrium positions. The time between the two orientation changes is the Neel relaxation time. The authors found that assembly of microspheres into 1-D chain structures increased the anisotropy constant, K leading to enhanced and directional heating within the hydrogel (Figure 1.10d). New composites by integration of particle assemblies within stimuli responsive gels is a new and exciting research area which can lead to materials with properties not attainable by the individual components.