Research Article
SURFACE RESPONSE METHODOLOGY FOR DEVELOPMENT AND OPTIMIZATION OF
NAPROXEN SUSTAINED RELEASE TABLETS
MOHD ABDUL HADI
1*, MD AZHARUDDIN
1, A SRINIVASA RAO
2, VINAY UMESH RAO
3, Y SIRISHA
1 1*Dept of Pharmaceutics, Bhaskar Pharmacy College, Moinabad, R.R District, Hyderabad-500075, India., 2Dept of Pharmacy Practice,Bhaskar Pharmacy College, Moinabad, R.R District, Hyderabad-500075, India., 3Institute of Pharmaceutical Sciences, PJR Enclave,
Madhavpuri hills, Chandanagar, Hyderabad. Email: [email protected]
Received: 30 October2013,Revised and Accepted: 19November2013
ABSTRACT
Objective: The current work focuses on the development and optimization of Naproxen 800mg sustained release tablets using surface response methodology.
Methods: The drug release was controlled by formulating it into a sustained release tablet. The formulae was developed using various individual concentrations and viscosity grades of HPMC polymers for Naproxen SR tablets. The compatibility of polymers along with pure drug Naproxen was evaluated using FTIR and DSC studies. The tablets were prepared and Pre- and Post-compressional parameters, In-vitro dissolution testing, release rate kinetics and stability studies were evaluated.
Results: The FT-IR and DSC spectras confirms the absence of chemical interaction between drug and polymers. All the Pre-compressional and Post-compressional parameters were found to be in limits. From the dissolution testing of all these formulations the low and high level of polymer concentrations which were within the range of Target product profile was determined. The design space as defined by the above experiments is within 21.3 to 22.8 range of the total polymer concentration. The data for stability studies revealed that no considerable differences in drug content and dissolution rates for a period of 6 months as per ICH guidelines.
Conclusion: Based on the above results, a design space for all the three polymers was successfully developed within which when the tablets are fabricated, the target product profile will always be achieved.
Keywords:Rheumatoid arthritis; Naproxen; Sustained release matrix system; Hydrophilic polymers.
INTRODUCTION
Rheumatoid arthritis (RA) is an autoimmune disease that results in a chronic, systemic inflammatory disorder that may affect many tissues and organs, but principally attacks flexible (synovial) joints. It can be a disabling and painful condition, which can lead to substantial loss of functioning and mobility if not adequately treated [1].
Naproxen is a naphthylpropionic acid derivative. It is the only NSAID presently marketed as a single enantiomer and it is a nonselective COX inhibitor. Naproxen has been proved to be effective in both experimental and clinical pain like rheumatoid arthritis, osteoarthritis, juvenile arthritis and acute gout without any serious cardiovascular or respiratory side effects [2-5]. The drug is lipid soluble, practically insoluble at low pH and freely soluble at high pH. One of the most important commonly used methods for controlling drug release is to form a matrix system with the help of hydrophilic, inert and hydrophobic polymers [6-12].
During the last two decades there has been remarkable increase in interest in sustained release drug delivery system. Such dosage forms are designed to release a drug at a predetermined rate by maintaining a constant drug level for a specific period of time with minimum side effects. There are several advantages of sustained release (SR) drug delivery over conventional dosage forms like improved patient compliance due to less frequent drug administration, reduction of fluctuations in steady state drug levels, maximum utilization of the drug, increased safety margin of potent drug, reduction in healthcare costs through improved therapy, shorter treatment period and less frequency of dosing [13-20].
The design of experiments (DOE) is an efficient procedure for planning experiments so that the data obtained can be analyzed to yield valid and objective conclusions. Whereas, the design space is that established range of process parameters and formulation attributes that have been demonstrated to provide assurance of quality. It forms the linkage between development and
manufacturing design. Thus, Response surface methodology requires minimum experimentation and time proving to be more effective and cost-effective than the conventional methods of formulating sustained release dosage forms [20-23].
Matrix oral SR dosage forms of drugs are widely used to improve drug tolerance or to yield dosing regimen that is to easier to manage for patients. However, production of a SR dosage form that would maintain an effective plasma Naproxen concentration would improve patient compliance. The purpose of this thesis was to optimize a sustained release naproxen dosage form using various viscosity grades of hydrophilic polymers.
MATERIALS AND METHODS
Materials
Naproxen was obtained as a gift sample from IPS Pharma training institute, Hyderabad. HPMC K4M, HPMC K15M and HPMC K100M
were obtained from Astra Zeneca, Bangalore. Lactose,
Microcrystalline cellulose (PH 102), PVP K30 and Magnesium stearate was purchased from Himedia chem. Lab. Mumbai. Aerozil was purchased from Sisco research laboratories Pvt. Ltd. Mumbai. All other materials used were of analytical grade.
Experimental Methods
Excipients compatibility study:FT-IR Studies: FT-IR studies were performed and the spectras were recorded in the wavelength region of 4000 to 400 cm-1. The procedure consisted of dispersing a sample
(drug, polymers and mixture of drug and polymers in KBr and compressing into discs by applying a compaction pressure 400 psi for 2 min in a KBr press. The pellet was placed in the light path and the respective spectrums were obtained.
incompatibilities, because it shows changes in the appearance, Shift of melting endotherms and exotherms, and/or variations in the corresponding enthalpies of reaction. The DSC thermograms of pure drug and its combination with other polymers were recorded. The thermal analysis was performed over a temperature range of 30°C to 350°C.
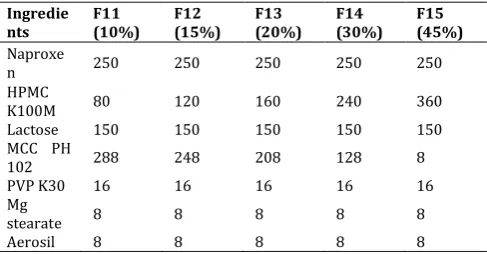
Formulation development of Naproxen sustained release tablets: Tablets of Naproxen were prepared by direct compression method using various viscosity grades of polymers (HPMC K4M, HPMC K15M and HPMC K100M) as matrix forming material (shown in Table 1-7). All ingredients (Drug Naproxen, polymer, Lactose, MCC PH 102, PVP K-30) were passed through a 30 mesh sieve, weighed and blended. These mixtures after separately lubricating with Magnesium stearate and Aerosil were compressed using by using 12 mm concave punches.
Table 1: Formula for preparation of Naproxen SR tablets with HPMC K4M polymer
Table 2: Formula for preparation of Naproxen SR tablets with HPMC K15M polymer
Table 3: Formula for preparation of Naproxen SR tablets with HPMC K100M polymer
To formulate a Naproxen sustained release tablet using surface response methodology, the independent variables chosen were HPMC K4M, HPMC K15M and HPMC K100M in the formulation.The amount of HPMC K4M, HPMC K15M, and HPMC K100M to be taken in the formulation is judged by the results of preliminary studies as shown in tables above.
Design of Experiment (DOE): Based on the above results, a 23 full
factorial design was developed to study the interdependency of the 3 factors HPMC K4M, HPMC K15M and HPMC K100M on the percentage dissolution of Naproxen sustained release tablets in 0.1N HCl and pH 7.4 media.
Table 4: Formulation Design of Critical Process Parameters
Ingredient Low (%) High (%)
X 7 10
Y 7 10
Z 7 10
X=HPMC K4M, Y=HPMC K15M, Z=HPMC K100M
Table 5: 23 Design of Naproxen SR Tablet formulations
Experimental runs X Y Z
Table 6: Formula for Naproxen SR tablet with HPMC K4M, HPMC K15M, HPMC K100M combined polymers using 23 full factorial design
Ingredients F16 (LLL) F17(LLH) F18 (LHL) F19(HLL) F20(LHH) F21(HLH) F22 (HHL) F23(HHH)
Table 7: Formula for three optimized Naproxen SR tablets based on design space
Evaluation of powder blend characteristics [24]: Naproxen powder blend of different formulas from F1to F26 were evaluated for angle of repose, bulk density, tapped density, Hausner ratio, Carr’s index.
Evaluation of tablet characteristics[24]: Naproxen SR tablets for of different formulas from F1to F26 were evaluated for Weight variation, Tablet hardness. Friability and Uniformity of thickness.
drug transferred in 100 ml of pH 7.4 phosphate buffer solution to give a concentration of 100 µg/ml. Take 15 ml of this solution and diluted it up to 100 ml with pH 7.4 phosphate buffer solution to give a concentration of 30 µg/ml. Absorbance measured at 331 nm using UV-Visible spectrophotometer.
In- vitro dissolution studies [25]:Dissolution rate of tablets from all the formulations were performed using Electro-lab dissolution apparatus (USPXXIII) with basket. The dissolution fluid was 750 ml 0.1N Hcl for the initial 2 hours followed by 900ml of 7.4 pH phosphate buffer for the remaining hours. The speed of the basket was 100 rpm and a temperature of 37 ºC were used in each test. Samples of dissolution medium (5ml) were collected through a filler of 0.5μm at different time intervals at set intervals (1, 2, 4, 6, 8, 10, 12, 14, 16, 18, 20, 22 and 24 hrs), and were replaced with equal volume of respective buffer solutions. They were suitably diluted and assayed for Naproxen by measuring absorbance at 331 nm. The dissolution experiments were conducted in triplicate. The content of drug was calculated using the equation generated from standard curve. The % cumulative drug release was calculated.
Treatment of dissolution data with different kinetic equations [26-29]:To analyze the mechanism of release and release rate
kinetics of beads-filled-capsules and capsule-in-a-capsule
formulation, the obtained dissolution data were fitted to Zero order plots (time vs cumulative % drug release), First order plot(Log % drug remaining vs log time), Higuchi matrix plot (cumulative % drug release vs square root of time), and Peppa,s plot (Log cumulative % drug release vs log time). The dissolution data was calculated for R2
values using 2003 MS-Excel software. Based on the obtained R2
values, the best-fit model was selected.
In peppa’s plots, the value of n indicates the drug release mechanism related to the geometrical shape of the delivery system, if the exponent n = 0.5, then the drug release mechanism is Fickanian diffusion. If n < 0.5 the mechanism is quasi-Fickanian diffusion, and 0.5 < n < 1.0, then it is non-Fickanian or anamolous diffusion and when n = 1.0 mechanism is non-Fickanian case ІІ diffusion, n > 1.0 mechanism is non-Fickanian super case ІІ.
Stability studies [30, 31]: In the present study, stability studies were carried out for both at room temperature and accelerated stability conditions. The conditions for storing at room temperature were kept as 30±2 °C and 65±5% RH and for accelerated stability conditions were kept at 40±2 °C and 75±5% RH in a humidity chamber. At regular intervals of time (0, 2, 4 and 6 months) samples were withdrawn and were evaluated for drug content and in-vitro there is no appearance or disappearance of any characteristic peaks of pure drug Naproxen and in the physical mixture which confirms the absence of chemical interaction between drug and polymers.
Peak in pure drug and Functional group: OH- 3189 cm-1, OCH3-3002
cm-1, CH3-2963 cm-1,
C=O- 1727 cm-1.
Peak in physical mixture and Functional group: OH- 3197 cm -1,OCH3-3001 cm-1,CH3-2958 cm-1,C=O- 1727 cm-1.
Figure 1: FTIR spectra of (a) Pure drug Naproxen (b) Naproxen+HPMC K4M+HPMC K15M+HPMC K100M
DSC Studies: In order to confirm the results of FTIR studies, DSC studies were also performed to understand the nature of the drug in the sustained release tablets. DSC curves obtained for pure drug and
optimized formulation were shown in Figure 2. The DSC of
Naproxen shows a sharp endothermic peak at 159.4 0C. Whereas the
thermogram of the physical mixtures of optimized sustained release tablets did not show any significant shift in the endothermic peak as the peak was found at 158.7 0C. Thus, it confirms that the optimized
sustained release tablets formulation is free from any chemical reaction and can be used for its therapeutic purpose.
Figure 2: DSC spectra of (a) Pure drug Naproxen (b) Naproxen+HPMC K4M+HPMC K15M+HPMC K100M
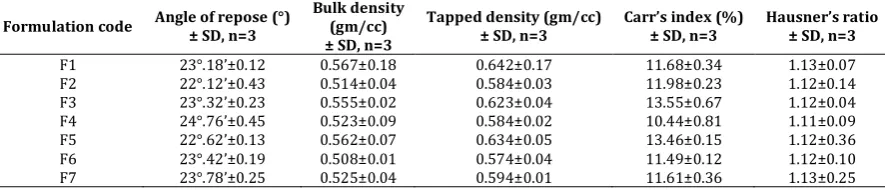
Evaluation of powder blend: Powder blend ready for compression containing drug and various excipients were subjected for pre-compression parameters (Micromeritic properties) to study their flow properties and to achieve uniformity of tablet weight. The results of all the pre-compressional parameters are given Table 8. The angle of repose of all the batches was found to range between 22°.12’ to 24°.83’ which is lesser than 25 and thus the powder blend has excellent flow properties. For all the batches of powder blend, the LBD and TBD was found to range between 0.506 to 0.597 and 0.574 to 0.684 gm/cc respectively. This indicates good packing capacity of the powder blend. The results of Carr’s consolidation index or compressibility index (%) for all the batches of the powder blend were found to range between 10.28±0.42% and 15.06±0.18 % which is lesser than 15 %. Hausner’s ratio of all batches were found to be in the range between 1.11±0.06 to1.17±0.10 which is lesser than 1.25 and thus indicates better flow properties.
Table 8: Results of pre-compressional parameters for Naproxen SR tablets
Formulation code Angle of repose (°) ± SD, n=3
F1 23°.18’±0.12 0.567±0.18 0.642±0.17 11.68±0.34 1.13±0.07
F2 22°.12’±0.43 0.514±0.04 0.584±0.03 11.98±0.23 1.12±0.14
F3 23°.32’±0.23 0.555±0.02 0.623±0.04 13.55±0.67 1.12±0.04
F4 24°.76’±0.45 0.523±0.09 0.584±0.02 10.44±0.81 1.11±0.09
F5 22°.62’±0.13 0.562±0.07 0.634±0.05 13.46±0.15 1.12±0.36
F6 23°.42’±0.19 0.508±0.01 0.574±0.04 11.49±0.12 1.12±0.10
F8 24°.12’±0.27 0.577±0.07 0.654±0.06 12.53±0.42 1.13±0.14
F9 22°.12’±0.15 0.512±0.03 0.594±0.08 10.35±0.18 1.16±0.04
F10 24°.89’±0.56 0.586±0.09 0.659±0.04 12.39±0.25 1.12±0.56
F11 23°.46’±0.54 0.524±0.06 0.594±0.02 11.65±0.11 1.13±0.78
F12 24°.79’±0.36 0.552±0.03 0.627±0.06 11.16±0.20 1.13±0.12
F13 23°.58’±0.53 0.571±0.07 0.637±0.03 10.36±0.31 1.07±0.24
F14 24°.82’±0.51 0.591±0.05 0.684±0.01 13.38±0.27 1.15±0.23
F15 23°.75’±0.49 0.587±0.02 0.674±0.04 12.90±0.41 1.14±0.10
F16 22°.82’±0.47 0.597±0.06 0.669±0.01 10.40±0.12 1.10±0.21
F17 24°.22’±0.52 0.513±0.01 0.584±0.06 12.15±0.37 1.13±0.14
F18 23°.39’±0.53 0.506±0.05 0.564±0.07 10.28±0.16 1.11±0.09
F19 22°.62’±0.48 0.581±0.03 0.654±0.09 10.56±0.21 1.12±0.04
F20 24°.78’±0.18 0.567±0.02 0.644±0.04 11.95±0.36 1.13±0.56
F21 24°.42’±0.53 0.578±0.06 0.649±0.08 10.32±0.25 1.11±0.34
F22 22°.49’±0.50 0.559±0.07 0.624±0.03 10.41±0.28 1.11±0.13
F23 23°.39’±0.51 0.547±0.03 0.644±0.07 15.06±0.18 1.17±0.06
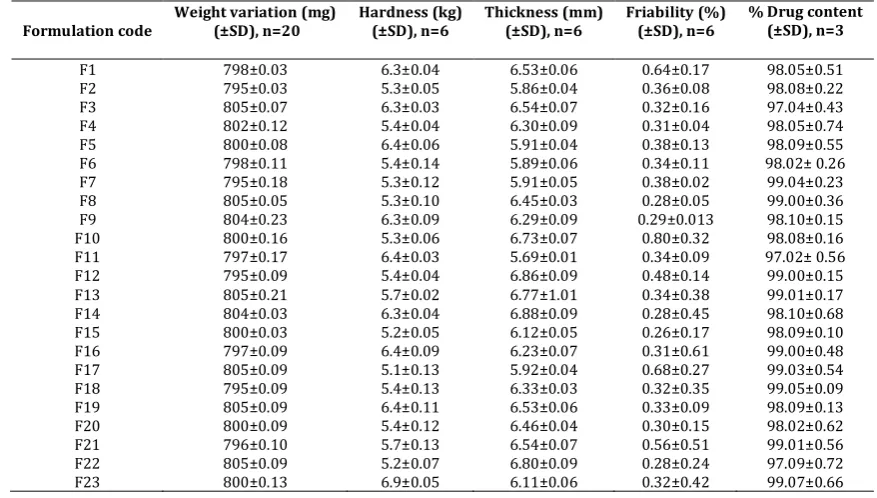
Evaluation of post-compression parameters: The results of all the post-compressional parameters are given Table 9. In the present study, the hardness of all the batches of Naproxen SR tablets were
found to range between 5.1±0.13kg/cm2 and 6.9±0.05kg/cm2
respectively indicating that they possessed sufficient mechanical strengthTablet hardness is not an obsolute indicator of strength. Another measure of tablets strength is friability. The friability of all the batches of Naproxen SR tablets were found to range between 0.26±0.17and 0.80±0.32 respectively. Conventional compressed tablets that loose less than 1 % of their weight are generally considered acceptable. In the present study, percent friability of all the batches was below 1 % limit as shown in the pharmacopoeia indicating that the friability is within the standard limit. It ensures that the Naproxen SR tablets were mechanically stable. The weight variation test was performed according to the procedure given in the pharmacopoeia. In a weight variation test, pharmacopoeial limit for
the percentage deviation of tablets weighing 324 mg or more is ±5 %. The average percentage deviation for all the batches of tablets were found to range between 795±0.18 mg to 805±0.03mg and it was found to be within the pharmacopoeial limits. The weight of all the batches of Naproxen SR tablets was found to be uniform with low standard deviation values indicating efficient mixing of drug and excipient. The uniformity in content could be related to the low weight variation of the core Naproxen SR tablets which could be due to the narrow size distribution and free flowing nature of the pre-compressed blend. The mean thickness (n=6) was almost uniform all the batches and values for all the batches of SR tablets were found to range between 5.69±0.01 to 6.88±0.09 mm. The standard deviation values indicated that all the batches were within the range. The percentage drug content were found to range between 97.04±0.43 to 99.02± 0.66 % of Naproxen for all the batches of Naproxen SR tablets indicating good content uniformity in all the batches.That indicates drug was uniformly distributed throughout the SR-tablets. Table 9: Evaluation of Post-compression parameters of Naproxen SR tablets
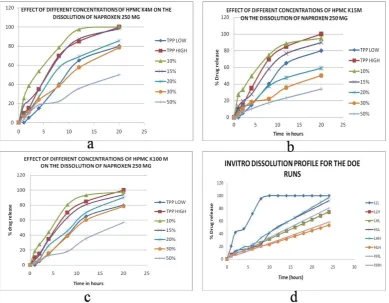
Formulation code When HPMC K4M is used, formulation F3 which has 20% K4M falls within the TPP. Formulations below 20% are faster than the TPP and formulation above 20% are slower than the TPP. The test results are graphically represented in Figure 3. The low and high values of the targeted product profile (TPP) are also shown in Table 10 for the sake of comparison. The release rate kinetics was calculated and the data is shown in Table 11. The rate kinetics followed the Peppa’s model indicating that the drug release follows dissolution limiting kinetics which is very common for poorly water soluble drugs.
Table 10: Low and high values of the targeted product profile
Table 11: Release rate kinetics for Formulation F3
Zero
order Higuchi’s Peppa’s
First-order
Hixson Crowell
Slope 4.35 20.974 0.83 -0.009 0.112
Correlation 0.9635 0.9848 0.9935 -0.9981 0.9923
R 2 0.9283 0.9698 0.9871 0.9961 0.9846
Effect of HPMC K15M on in-vitro dissolution rate of Naproxen: When HPMC K15M is used, formulation F7 which has 15% K15M falls within the TPP. Formulations below 15% are faster than the TPP and formulation above 15% are slower than the TPP. The test results are graphically represented in Figure 3. The release rate kinetics was calculated and the data as shown in Table 12. The rate kinetics followed the Peppas model indicating that the drug release follows dissolution limiting kinetics which is very common for poorly water soluble drugs.
Table 12: Release rate kinetics for Formulation F7
Zero
order Higuchi’s Peppa’s
First-order
Hixson Crowell
Slope 4.733 22.689 0.908 -0.01 0.13
Correlation 0.9632 0.9789 0.9979 -0.9977 0.9928
R 2 0.9277 0.9582 0.9958 0.9954 0.9856
Effect of HPMC K100M on in-vitro dissolution rate of Naproxen: When HPMC K100M is used, formulation F13 which has 20% K100M falls within the TPP. Formulations below 20% are faster than the TPP and formulation above 20% are slower than the TPP. The test
results are graphically represented in Figure 3. The release rate kinetics was calculated and the data as shown in Table 13. The rate kinetics followed the Peppa’s model indicating that the drug release follows dissolution limiting kinetics which is very common for poorly water soluble drugs.
Table 13: Release rate kinetics for Formulation F13
Zero order
Higuc hi’s
Pepp a’s
First-order
Hixson Crowell
Slope 4.997 24.127 1.043 -0.011 0.148
Correlat
ion 0.9549 0.9774 0.995 -0.9984 0.9944
R 2 0.9119 0.9553 0.99 0.9968 0.9889
Based on the dissolution profiles of HPMC K4M, HPMC K15M and HPMC K100M it may be concluded that each polymer gives acceptable dissolution profile only within a very narrow range. From all these individual polymers dissolution testing results, it was found that as the concentration and viscosity grades of HPMC polymers was increasing the release rate of Naproxen from SR Tablets was decreasing.
The effect of combination of three polymers on the in-vitro dissolution profile was evaluated using full factorial 23 design of
experiments. The total of three polymers was evaluated between 21% as low and 30% as high. The DOE chart is given in Table 6. The dissolution profiles for the eight DOE experiments are represented in Figure 3.
Figure 3: Effect of different concentrations of a) HPMC K4M b) HPMC K15M C) HPMC K100M D) Combination of three polmers (HPMC K4M+HPMC K15M+HPMC K100M) on the dissolution profile of Naproxen formulations F1 to F23
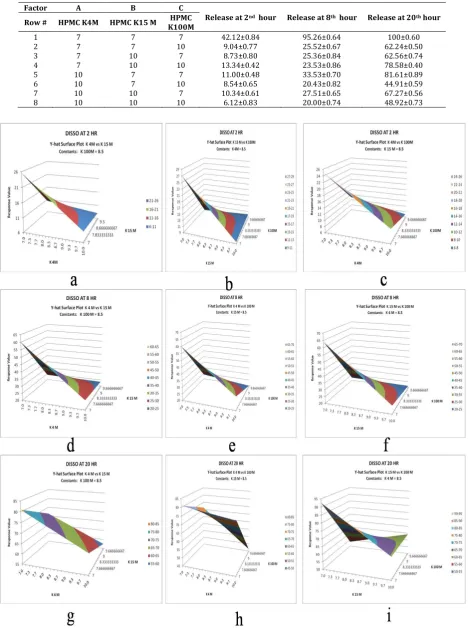
Table 14: DOE Design sheet for the dissolution at 2nd hour, 8th hour and 20th hour
Factor A B C
Release at 2nd hour Release at 8th hour Release at 20th hour
Row # HPMC K4M HPMC K15 M HPMC
K100M
1 7 7 7 42.12±0.84 95.26±0.64 100±0.60
2 7 7 10 9.04±0.77 25.52±0.67 62.24±0.50
3 7 10 7 8.73±0.80 25.36±0.84 62.56±0.74
4 7 10 10 13.34±0.42 23.53±0.86 78.58±0.40
5 10 7 7 11.00±0.48 33.53±0.70 81.61±0.89
6 10 7 10 8.54±0.65 20.43±0.82 44.91±0.59
7 10 10 7 10.34±0.61 27.51±0.65 67.27±0.56
8 10 10 10 6.12±0.83 20.00±0.74 48.92±0.73
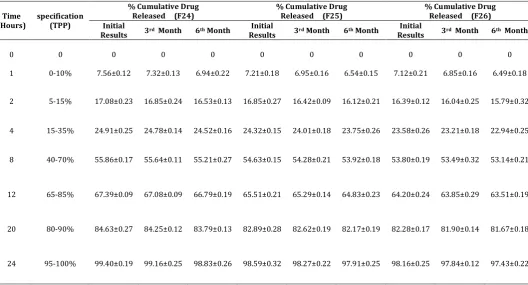
Figure 4: Y-Hat surface plots for a) HPMC K4M Vs HPMC K15M for D2 b) HPMC K15M Vs HPMC K100M for D2 c) HPMC K4M Vs HPMC K100M for D2 d) HPMC K4M Vs HPMC K15M for D8 e) HPMC K15M Vs HPMC K100M for D8 f) HPMC K4M Vs HPMC K100M for D8 g) HPMC
The surface response curves as shown above defined a design space for all the three polymers within which when the tablets are fabricated, the TPP will always be achieved. The focus of this work was to optimize the Naproxen tablets using Design of Experiment. On finding the three Critical Formulation Ingredients or parameters, a 23 experimental design using DOE was run to identify the
interaction between these parameters. A strong correlation was found between these parameters and a design space as shown in Table 15 within which the formulation passes the acceptance criteria for the release of drug was determined.
Table 15: Design Space for the three factors in which the tablets pass acceptance criteria
Polymer Low Level High Level
HPMC K4M 7 7.5
HPMC K15M 7.3 7.8
HPMC K100M 7 7.5
Based on this design space, three batches were fabricated using the concentration of polymers between these low and high level range
as shown in Table 7. These batches were tested for room
temperature and accelerated stability studies. From the dissolution testing of all these three batches it was found their release profile were found to be in the TPP limits as graphically represented in Figure 5.
Figure 5: Dissolution profile of optimized formulations
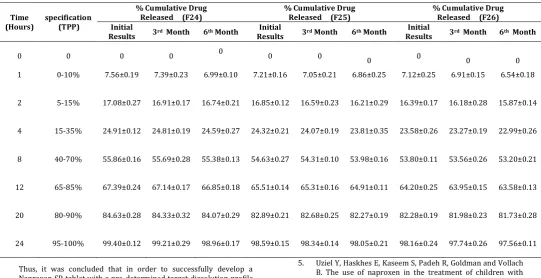
Results of stability testing: Formulation batches F24, F25 and F26 was packed in 90 ml HDPE containers (30s count/container) and charged at both room temperature (30±2 °C and 65±5% RH) and accelerated stability conditions (40±2 °C and 75±5% RH) in a humidity chamber. The tablets were evaluated for assay and dissolution profile testing at 0, 3 and 6 months. The data for stability studies revealed that no considerable differences in drug content and dissolution rates were observed. The results of drug content and dissolution rate after 6 months was given in Tables 16-18.
Table 16: Stability studies: Appearance and drug content for optimized formulations
Parameters
Appearance White circular
tablets
Table 17: Stability studies: Dissolution Profile (At room temperature 30±2 °C and 65±5% RH)
Time
2 5-15% 17.08±0.23 16.85±0.24 16.53±0.13 16.85±0.27 16.42±0.09 16.12±0.21 16.39±0.12 16.04±0.25 15.79±0.32
4 15-35% 24.91±0.25 24.78±0.14 24.52±0.16 24.32±0.15 24.01±0.18 23.75±0.26 23.58±0.26 23.21±0.18 22.94±0.25
8 40-70% 55.86±0.17 55.64±0.11 55.21±0.27 54.63±0.15 54.28±0.21 53.92±0.18 53.80±0.19 53.49±0.32 53.14±0.21
12 65-85% 67.39±0.09 67.08±0.09 66.79±0.19 65.51±0.21 65.29±0.14 64.83±0.23 64.20±0.24 63.85±0.29 63.51±0.19
20 80-90% 84.63±0.27 84.25±0.12 83.79±0.13 82.89±0.28 82.62±0.19 82.17±0.19 82.28±0.17 81.90±0.14 81.67±0.18
24 95-100% 99.40±0.19 99.16±0.25 98.83±0.26 98.59±0.32 98.27±0.22 97.91±0.25 98.16±0.25 97.84±0.12 97.43±0.22
Table 18: Stability studies: Dissolution Profile (At Accelerated stability conditions 40±2 °C and 75±5% RH)
2 5-15% 17.08±0.27 16.91±0.17 16.74±0.21 16.85±0.12 16.59±0.23 16.21±0.29 16.39±0.17 16.18±0.28 15.87±0.14
4 15-35% 24.91±0.12 24.81±0.19 24.59±0.27 24.32±0.21 24.07±0.19 23.81±0.35 23.58±0.26 23.27±0.19 22.99±0.26
8 40-70% 55.86±0.16 55.69±0.28 55.38±0.13 54.63±0.27 54.31±0.10 53.98±0.16 53.80±0.11 53.56±0.26 53.20±0.21
12 65-85% 67.39±0.24 67.14±0.17 66.85±0.18 65.51±0.14 65.31±0.16 64.91±0.11 64.20±0.25 63.95±0.15 63.58±0.13
20 80-90% 84.63±0.28 84.33±0.32 84.07±0.29 82.89±0.21 82.68±0.25 82.27±0.19 82.28±0.19 81.98±0.23 81.73±0.28
24 95-100% 99.40±0.12 99.21±0.29 98.96±0.17 98.59±0.15 98.34±0.14 98.05±0.21 98.16±0.24 97.74±0.26 97.56±0.11
Thus, it was concluded that in order to successfully develop a Naproxen SR tablet with a pre-determined target dissolution profile over 24 hours, surface response methodology provides an excellent tools for optimization of polymer concentration when a combination of polymers is used. The design space as defined by the above determined target dissolution profile over 24 hours, surface response methodology provides an excellent tools for optimization of polymer concentration when a combination of polymers is used. The design space as defined by the above experiments is within 21.3 to 22.8 range of the total polymer concentration.
ACKNOWLEDGMENTS
Authors thanks to IPS Institute, Hyderabad for providing a gift sample of Naproxen. The authors are also thankful to Bhaskar Pharmacy College, R.R.District, Hyderabad and IPS Institute, Hyderabad for providing the research lab facilities to carry out this research work. The authors are very much thankful to the Chairman of JB group of Educational Institutions Sri. J. Bhaskar Rao Garu for his constant help, support and encouragement to the academics generally and research particularly.
REFERENCES
1. Majithia V, Geraci SA. "Rheumatoid arthritis: diagnosis and management". Am. J. Med. 2007: 120 (11); 936–9.
2. Katzung BG. 2004. Basic and Clinical Pharmacology. The
McGraw-Hill Companies, USA, Chapter 36, 9th ed., p. 586.
3. Purushotham Rao K, Prabhashankar, Ashok Kumar B,
Azeemuddin Khan, Biradar SS, Patil Srishail S, Satyanatha. Formulation and Roentgenographic Studies of Naproxen-pectin-based Matrix Tablets for Colon Drug Delivery. Yale J. Bio. med. 2003; 76: 149-154.
4. Reddy KR, Mutalik S, Reddy S. Once-daily sustained release tablets of Nicorandil: Formulation and in-vitro Evaluation. AAPS Pharm .Sci. Tech. 2003: 4(4): 480–488.
5. Uziel Y, Haskhes E, Kaseem S, Padeh R, Goldman and Vollach
B. The use of naproxen in the treatment of children with rheumatic fever. J. Pediatr. 2000: 137; 269-271.
6. Sarfraz MK, Rehman N, Ahmed S, Ashraf M, Mohsin S. Ethyl Cellulose based solid matrix system for sustaining release of Naproxen. Pak. J. Biol. Sci. 2007: 10; 668-672.
7. Brabander CDE, Varyaet C, Fiermans L, Remons JP. Matrix mini-tablets based on starch/micro crystalline wax mixtures. Int. J. Pharm. 2000; 199: 195-203.
8. Bhupendra Prajapati G, Patel Krunal R. Design and in-vitro evaluation of Nicorandil sustained release matrix tablets based on combination of hydrophilic and hydrophobic matrix system. Int. J. Pharm. Sci. Rev. and Res. 2010; 1: 33-38.
9. Bhattacharya Sampad, Kshir Sagar Rajesh, Josh Mayank,
Pandita Sandeep. Extended-release coated mini-tablets of venlafaxine hydrochloride. Eur. Patent Office, Publication No. 1711169 (X1), Publication date: 2006-10-18.
10. Follonier N, Doelker E. Biopharmaceutical comparison of
oral multiple unit and single unit sustained release dosage forms 1992; S.T.P. Pharm. Sci. 2: 141-158.
11. Clancy MJA, Cumming K. Sustained release cisapride mini-tablet formulation 1998; WO Patent WO.9829095, 9 July: 241-248.
12. Mishra B, Bansal A and Sankar C. Development and in-vitro evaluation of hydrophilic matrix tablets of diltiazem HCl. Acta Pharmaceutica Turcica. 2005: 47; 115-126.
13. Sampath Kumar KP, Debjit Bhowmik, Chiranjib, Margret
Chandira, Tripathi KK. Innovatons in sustained release drug delivery system and its market opportunities. J. Chem. Pharm. Res. 2010; 2(1): 349-360.
14. Rakesh Patel, Ashok Baria. Formulation development
process optimization of Theophylline sustained release market tablet. Int. J. Pharm. and Pharm. Sci. 2009; 1(2): 30-42.
15. Varahala Setti ML, Vijaya Ratna J. Preparation and evaluation
of controlled-release tablets of carvedilol. Asian J. Pharm. 2009; 3: 252-256.
16. Mayuri B, Madhu Nicholas E, Manjunath SY, Subal Debnath. Formulation and evaluation of Ranolazine extended release tablets. J. Chem. and Pharm. Res. 2010; 2(5): 555-561,
17. Mako to Ishida, Keichi Abe, Marora Hashezime. A novel
approach to Sustained Pseudoephedrine release-
18. Goole J, Deleuze PH, Vanderbist F, and Amighi K. New levodopa sustained release of floating mini-tablets coated with insoluble acrylic polymer. Eur. J. Pharm. and Biopharm. 2008; 68: 310-318.
19. Subramaniam Kannan, Rangaswamy Manivannan.
Formulation and evaluation of sustained release tablets of aceclofenac using hydrophilic matrix system. Int. J. Pharmtech Res. 2010; 2(3): 1775-1780.
20. Lakade SH, and Bhalekar MR. Formulation and evaluation of
sustained release matrix tablet of anti-anginal drug, influence of combination of hydrophobic and hydrophilic matrix former. Res. J. Pharm. and Tech. 2008; 1 (4): 410-413.
21.
www.fda.gov/OHRMS/DOCKETS/98fr/07d-0493-gdl0001.pdf
22. Design Space and PAT - Q8 ICH Draft Guidance on
Pharmaceutical Development by M. Kovalycsik, AVP, Wyeth Research Vaccines R&D, Quality Operations.
23. Uttam mandal, Veeran gowda, Animesh ghosh, Senthamil
selvan, Sam solomon, Tapan kumar pal. Formulation and optimization of sustained release matrix tablet of Metformin Hcl 500 mg using surface response methodology. Yakugaku zasshi. 2007; 127(8): 1281-1290.
24. Leon Lachman, Herbert Lieberman A. The theory and
practice of industrial pharmacy. Special Indian edition 2009: 293-373.
25. Evans DF, Pye G, Bramley R, Clark AG, Dyson TJ, Hardcastle
JD. Measurementof gastrointestinal pH profiles in normal
ambulant human subjects.Gut 1988; 29: 1035-1041.
26. Londhe S, Gattani S, Surana S. Development of floating drug delivery system with biphasic rrelease for Verapamil hydrochloride: In-vitro and In-vivo evaluation. J. Pharm. Sci. and Tech.2010; 2 (11): 361-367.
27. Varahala Setti ML, Vijaya Ratna J. Preparation and evaluation
of controlled-release tablets of carvedilol. Asian J. Pharm. 2009; 3: 252-256.
28. Harris Shoaib M, Jaweria Tazeen, Hamid Merchant A, and Rabia Ismail Yousuf. Evaluation of drug release kinetics from ibuprofen matrix tablets using HPMC. Pak. J. Pharm. Sci. 2006, 19 (2), 119-124.
29. Higuchi T. Mechanism of sustained action medication.
Theoretical analysis of release rate of solid drugs dispersed in solid matrices. J Pharm Sci. (1963); 52: 1145-1149.
30. ICH Guidelines. Stability testing of new drug substances and
products, 2003. Q1A(R2) Step 4 version. Available at: http://www.ich.org/cache/compo/363-272-html#Q1C http://www.isppharmaceuticals.com/
Literature/ISPPH5951_Advantia_Perf_Case_Study_VF .pdf 31. Cha J, Gilmor T, Lane P, Ranweiler JS. Stability studies in