Clustering Related Terms with Definitions
Scott Piao, John McNaught and Sophia Ananiadou
National Centre for Text Mining School of Computer Science The University of Manchester
Manchester United Kingdom
{scott.piao, john.mcnaught, sophia.ananiadou}@manchester.ac.uk
Abstract
It is a challenging task to match similar or related terms/expressions in NLP and Text Mining applications. Two typical areas in need for such work are terminology and ontology constructions, where terms and concepts are extracted and organized into certain structures with various semantic relations. In the EU BOOTSTrep Project we test various techniques for matching terms that can assist human domain experts in building and enriching ontologies. This paper reports on a work in which we evaluated a text comparing and clustering tool for this task. Particularly, we explore the feasibility of matching related terms with their definitions. Ontology terms, such as Gene Ontology terms, are often assigned with detailed definitions, which provide a fundamental information source for detecting relations between terms. Here we focus on the exploitation of term definitions for the term matching task. Our experiment shows that the tool is capable of grouping many related terms using their definitions.
1.
Introduction
It is an important and challenging task to match similar or related terms/expressions in NLP and Text Mining applications. For example, we often need to map terms and expressions conveying similar meanings and referring to the same subjects, or collect terms which are subject to various semantic relations, such as hyponymy (meaning inclusion) and meronomy (part vs. whole). Two typical areas in need for such work are terminology and ontology construction, where terms and concepts are extracted and organized into certain structures according to a variety of semantic relations (Bodenreider, 2006). In the EC BOOTStrep Project1, in which one of the aims is to build a biological knowledge base, various techniques are tested for matching related ontology terms.
This paper reports on our work in which we evaluate a text comparing and clustering package for this task. We explore the feasibility of automatically suggesting candidate related terms for human experts by comparing related terms with their definitions and grouping similar terms by their similarity. Ontology terms, such as Gene Ontology (GO)2 terms, often have detailed definitions assigned to them. The definitions provide a fundamental information source for detecting relations between terms. Therefore, in our experiment, we focus on the exploitation of term definitions for the term matching task.
In fact, lexicon definitions have been previously used for analyzing relations between words/terms. For example,
1 See website: http://www.BOOTStrep.org. 2 See website: http://www.geneontology.org.
Castillo et al. (2003) reported on semantic clustering of words based on word definitions. They identify substitutable words by aligning word definitions from different sources. Malaisé et al. (2004) extracted definitions from a corpus which in turn are used for detecting synonymy and hyponymy relations between terms. Distinct from previous work, we aim to group related biological terms using definitions provided by terminology and ontology resources.
While we are aware of a variety of ontology term matching approaches and techniques (Euzenat and Shvaiko, 2007), here we focus on the term definitions as the information source. Our interest in the definitions stems from our observation that the definitions of many closely related biological ontological terms share a certain levels of similarity, as demonstrated by the following GO sample terms:
id: GO:0000124 name: SAGA complex
def: "A large multiprotein complex that possesses histone acetyltransferase and is involved in regulation of transcription. The budding yeast complex includes Gcn5p, several proteins of the Spt and Ada families, and several TBP-associate proteins (TAFs); analogous complexes in other species have analogous compositions, and usually contain homologs of the yeast proteins."
id: GO:0005671
name: Ada2/Gcn5/Ada3 transcription activator
def: "A multiprotein complex that possesses histone acetyltransferase and is involved in regulation of transcription. The budding yeast complex includes Gcn5p, two proteins of the Ada family, and two TBP-associate proteins (TAFs); analogous complexes in other species have analogous compositions, and usually contain homologs of the yeast proteins."
Sample 1: Synonymous GO terms
In the above samples, these terms have rather different names, but their definitions provide sufficient information for linking them together. In a scenario where only term variants and definitions (either extracted from a corpus or provided by lexicons) are available, the definitions can become the main or sole source of information for structuring the terms.
We tested the tool on 2,010 terms from the GO controlled vocabulary under the namespace of “cellular_component”, which carry definitions. Our experiment showed an encouraging result. Foe example, when the tightly clustered groups are checked, the tool obtained precisions ranging between 76.09%~96.90%, depending on strict and relaxed definitions of relatedness, with 41.49%~52.84 coverage of the test terms.
2.
Definition-based distance measurement
and term clustering
The tool under evaluation was originally designed for the text clustering purpose (Piao and McEnery, 2003). The main function of it is to group texts which contain similar or related contents. It first searches for and maps similar sentences across a pair of texts under consideration, then estimate the distance between the texts based on the mapped sentences. It has a graphical user interface for observing and analysing the result. It is modified to suit the purpose of term matching.
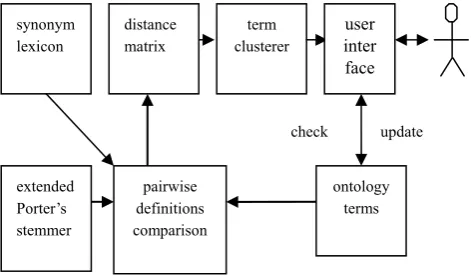
Currently it consists of three main components: a) a component for pairwise text comparison; b) a hierarchical clusterer; and c) a GUI for displaying, checking and updating. Fig. 1 illustrates the outline of this package.
Fig. 1: Outline of terms comparing and clustering package.
2.1. Measuring distances between definitions
The core component of the tool is a text similarity/distance measurer. In our particular context, the definitions of the terms are the texts to be compared. The algorithm of this component proceeds as follows. For a pair of input texts T1 and T2, they are first broken down into sentences. Next, the sentences are compared across T1 and T2 to detect similar sentences. Finally, the distance between T1 and T2 is calculated based on the matched sentences and the levels of their similarity.
Generally we need to clear noises for efficient text matching, which are often caused by morphological variants and synonyms. In this tool, three approaches are used to reduce the noises. Firstly, in order to normalise the inflectional variants, an extended Porter’s English Stemmer (Porter, 1980) is used. The original Porter’s Stemmer cannot handle irregular inflectional variants, such as child Æ children or go Æ went etc. It was
extended to deal with the frequently occurring irregular English inflections. In addition, a stop word list is used to exclude omnipresent function words from the matching process. However, sometimes function words can be parts of multiword expressions, thus the stop words are only used to filter single-word matches while leaving those embedded within matched word sequences.
Furthermore, in order to bridge the synonyms, a synonym list (about 46,000 entries) is extracted from the WordNet3 and all of the words in it are stemmed with the Porter’s stemmer, as show below:
<nyctalopia><night blind><moon blind> <nuclear><atom>
<nucleolu><nucleol> <nucleoplasm><karyoplasm> <nucleus><cell nucleus>
For example, in the first entry of the sample contains three synonymous expressions “nyctalopia”, “night blind” and “moon blind”. Of them, the first expression is used with more technical sense. Because the words are stemmed, synonyms can be looked up with stemmed forms.
This synonym list mostly contains generic words, although it contains some technical terms. Therefore, it is aimed to be used for detecting general expressions occurring in the text rather than matching technical synonyms. We assume domain-specific synonym lists can boost the performance of the tool, although it remains to be tested.
pairwise definitions comparison
term clusterer
user inter face
ontology terms check update synonym
lexicon
extended Porter’s stemmer
distance matrix
When comparing texts, we sometimes come across orthographical variants. In technical documents, many technical terms may have spelling variants, resulting from difference writing practices of different research communities. To detect such variants, the bigram based
Dice coefficient is used. Derived form Dice’s work (1945), it is calculated as follows. Given a pair of words w1 and w2, the letters they contain are broken into digrams, each of which contain two adjacent letters. Next, the number of digrams shared between w1 and w2 is counted. If let l1 and l2 be the numbers of bigrams contained in w1 and w2 respectively, and k be the number of shared digrams, then Dice coefficient is calculated as shown below:
(1)
2 1
2 l l
k d
+ ×
= (0 <= d <= 1).
A greater d-score indicates a greater similarity.
With respect to the sentence matching, after the input texts are split into sentences, for each candidate pair of related sentences X and Y, single word and n-gram (in this paper, n-gram refers to word sequence) matches are searched to produce three basic scores: psd, dc and psng:
(2)
2
m l l psd= sw+ ng
(3)
(
)
2 1
2 m m
l l
dc sw ng
+ + ×
= (Dice score),
(4)
ng sw
ng l l
l psng
+
= ,
where
a) lsw denotes the number of matched single words,
including identical words, inflectional variants, synonyms and orthographical variants;
b) lng denotes the length (number of tokens) of matched
word n-grams;
c) m1 and m2 denote the lengths (number of tokens) of X
and Y respectively.
All the three scores range between 0 and 1 inclusive. Each of them reflects a different aspect of the relationship between the sentences. Firstly, psd-score indicates the extent to which X is dependent on Y. If psd=1, every word in X can be matched to Y. Next, dc reflects mutual dependency between X and Y. Finally, psng denotes the proportion of the n-grams among the matched items. Assuming that n-grams are a stronger indicator of similarity than single words, given the same number of matched words, a greater psng-score indicates a closer similarity.
Based on the basic scores, the distance between X and Y is calculated as follows:
(5) ws=δ1psd+δ2dice+δ3psng,
(0<= ws<=1; δ1+δ2+δ3=1),
where δ1 , δ2 and δ3 are weighting parameters. These parameters indicate the proportions of contribution of the three basic scores towards ws-score. The parameters were estimated on the manually annotated section of the METER Corpus (Gaizauskas et al., 2001), in which the related texts are manually identified by an expert, obtaining the optimal parameters of δ1 = 0.85, δ2 = 0.05 and δ3 = 0.1. Obviously, it would be ideal to use training data from the Biology domain,, from which domain the test data is from. But such data was not available for this work at the moment. Meanwhile, although the training corpus is from a domain (newspaper reports on law and court) quite different from the application domain of Biology, the writing style of the definitions is not much different from that of formal journalistic reports, except the terminology used. Therefore, we assumed that the parameters are by and large applicable to our test data.
With the matched sentences, the distance between input texts T1 and T2 is quantified as follows:
(6)
l
ws
ls
d
=
∑
(
i×
i)
, (0 <= d <= 1).
where lsi denotes the length of the ith matched sentence in T1, wsi denotes ws-score for the ith sentence in T1, and l
denotes the length of T1.
As shown, d-score is not symmetrical for T1 and T2 but biased towards T1. In other words, given the input texts T1 and T2, it is possible that d-score(T1, T2) ≠d-score (T2, T1). In fact, such a bias of the score has its advantage. For example, it can be used to detect inclusive relation between similar texts, which is beyond the scope of this paper).
2.2. Clustering terms
As we mentioned earlier, our aim is to automatically suggest terms that are potentially related. An effective way of doing it is to group the candidate related terms via clustering. The text comparing component described previously is used to create a distance matrix.
For a given collection of texts (term definitions, in our particular case), each text is compared with all others to create a matrix whose element eij takes the value of
(7) eij =1 – dij, (0<=eij<=1)
where dij is the distance score for the ith and jth texts. A
smaller eij-value indicates a closer distance between texts,
with a zero score meaning identical.
calculated as follows:
(8) ∑ ∑ ∑
(
)
⎥⎦⎤ ⎢⎣
⎡ −
=
= clusters
clusterswithin p
k xik xk ESS
1
2
where xk denotes the mean value of the kth variables of all
the entries within a cluster. The ESS value increases as the clusters become less tight. A hard clustering approach is adopted and therefore each term is assigned to only one cluster. For the bottom layer of clusters, a distance threshold of eij=0.9 is used to filter out too loose clusters.
2.3. User interface
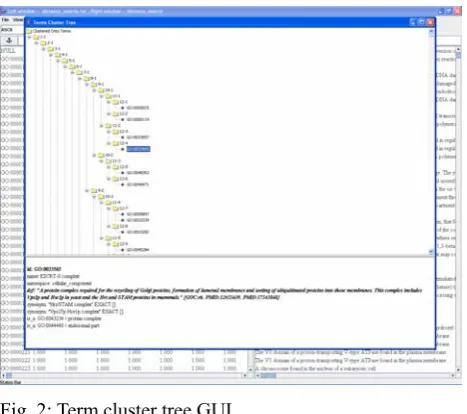
In addition to the text comparison and clustering package, a graphical user interface has been under development to assist human users to browse and check the clustered terms and update the terms. Fig. 2 below illustrates the current version of the interface.
Fig. 2: Term cluster tree GUI.
As shown in the figure, the terms in the cluster tree are linked to a terminology database (GO database in this particular case), so the users can access the term entries in the database by clicking on the term icons on the graphical tree. This interface supports users to conveniently check the clustered terms and update the term entries if/when they find new relations between them.
3.
Evaluation
As we mentioned earlier, we used a collection of Gene Ontology (GO) terms as our test data. Gene Ontology provides a controlled vocabulary regarding gene products. It contains three main super categories (or namespaces): biological processes, cellular components and molecular functions. The GO terms are labeled with one of the three categories and they are associated via two relationships: IS_A and PART_OF. Havinf been manually analysed and annotated, these terms provide good test data for term matching tools.
As our test data, we selected those GO terms under the namespace of “cellular_component”. The main reason for
choosing them was their manageable size. At the time when we carried out this experiment, the latest version of GO (2007) we obtained contained 2,027 “cellular_component” terms in the entire vocabulary. we found that, of them, 2,010 carry definitions and they formed our actual test data.
Our main purpose of this evaluation is to test the capability of the tool for suggesting related terms based on their definitions. Our evaluation strategy is to examine:
a) How many clustered terms have such relations, and b) How many of the related terms can be covered by the
clusters.
In our experiment, we used the following categories in the evaluation. We consider two or more GO terms to be related if they:
1) share a parent term within three layers of ancestor trees via IS_A relation, or
2) have direct parent/child relations (e.g. X is_a Y), or
3) have direct part-of relations (e.g. X is part of Y).
We found that all of the 2,010 test terms have one or more relations defined above with one or more other test terms.
When we processed the 2,010 terms with the text comparing and clustering package, it clustered the terms into 12 hierarchical layers. In such hierarchical clustering, the bottom layer is expected to contain the tightest clusters (i.e. closely related terms) and, as we ascend through the layers, the clusters would become looser, or they contain terms that are remotely related. As we aim to produce candidate terms that have reasonably strong relations, we are interested in the terms clustered in lower layers. In practice, we considered terms contained within three bottom cluster layers.
With regard to the precision, we focused on examining how many related terms are grouped into the same clusters. For the clusters in the bottom layer, each of which only contains one or two terms, first the mono-term clusters were filtered out, and then we checked whether or not the two terms contained in the remaining clusters are subject to any one of the three relations: IS_A, PART_OF and SHARE_PARENT. When it comes to the second and third bottom layers, because the clusters may contain more then two terms, we used a slightly different evaluation approach: if a term in a cluster is related to any one of the terms within the same cluster, we consider this term to be correctly clustered. Due to the multiple inheritance relations among GO terms, it is difficult to calculate recall. Therefore, we used the measure of coverage to estimate how many of the test terms the tool can cluster together with at least one related term.
checking revealed that, all together, this layer contains 548 clusters containing term pairs (mono-term clusters were ignored), or 1,076 terms. Of them, we found that 417 clustered term pairs (76.09%) share a direct parent node, 489 pairs (89.23%) share a parent within two parent tree nodes, and 531 pairs (96.90%) share a parent node within three parent tree nodes. All these figures include those having IS_A and PART_OF relations. Our examination also yielded coverage percentages of 41.49%, 48.66% and 52.84% corresponding to one, two and three layers of ancestor trees. Table 1 below shows the evaluation statistics.
considered_cluster_layers=1; total_clustered_terms=1,076 depths of
parent nodes considered
clustered true pairs precision (%)
coverage (%)
1 417 (834 terms) 76.09 41.49 2 489 (978 terms) 89.23 48.66 3 531 (1,062 terms) 96.90 52.84
Table 1: Evaluation statistics for the bottom cluster layer.
Our examination of errors showed that, while many errors were caused because the tool failed to identify some related definitions due to their surface differences, some other errors occurred because some remotely related terms have very similar definitions. For example, a pair of terms with IDs of GO:0031233 and GO:0031243 are remotely related, without sharing direct parent node and having neither IS_A nor PART_OF relation. When only the bottom cluster layer is considered in the evaluation, they are treated as unrelated terms. But they have very similar definitions, as shown below:
id: GO:0031233
def: "Located in the plasma membrane such that some covalently attached portion of the gene product spans or is embedded in one or both leaflets of the membrane, with the bulk of the gene product located on the side opposite to the side that faces the cytoplasm."
id: GO:0031243
def: "Located in the outer membrane of the cell such that some covalently attached portion of the gene product spans or is embedded in one or both leaflets of the membrane, with the bulk of the gene product located on the side opposite to the side that faces the periplasm."
As a result, the distance score the tool produced for them is 0.043, which implies a very close relation, and so they are paired together into a cluster at the tightest level. In this particular case, the key difference between the definitions arises from the different concepts of the biological terms plasma vs. outer and cytoplasm vs. periplasm. To address such problems, the tool needs to be
able to identify the technical terms and weigh the distance score with the semantic difference between the technical
terms. Currently the tool lacks such a function and is incapable of dealing with such cases.
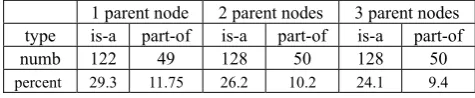
When we examined the relation types of IS_A and PART_OF included in the clustered terms, we found many more former type are covered compared with the latter one. Table 2 shows the breakdown by the relation types for the three ranges of parent nodes considered. In the table, the percentages are calculated using the corresponding numbers of true clusters (refer to the first column of Table 1).
1 parent node 2 parent nodes 3 parent nodes type is-a part-of is-a part-of is-a part-of
numb 122 49 128 50 128 50
percent 29.3 11.75 26.2 10.2 24.1 9.4
Table 2: Breakdown by IS_A and PART_OF relation types for the bottom layer clusters.
A possible explanation of the result shown in Table 1 is that, compared to the PART_OF type, the terms subject to IS_A relation may have more similar definitions and hence can be more easily detected by text comparison tools.
In order to examine the impact of the different cluster layer levels on the performance of the tool, we did the similar evaluations for the second and third layers of the cluster tree. For the second and third bottom layers of the cluster tree. 731 and 366 clusters were found respectively, both containing all of the 2,010 test terms. Tables 3 and 4 show the evaluation statistics respectively. Note that the coverage is not separately listed from the precision in these two tables. This is because the second and third layers of the cluster tree contain all of the test data terms (2,010), and therefore the corresponding precision and coverage measures have identical values.
considered_cluster_layer=2; total_clustered_terms=2,010 cluster
layers
correctly clustered terms
precision/coverage (%)
1 1,163 57.86
2 1,474 73,33
3 1,685 83,83
Table 3: Evaluation statistics for the second bottom cluster layer.
considered_cluster_layer=3; total_clustered_terms=2,010 cluster
layers
correctly clustered terms
precision/coverage (%)
1 1,284 63.88
2 1,642 81.69
3 1,843 91.69
A comparison between Tables 1 and 3 shows that, as a higher cluster layer is considered, the precision drops while the coverage increases for all the three layers of ancestor trees under consideration. Table 4, or the third layer breaks this trend, mainly because the clusters in the second layer (refer to Table 3) already contain all of the test terms, and therefore no additional terms are added in the third layer.
4.
Conclusion
In this paper, we have presented our work in which we tested a text comparison and clustering package for automatically suggesting related biological terms based on their definitions. We argued that definitions of biological terminology, such as Gene Ontology terms, provide a fundamental information source for detecting relations between the terms. Because the biological term definitions are generally in the form of natural language text, although often loaded with domain technical terms, with some adaptation, a generic text comparison tool can be applied for detecting and analyzing relations between biological terms. Although not conclusive yet, our experiment has shown encouraging results, demonstrating the feasibility of achieving it. Meanwhile, our experiment also shows that, in order to efficiently process text in the biological domain, a generic tool need to be enhanced with domain knowledge.
5.
Acknowledgements
This research was supported by EC BOOTStrep Project (ref. FP6-028099). The UK National Centre for Text Mining is sponsored by the JISC/BBSRC/EPSRC.
6.
References
Bodenreider, Olivier (2006). Lexical, terminological, and ontological resources for Biological text mining. In S. Ananiadou and J. McNaught (eds.). Text Mining for Biology and Biomedicine, Artech House, U.S.
Castillo, Gabriel, Gerardo Sierra, John McNaught (2003). An improved Algorithm for Semantic Clustering. Proceedings of the 1st international symposium on Information and communication technologies, Dublin. Dice, L.R. (1945). Measuring of the amount of Ecologic
association between species. Geology (26), pp. 297-302.
Euzenat, Jérôme and Pavel Shvaiko (2007). Ontology Matching. Springer-Verlag, Berlin Heidelberg Germany.
Gaizauskas, Robert, Jonathan Foster, Yorick Wilks, John Arundel, Paul Clough, and Scott Piao (2001). The METER Corpus: a corpus for analysing journalistic text reuse. Proceedings of Corpus Linguistic 2001, Lancaster, UK.
Malaisé, Véronique, Pierre Zweigenbaum and Bruno Bachimont (2004). Detecting semantic relations between terms in definitions. COLING 2004 CompuTerm 2004: the 3rd International Workshop on Computational Terminology, Geneva.
Piao, Scott and Tony McEnery (2003). A tool for text
comparison. Proceedings of the Corpus Linguistics 2003, Lancaster, UK.
Porter, M.F. (1980). An algorithm for suffix stripping. Program, 14(3).
Wang, H, F. Azuaje, O. Bodenreider, J. Dopazo (2004). Gene expression correlation and Gene Ontology-based similarity: an assessment of quantitative relationships. Proceedings of IEEE Symposium on Computational Intelligence in Bioinformatics and Computational Biology.
Ward, Joe (1963). Hierarchical Grouping to Optimize an Objective Function, Journal of the American Statistical Association, 58(301).
Appendix: Sample of term cluster Tree
Below is a sample of the plain text version of the term cluster tree, which can be displayed as a graphical tree using the GUI shown in Fig. 2.{layer=1 {layer=2 {layer=3 {layer=4 {layer=5 {layer=6 {layer=7 {layer=8 {layer=9 {layer=10 {layer=11
{layer=12 GO:0000015 } {layer=12 GO:0000119 } }
{layer=11
{layer=12 GO:0033557 } {layer=12 GO:0033565 } }
} {layer=10 {layer=11
{layer=12 GO:0048353 } {layer=12 GO:0048471 } }
} } {layer=9 {layer=10 {layer=11
{layer=12 GO:0009897 GO:0010339 } {layer=12 GO:0010282 }
} {layer=11
{layer=12 GO:0045284 } {layer=12 GO:0045293 } }
} {layer=10 {layer=11
{layer=12 GO:0017117 GO:0033202 } {layer=12 GO:0017119 }
} {layer=11
{layer=12 GO:0017177 } }
} } } {layer=8 {layer=9 {layer=10 {layer=11
{layer=12 GO:0032133 } {layer=12 GO:0032144 } }
{layer=11
{layer=12 GO:0045171 GO:0045172 } {layer=12 GO:0045203 }
} } {layer=10 {layer=11
{layer=12 GO:0042563 GO:0042564 } {layer=12 GO:0042566 }
} {layer=11
{layer=12 GO:0060110 } {layer=12 GO:0060111 } }
} } } } {layer=7 {layer=8 {layer=9 {layer=10 {layer=11
{layer=12 GO:0005750 GO:0045275 } {layer=12 GO:0045276 GO:0045278 } }
{layer=11
{layer=12 GO:0043245 } {layer=12 GO:0043246 } }
} {layer=10 {layer=11
{layer=12 GO:0042757 } {layer=12 GO:0042763 } }
{layer=11
{layer=12 GO:0042764 } {layer=12 GO:0042765 } }
} } {layer=9 {layer=10 {layer=11
{layer=12 GO:0031256 GO:0031257 } {layer=12 GO:0031358 }
} {layer=11
{layer=12 GO:0031904 GO:0031905 } {layer=12 GO:0031912 }
} }
{layer=10 {layer=11
{layer=12 GO:0031463 GO:0031465 } {layer=12 GO:0031470 }
} {layer=11
{layer=12 GO:0032993 GO:0032994 } {layer=12 GO:0032996 }
} } } } {layer=8 {layer=9 {layer=10 {layer=11
{layer=12 GO:0009504 } {layer=12 GO:0009509 } }
{layer=11
{layer=12 GO:0009506 GO:0009511 } {layer=12 GO:0009510 }
} } {layer=10 {layer=11
{layer=12 GO:0016234 GO:0042405 } {layer=12 GO:0016235 }
} {layer=11
{layer=12 GO:0031597 GO:0031603 } {layer=12 GO:0031600 GO:0031615 } }
} } {layer=9 {layer=10 {layer=11
{layer=12 GO:0030134 GO:0030137 } {layer=12 GO:0030256 }
} {layer=11
{layer=12 GO:0031605 GO:0031608 } {layer=12 GO:0031611 GO:0031614 } }
} {layer=10 {layer=11
{layer=12 GO:0030139 GO:0045334 } {layer=12 GO:0030257 }
} {layer=11
{layer=12 GO:0031233 GO:0031243 } {layer=12 GO:0031235 GO:0031246 } }
} } } } } {layer=6 {layer=7 {layer=8 {layer=9