CSEIT411849 | Published - 25 April 2018 | March-April-2018 [ (4 ) 1 : 295-301 ]
National Conference on Recent Advances in Computer Science and IT (NCRACIT) International Journal of Scientific Research in Computer Science, Engineering and Information Technology
© 2018IJSRCSEIT | Volume 4 | Issue 1 | ISSN : 2456-3307
295
A Survey on Different Techniques for Handling Missing Values
in Dataset
Sukanya Gupta
1, Dr. Manoj Kumar Gupta
21Department of computer and science, Shri Mata Vaishno Devi University, Katra, J&K, India-182301 2Department of computer and science, Shri Mata Vaishno Devi University, Katra, J&K, India-182301
ABSTRACT
Abundant of information is being collected and stored every day. That data can be used to extract interesting patterns. The data that we collect is incomplete normally. Now, using that data to extract any information may give misleading results. So, before using that we need to pre process the data to eradicate the abnormalities. In case of small percentage of missing values, those instances can be ignored but in case of large amounts, ignoring them won’t give desired results. Large amount of missing spaces in a dataset is a big problem faced by researchers as it can lead to many problems in quantitative research. So, before performing any data mining techniques to extract some valuable information out of a dataset some pre processing of data can be done to avoid such fallacies and thereby improving the quality of data. To handle such missing values many techniques have been proposed since 1980.The simplest technique is to ignore the records containing missing values other technique include imputation, which involves replacing those missing spaces with some estimates by doing certain computations. This would increase the quality of data and would improvise prediction results. This paper gives a review on different types of techniques available for handle missing data like k nearest neighbor (KNN), multiple imputation, case deletion, most common method (MC) etc.
Keywords: Data Pre Processing, Imputation, Mean, Mode, Data Pre Processing, Categorical Data, Numerical Data
I.
INTRODUCTION
Data collection is the first step in the process of knowledge discovery in database (KDD) or data mining. While recording data or during data observation, one of the issue that mostly occur is the presence of missing values. It is quite challenging to appropriately deal with such missing data as it requires a cautious examination of the data to identify the pattern of missingness and its type, and also a clear conception of how the different imputation methods work. Presence of missing data can reduce the statistical power of a study and can
increase the chances of error in prediction. Other technique is to replace the missing spaces with some computed estimate, this is called as imputation. There are many imputation techniques available such as k nearest neighbor, concept most common, most common method (MC), k-means, support vector machine, fuzzy k-means, singular value decomposition imputation (SVDI) etc. The paper is organized in six sections. Section second describes about the different types of randomness or missing value patterns found .Then, Section third explains the different types of methods available for handling missing data like case deletion and other imputation techniques. In this paper , we have define eight such methods. In section fourth we have discussed the advantages and disadvantages of various missing value imputation techniques discussed in section third. Finally, in the fifth section paper is concluded and section six points out some future work.
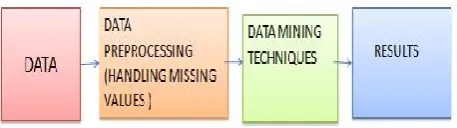
Fig. 1. Complete process of Data Mining
II.
LITERATURE SURVEY
Getting missing values in our data is very common. According to Enders, finding missing rate of 10% to 20% is common in educational and psychological studies [1]. If only 5% of data is missing, it can be simply ignored, according to Schaffer [2]. But more than 5% can lead to biased results. Before moving further, let us first discuss about different types of missing patterns that are commonly found in our gathered data.
Following are the different types of missing patterns found in our data
Missing completely at random (MCAR)
This is the situation when the probability of the missing data on a variable or feature is not related to that particular variable or any other variable in the dataset [3].
For example: Water damage to paper forms because of flood prior to its entry
Missing at Random (MAR)
This is the situation when the probability of the missing data on a variable or feature is not related to that particular variable but on other variable in the dataset.
For example: Sometimes when a patient is really sick, a clinician may not draw blood sample out of him for study specific labs.
Not missing at random (NMAR):
This is the situation when the probability of the missing data is dependent on that particular variable only that is the probability of missing data on y is dependent on value of y.
For example: Some people might not be comfortable to report their age or salary [4].
It is very important step to first determine the type
of missingness. Usually MAR and MCAR
the nature of data. In this paper we will discuss few of those techniques.
III.
DIFFERENT APPROACHES OF HANDLING
MISSING DATA
Many methods have been developed to handle missing data in datasets so as to improve prediction accuracy and to reduce biased results.
A. Case Deletion
It involves deletion of records that are containing any missing value .It is the most common and traditional technique to handle missing values. There are two types of deletion. One is listwise deletion and other one is casewise deletion. To use either of these techniques, an important assumption is that your data is MCAR. Listwise deletion will delete all the data for the record that is containing one or more missing values. This technique is simple to use [5]. However, this can produce bias results in some cases as it results in huge loss of data, its precision and also have huge effect on variability [6]. Pairwise deletion overcomes this disadvantage of listwise deletion to some extent. Pairwise deletion uses the concept of correlation. Correlation helps us to find the strength of relationship between two variables. Unlike listwise deletion pairwise deletion uses records that have missing values and do not completely ignore it thereby having less loss of information[8]. When a particular variable is having missing value, pairwise deletion procedure cannot use that particular variable but it can still use that record by considering and analyzing those variables with non missing values in that record. This procedure focuses on utilizing all available values and deleting only missing values[9].
Figure 2. Methods of handling missing values
B. Most Common Method
This method doesn’t ignore records with missing values instead it replaces missing spaces with some values. For categorical attributes, the missing values are replaced by the most common attribute value of the corresponding attribute or the mode and for numerical attributes; missing values are replaced by the average or mean of all the values of the corresponding attribute [10].
C. Concept Most Common Method
Concept can be defined as a subset of set of all records with the similar outcome. It is almost as same as the most common method but the only difference is that it is restricted to concepts. In this procedure, for numerical attributes , missing values are replaced by the mean of all values of the corresponding attribute restricted to the same concept and for categorical data, the missing values are replaced by the mode or the most common attribute value of the corresponding attribute restricted to the same concept[10] [11].
D. Regression Imputation
This method can only be applied in cases where there is a linear relationship between variables. It measures the average relationship between two or more variables and uses regression line as a tool to estimate the value of one variable given the value of other variable. But it is not used more often because in most of the cases, our data is not linearly separable [12-17] .This technique is easy to implement and may also lead to decreased variability.
E. K-nearest neighbor Imputation (KNNI)
different results may occur showing different performance level. It is mostly set to 1. One of the advantage of this method is that it can make predictions for both quantitative attributes ( the average among the k nearest neighbours)and qualitative attributes(the most frequently occurring value among the k nearest neighbours) [18].Unlike model-based imputation techniques, it does not demand creating predictive model for each attribute with missing data. Its procedure can be clearly explained with the help of an algorithm given below:
1. Split the dataset D into two parts. The first part that is Dm is the set containing the records having at least one of the attributes missing. The second part that is Dc. contains the remaining records
having complete attribute information.
2. Now, for each instance z in Dm
(a) Split the instance vector into two parts: missing zm and observed parts zo so that z = [zo; zm].
(b) Calculate the distance between all the instance vectors from the set Dc and zo. Take only those
attributes in the instance vectors from the complete set Dc, which are observed in vector z.
(c) Take the k closest instance vectors (k-nearest neighbors) and replace the missing value with the mean value of the attribute in the k nearest neighborhoods, for quantitative attributes. For qualitative attributes, perform a majority voting estimate of the missing values.
F. Multiple Imputation
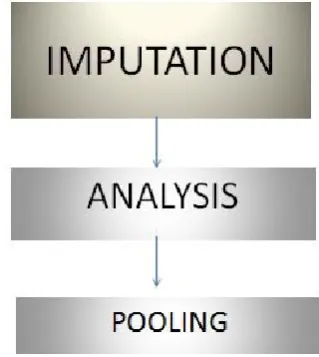
It is a statistical technique for examining missing values in datasets. According to studies, proper application of missing value imputation techniques can results in valid results. The figure below shows the three steps involved in multiple imputation technique: imputation, analysis and pooling.
In it, first we have to impute missing values m times resulting in m complete datasets.. After that comes analysis phase in which each of the m datasets is examined and their performance is measured using
Multilayer perceptron neural network model or any analysis model.
Figure 3. Three steps involved in multiple imputation method
Depending upon the performance of m complete datasets weights are computed. In the last step all the m datasets are clubbed into a final dataset. For that final dataset the weighted mean of the estimated values in m complete datasets is considered for filling the missing values [19]. This step is referred to as pooling.
Figure 4. Mechanism of multiple imputation method [12]
G. K-means Imputation
neighbours are found using clusters. All the instances in each cluster are referred as nearest neighbour of each other. Then, the missing value is imputed using the same method as is employed by KNNI imputation method. This procedure is fast and therefore is good for applying in big datasets. This algorithm reduces the intra cluster variance to minimum. Here too value of K parameter is an important factor and is difficult to predict its value. Also, this algorithm does not guarantee global minimum variance [6].
H.Expectation Maximization Imputation(EMI) There are two types of clustering algorithms. One is soft clustering and other is hard clustering hard clustering is the one in which clusters do not overlap that is an element either belong to a cluster or it doesn’t and in soft clustering clusters may overlap that is elements kind of belong to multiple clusters at the same time with different degree of belief and mixture models provide a probabilistic sound way of doing soft clustering. In it, each cluster corresponds to a generative model that is typically Gaussian or multinomial. Each cluster basically corresponds to a probabilistic distribution and what we want to discover as part of the EM algorithm are the parameters that is probabilities for each outcome for multinomial and co-variance and mean for each Gaussian cluster. Expectation maximization algorithm allows you to infer those parameters. It is an iterative algorithm and finds out maximum likelihood and the iteration continues until the algorithm converges [6]. It consists of two steps: Expectation (E step) and maximization (M step). Expectation step fill in the missing data that we expect to be there. Maximization step is used to find the optimal value of the parameters [20]. It is useful for hierarchical model with latent or missing variables. It can also be used to impute missing values in contingency tables. It is alternating between fixing the parameters, fixing the known data and estimating or finding the missing data and fixing the complete table and maximising likelihood and find new average. It iterates until convergence. This algorithm is very complex and takes lot of time for converging.
IV.
ADVANTAGES AND DISADVANTAGES OF
ABOVE MISSING VALUE TECHNIQUES
imputation Easy and simple to use and implement.
imputation Very easy and simple technique. Only applicable if data is
large datasets and
This paper discuss about the effect that missing data can cause at the time of extracting knowledge from the data. It can lead to biased results; give unfair results, make false predictions, can avoid the discovery of some hidden pattern etc and in today’s world, getting a perfect data is a myth. Usually the data we gathered is incomplete and contains missing values. So, we cannot simply ignore their presence. However, a very small percent of missing values can be ignored but for large percents , ignoring them can produce imperfect conclusions. So, it is an important step to deal with those missing values. This, dealing is done in data pre processing phase. This paper provides us eight such techniques of dealing with missing data. For different datasets, their performance varies. It is not necessary that if for a medical dataset a certain algorithm is giving best results then for psychological dataset or other datasets, the same will produce best results. Many tools provide missing value imputation algorithms like KEEL, R etc. In this paper, we have discussed about different types of missing value imputation methods and their pros and cons.
VI.
FUTURE WORK
Now a day, many hybrid methods have been proposed for handling missing values. Not only this there is a lot of effort given to remove the outliers and the noise data and to perfectly perform pre processing in order to get quality data.
VII.
REFERENCES
[1] EndersCK,”Using the expectation maximization
algorithm to estimate coefficient alpha for scales with item- level missing data”,psycho meth. 2003,8(3):322-337
[2] Schafer JL,”Multiple Imputation: a primer”, state
methods in med.1999;8(1):3-15.
[3] Schneider T,”Analysis of incomplete climate data : estimate of mean values and co-variance matricesand imputation of missing values”, Journal of Climate, vol 14, pp.853-871
[4] S.Aslan, C.Yozgatligil, C. Iyigun,
I.Batmaz,M.Turkes,H.Tatli ,”Comparison of Missing value imputation methods for Turkish monthly total precipitation data”
[5] Little, R. J,”Regression with missing X’s: a review”, Journal of the American Statistical Association, 87, 1227-1237, (1992).
[6] Rajnik L.Vaishnav, Dr. K.M.Patel, “Analysis of various
techniques to handling missing value in dataset”, International Journal of Innovative and Emerging Research in Engineering, vol 2,Issue 2, May 2015. [7] Marsh, H. W, ”Pairwise deletion for missing data in
structural equation models: Nonpositive definite matrices, parameter estimates, goodness of fit, and adjusted sample sizes”, Structural Equation Modeling: A Multidisciplinary Journal, 5, 22-36, (1998).
[8] Peugh, J. L., & Enders, C. K,” Missing data in educational research: A review of reporting practices and suggestions for improvement.”,Review of Educational Research, 74, 525-556,2004.
[9] Wothke, W.,”Nonpositive definite matrices in
structural modeling. In K.A. Bollen & J.S. Long (Eds.)”,Testing structural equation models (pp. 256-293), Newbury Park, CA: Sage,1993.
[10]Jerzy W.Grzymala-Busse, Linda K.Goodwin, Witold J.
Grzymala-Busse,Xinquin Zheng, “Handling Missing Attribute Values in Preterm Birth Data Sets”,UNAI 3642,pp 342-351,2005.
[11]Bairagi,. And Suchindran C.M,”An estimator of the cutoff point maximization sum of sensitivity ” Indian Journal of Statistics 51, 263-269,1989.
[12]Geeta Chhabra,Vasudha Vashisht, and Jayanthi Rajan,
[13]Kaiser J,”Dealing with missing values in data”,Journal of Systems Integration, 5(1):42–51.,2014.
[14]Young W, Weckman G, Holland W.,”A survey of
methodologies for the treatment of missing values within datasets: Limitations and benefits”, 12(1):15– 43,Jun 2010.
[15]Pigott TD.,”A review of missing data treatment
methods”,Educational Research and
Evaluation.,7(4):353–83, 2001.
[16]Rezvan PH, Lee KJ, Simpson JA,”The rise of multiple
imputation: A review of the reporting and implementation of the method in medical research”,. BMC Medical Research Methodology,p. 1–67. 2015.
[17]Nookhong J, Kaewrattanapat N,” Efficiency
comparison of data mining techniques for missing-value imputation’,Journal of Industrial and Intelligent Information.,Suan Sunandha Rajabhat University, Bangkok, Thailand, 3(4):1–5, 2015 Dec 2015.
[18]Chih-Fong Tsai, Fu-Yu Chang,”Combining instance
selection for better missing value imputation”, The Journal of Systems and software, 2016.
[19]Rohollah Ramezani, Mansoureh Maadi, Seyedeh
Malihe Khatami,”A novel hybrid intelligent system with missing value imputation for diabetes diagnosis”, Alexandra Engineering Journal, 2017
[20]RupamDeb, Alan Wee-Chung Liew,”Missing value
imputation for the analysis of incomplete traffic accident data”, Elsevier Journal, 2016.
[21]Archana purwar and sandeep kumar singh,” Hybrid
prediction model with missing value imputation for medical data ” , Elsevier Journal, 2017.
[22]Naresh Rameshrao Pimplikar, Asheesh Kumar,
Apurva Mohan Gupta ., “ Study of Missing Value Imputation Methods” International Journal of Advanced Research in Computer Science and Software Engineering 4(3), pp. 1487 -1491, March 2014.
[23]Bennett DA.,”How can I deal with missing data in my
study? “Aust N Z J Public Health., 25(5):464– 469,2001.
[24]Hammouda, K. Karray, F. Department of Systems
University of Waterloo, Ontario, Canada. “A Comparative Study of Data Clustering Techniques”. Unpublished, November 2004.
[25]Hímer, Z. Wertz, V. Kovács, J. Kortela, U. University
of Oulu, Systems Engineering Laboratory.Neuro-Fuzzy Model of Flue Gas Oxygen Content
http://www.supelec.fr/lss/CTS/WWW/preprint-himer-01.pdf - Last Accessed 13 Aug. 2008.
[26]Vink G, Frank LE, Pannekoek J, Buuren SV.
Predictive mean matching imputation of
semicontinuous variables. Statistica Neerlandica. Wiley Publishing. 2014; 68(1):61–90.
[27]Stekhoven DJ, B’uhlmann P. Missforest
non-parametric missing value imputation for mixed-type data. Bioinformatics. 2012; 28(1):112–8. PMid: 22039212.
[28]Lichman M. UCI machine learning repository. Irvine,
CA: University of California, School of Information and Computer Science; 2013. PMid: 24373753.
[29]LI XB. A Bayesian approach for estimating and
replacing missing categorical data. ACM Journal of Data and Information Quality. 2009 Jun; 1(1):1.
[30]Yu X, Lim ZJS,”Replace missing values with EM
algorithm based on GMM and Naive
Bayesian”,International Journal of Software