CSEIT172574 | Received : 12 Sep 2017 | Accepted : 24 Sep 2017 | September-October-2017 [(2)5: 380-385]
International Journal of Scientific Research in Computer Science, Engineering and Information Technology © 2017 IJSRCSEIT | Volume 2 | Issue 5 | ISSN : 2456-3307
380
Sorted Positional Indexing Based Computation for Large Data
K. S. Vijaya Lakshmi
*1, K. Gayatri
2*1Assistant Professor, Computer Science Department, VR Siddhartha College, K. S. Vijaya Lakshmi, Vijayawada, India 2,1
Computer Science Department, VR Siddhartha College, Student, Vijayawada, India
ABSTRACT
The performance of Hadoop Map Reduce mainly depends on its configuration parameters. Tuning the job configuration parameters is an effective way to improve performance so that we can reduce the execution time and the disk utilization. The performance of tuning is mainly based on CPU usage, disk I/O rate, memory usage, network traffic components. In this work we are discussing about the tuning techniques to upgrade the execution of Map Reduce occupations. It is found that the current calculations can't prepare the skyline on huge information productively. So, here we are using a novel skyline algorithm Skyline Sorted Positional Index List (SSPL) on huge data like social data. SSPL utilizes sorted positional index lists which require low space overhead to reduce I/O cost significantly. The experimental results on synthetic and real data sets show that SSPL has a significant advantage over the existing skyline algorithms.
Keywords: Big data, Hadoop Map reduce, Skyline, SSPL
I.
INTRODUCTION
A huge collection of data is called as Big data. The term big data has been a popular topic recently in practice, academy, and government to reflect the needs of using the huge data. Big data refer to data sets which are so large and complex that is beyond the ability of typical software tools to capture, store, manage, and analyse it within a tolerable elapsed time [1]. The purpose of collecting big data is similar to tradition data mining to solve the key problems of society, business and science.
The generated data is not only by organizations and governments actually, each and every one of us now is a data generator. We produce data using our mobile phones, social networks interactions, GPS, etc. Most of such data, however, is not structured in a way so as to stored and/or processed in traditional DBMS. The collection of data over a time frame that is so complex and difficult to process and manage using conventional database management tools.
Semi-Structured Data - such as XML formatted data.
Unstructured Data – These data can be generated by humans such as social media, discussion forums and customer feedback, comments, emails etc. or
may be generated by machine such as online transactional, satellite and environmental data collected through various sensors, web-logs, call records etc.
Structured Data - generated from various researches efforts, CRM (Customer Relationship Management) and other such traditional databases.
challenge is how to combine the distributed and massive meaningful features for analysis.
Although it is convenient to combine all features across tables, it may suffer the curse of dimensionality and problems of feature selection. On the other hand, the problem of skills availability is the fact that the traditional data mining [3] methods cannot deal with big data due to these data are stored distributed. In the field of machine learning, high dimensional data analysis and Distributed Data Mining (DDM) algorithms are newly developing topics and received much attention recently. Although these issues are clearly related to big data, they are not well-integrated and should be overcome appropriately. The value of big data is indubitable. However, how to transform big data to big value is the main issue. Although there are plenty of tools and architectures, such as Hadoop, Map Reduce, NoSQL database etc., to search, manage, store, and control huge volume of data, the analysis of big data can truly derive the nugget of big data.
We propose to develop a Skyline (Horizon) with sorted positional index lists to return results quickly with unique attribute presentation. The criterion uses the pre-constructed data-structures which need low area expense to reduce I/O price considerably. Procedure of Skyline algorithm explained next sections with feasible data storage and processing So here we are using an algorithm which can handle the both consistent and inconsistent data. And can improve the performance and reduce the CPU usage, disk I/O rate also.
II.
METHODS AND MATERIAL
A. Skyline Based Indexing And Querying
In this section, we present and develop Skyline indexing method to define efficient computation in multi job tracking in recent contribution in different attribute parameters. As discussed in related work of TO and PO attribute domain data representation using ZB-tree data structure, in this section we define Skyline with sorting using ZB-tree procedure and nested code implementation in horizontal and vertical data presentations.
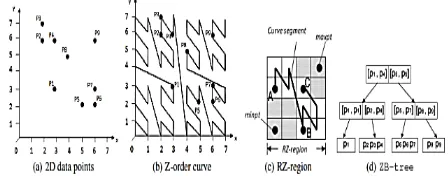
ZB-tree: A ZB-tree is a version of B+-tree using Z-addresses as important factors. The information factors are saved in the leaves places categorized in
non-dropping demand of their Z-addresses. Fig. 1(d) talks to the ZB-tree consisting on the dataset gave up Fig. 1(a), where the littlest and most impressive possible leaves hub prospective are 1 and 3, independently. Each inward hub get to (comparing to some kid hub N) helps you to save a interval, intended by a few Z-addresses, along with a section of the Z-order perspective (called the Z-area) guaranteeing all the information views the leaves places in the catalog sub shrub targeted at N. Especially, a interval is shown by (min pt; max pt), where min pt and max pt organize, independently, to the most decreased and most impressive possible Z-locations of the tiniest rectangular shape area, known as the RZ-locale, that clos the Z-area. A situation of RZ-district is confirmed by the rectangular shape in Fig. 1(c) where three information determines A, B, and C are limited; the min pt and max pt revealed are the most decreased and most raised possible Z-locations of the fitted rectangular shape RZ-district.
Figure 1 : Z-order internet indexing with ZB-tree data representation.
(P3) If the maxpt of R 0 is not believed management by the min pt of R, then no purpose in R 0 can be believed management by any consider R. For each visited record get to (either inner or leaves section) E, Z-Search creates Control (SM,D) requirements (appeared in Appendix A) to look at whether the pertaining RZ-area or information varying of E can be believed management by the skyline determines SM. Dominate(SM,D) changes SL in an expansiveness first way and performs occurrence evaluation between each visited get to and E depending upon features P1 to P3. Particularly, if E is an fitted get to and the assumption is management by some skyline consider because of P1, then the look for of the record sub shrub targeted at the hub pertaining to E is trimmed.
Procedure of the Skyline ZB-tree implementation with different sorting attributes shown in following algorithm.
Algorithm 1. Procedure for the skyline ZB –tree for indexing Step 4: Perform earlyPrun() to main hash table z-order indexing to maintain positional index occurrence in attributes.
Step 5: Perform latePrun() to arrange sequential tuple maintenance to array list.
Step 6: Formulate to increase the attributes with their indexing either ascending & descending order with different formations. into either ascending or descending order presentations.
Code implementation procedure for skyline ZB-tree formulates in nested code implementation.
1.1 Nested Code Schema Implementation:
Around there, we display a novel enhancement organize, known as resolved progression (or NE, for short), for progression requirements in PO websites. The progression program's created to be responsive to Z-arrange publishing to such a degree that when the properly secured requirements are documented with a ZB-tree, the two appropriate features of monotonicity and bunching of ZB-tree are kept up. ZB-tree, the two appropriate features of monotonicity and bunching of ZB-tree are kept up. We indicate a limited buy by an knowledgeable chart G = (V;E), where V and E indicate, independently, the agreement of vertices and ends in G with the end objective that given v; v 0 2 V , v guidelines v 0 iff there is a trained course in G from v to v 0. Given a hub v 2 V, we implement parent(v) (resp., child(v)) to display the agreement of parent or guardian (resp., tyke) locations of v in G. A hub v in G is considered as a acceptable hub if parent(v) = ;; and it is considered as a biggest hub if child(v) = ;. We implement min(G) and max(G) to illustrate, independently, the agreement of little locations and biggest locations of G as confirmed in figure 5.
Figure 2: Partial order and totally order data presentation with different attributes.
III.
RESULTS AND DISCUSSION
In this section, we assess the performance of our suggested approach with regards to allocated file system information discussing in lots of information systems in real-time information positioning with different factors. For that we need to use Coffee system to draw out information sets from different sources available in openly available and reliable databases links. Using Net legumes design name node information node reflection using some collections and sessions available in program development interface with different structures. To perform this program we need to keep 8 GB RAM process to spend several job monitoring to different server handling. First, we installation Hadoop atmosphere after that we develop name node options with IP deal with and slot variety and then information node started with name node IP deal with and slot variety, after that name node give information to information node based on Hadoop group set up options with different factors approved by features.
Table 1 shows the Hadoop structure gives simulator factors to set up Hadoop atmosphere.
Table 1: Simulation Parameter values with detailed description.
By using above simulator parameter, we create efficient style of suggested strategy with possible functions. To look at the efficiency of our suggested online listing and querying, we perform set of tests to evaluate our suggested strategy with HDFS system structure.
To look at the effectiveness of our suggested placed development plan, we furthermore showed two versions of ZB-tree that rely on using different techniques to copyist PO websites. The primary difference, TSS+ZB, combines the TSS progression organize with the ZB-tree technique. Every PO part confidence vp of a knowledge determine is properly secured a bit sequence depending upon its ordinal confidence vt in a topological organizing of the PO department requirements. The development of vt in the introduction of the information point's Z-deliver is essential to make sure ZB-tree's monotonicity residing agreement. Every leaves hub accessibility in TSS+ZB stores a information determine p together with the time interval set impact of each of p's PO consist of requirements. In each inward hub accessibility of TSS+ZB, beides sparing the minpt and maxpt of the pertaining RZ-district (like what is done in ZB-tree), for every PO consist of An, a combined interval set for An is saved which is the company of the temporary areas for emphasize An of the properly secured information elements. In TSS+ZB, location centered ubiquity dissect is used as requires after: if (1) the Z- deal with of a powered skyline consider pi guidelines minpt of an internal hub get to ej , and (2) the time interval set of pi subsumes the temporary agreement of ej w.r.t. each PO calculating, then the variety talked to by ej is guarded with pi and is reduce from issue.
Table 4.2 shows the data formulation in terms of CPU utilization in data processing on both name & data node configurations in data processing.
Table 2: CPU utilization in data processing.
Figure 3: CPU utilization with respect to number of attributes increased.
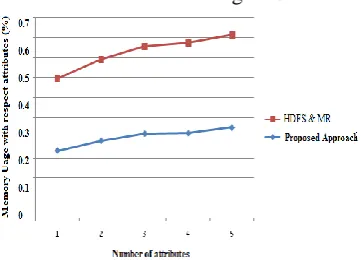
Table 3 shows the data formulation in terms of memory utilization in data processing on both name & data node configurations in data processing.
Table 3: Memory utilization results in data processing with respect to attributes
No.of attributes
Proposed Approach
HDFS & MR
1 0.680 0.735
2 0.780 0.818
3 0.860 0.875
4 0.865 0.900
5 0.915 0.935
Memory utilization with respect to increase attributes in recent application running with parallel processing in different data items as shown in figure 3.
Figure 5: Memory utilization results in both proposed and HDFS systems,
Fig 5 implements and show execution time implementation parameters with different attributes presentation in different streams in sequential execution of data node job processing.
Figure 4: Time efficiency results with respect job evaluation in different attributes.
As discussed in previous sections Internet based indexing gives better results in application process with respect to data node implementation and name node implementation in real time data processing.
.
IV.CONCLUSION
V.
REFERENCES
[1]. J. J. Huang, "Two Steps Genetic Programming for Big Data - Perspective of Distributed and High-Dimensional Data," IEEE International Congress on Bi Data, New York, NY, pp. 753-756, 2015.
[2]. Avita Katal Mohammad Wazid R H Goudar, Big data: Issues, challenges, tools and Good practices. In Contemporary Computing (IC3), Sixth International Conference on, 404-409, 2013.
[3]. X. Wu, X. Zhu, G. Q. Wu, and W. Ding, “Data Mining with Big Data”, IEEE Transactions on Knowledge and Data Engineering, 26(1) 97-107, 2014.
[4]. V. Kalavri and V. Vlassov, "MapReduce: Limitations, Optimizations and Open Issues," 12th IEEE International Conference on Trust, Security and Privacy in Computing and Communications, Melbourne, VIC, pp. 1031-1038, 2013.