© 2018 IJSRCSEIT | Volume 3 | Issue 5 | ISSN : 2456-3307
Healthcare Prediction Analysis in Big Data Using Random
Forest Classifier
M. Arun Kumar*1, Dr. A. P. Siva Kumar2
*1M.Tech, CSE Department, JNTUCEA, Ananthapuramu, Andhra Pradesh, India 2Assistant Professor, CSE Department, JNTUCEA, Ananthapuramu, Andhra Pradesh, India
ABSTRACT
Rapid growth of Big Data in healthcare and biomedical fields helps in accurate analysis of medical information. In addition, it serves benefits like prediction of disease in advance, patient healthcare services etc. Conversely, accuracy in analysis decreases as the quality of training set is insufficient. Furthermore, many regions demonstrate superior characteristics of some chronicle diseases, which may discourage the prediction of disease risk. Here, we modernize Random Forest algorithm for better prediction of a chronic disease. We demonstrate an enhanced model of prediction on real-time patient information gathered from UCI repository. Our work focuses on one of the most popular chronic disease that is heart disease. The accuracy of prediction in our work reaches almost 97%.
Keywords: Machine Learning, Big Data, Healthcare
I.
INTRODUCTION
Big Data indicates huge data volumes in different formats that engulf organizations on daily basis. Big Data is used in inspecting insights that leads to enhanced decisions and business proceedings. General consent of the day is there are precise attributes, which delineate Big Data. Those attributes are termed as follows:
i. Volume: specifies the quantity of data. The exclusive feature that fabricates data big is its mammoth volume
ii. Variety: cites diverse types of data
a. Structured Data – data organized in a specific format
b. Unstructured Data – no specific format c. Semi structured – combination of above two iii. Velocity: cites quickness by which mammoth amounts of data that is being generated, gathered and inspected.
iv. Veracity: refers to nature [quality] or truthiness of data
Advancement of Big Data in health field, it turns easy in reckoning prediction of disease by studying records by Machine Learning system. The vital features of it are as follows:
Figure1. Four ‘v’s of Big Data
the data in depth. Reinforcement means learning from experiences.
Classifier is classification model that predicts a label to input unlabelled data. This comes under supervised. Prediction in Decision Tress is made as per rule set generated. A Random Forest is collection of such trees, which works on the concept of voting. Input is fed into each tree and predicted value is given as output. The label that has maximum votes is given as prediction of a Random Forest.
II.
RELATED WORK
As per Kinsey.Mc [2] 53 percent of US population are affected with chronic disease(s). Nearly 85 percent of health care bill of US is utilized on treatment of such diseases. By the upgrading of living conditions, the occurrence of chronic ailments is rising. On an average US has spent 2.8 trillion dollars yearly on the treatment of chronic diseases. This corresponds to 17.8% of yearly GrossDemosticProduct (GDP) of US. This problem is also unquestionably significant in several other nations.
As per a report on chronic diseases and nutrition in china 2015, Chronic Diseases are main reasons for death in China. Approximately 85.7% of demise is caused by chronic ailments. So, it is must to predict risk for these diseases. By the growth of medical data, gathering of records in electronic form (EHR: Electronic Health Records) increasingly handy. EHR consists of patient data, disease history, and test constructed a data consistency protocol used for PersonalHealthRecord [PHR] based distributed scheme.
Et Al Bates recommended six uses of BigData in area of healthcare. Furthermore, in physical cyber system it aptly brought advanced approach of prediction oriented health care acceptances, further with predicting risk estimate. Prediction by traditional risk prediction models associates a ML[Machine Learning] algorithm (Eg: Regression analysis , Logistic regression so on) and particularly one of supervised method using labelled data in model training. In test set, patients are divided into groups namely low risk or high risk.
Expeditious growth of BigData, more interest is compensated to disease risk prediction. From the viewpoint of Big Data handful researches have been made by choosing the characteristics automatically from a collection of mammoth data to enhance the accuracy of risk prediction rather than previously chosen characteristics. Thus, risk prediction is done based on big data analysis. Main thing is how missing data is handled? How to increase the accuracy in prediction?
To solve these, we will make use of Random Forest Classifier, which will handle missing values internally and gives higher accuracy. As per our knowledge, none of current works focused on Random Forest classifier algorithm to handle missing data and to predict disease with high accuracy.
III.
DATA SET
5. Level of serum in cholesterol 6. Sugar level in blood
7. ECG result 8. Max heart rate
9. Exercise-Induced-Angina 10. Previous peak value of ST 11. ST Slope
12. Count of flourosopy(vessels) 13. Defect thal factor
14. Diagnosis of HeartDisease
The structure of the dataset is as follows:
Figure 2. Dataset of Heart Disease
IV.
MODEL CONSTRUCTION
A. Predicting risk of disease:
Our aspiration is to prognosis risk of disease as per his/her medical data. Formally, we estimate the prediction of chronic heart disease as supervised method. Input is feature value of patient say C = (c1, c2, …, cn) this consist of patient information such as age of the patient, sex, type of chest pain , BP[Blood Pressure], level of cholesterol, maximum heart rate etc. Output is Y, indicates if a person is in high risk group or low risk group.
Y = {0,1} where
0 indicates low risk group and 1 indicates high risk group
B. Model Construction
This model is created in two stages. In 1st stage a forest will be created and in 2nd stage results are predicted by using generated forest. The complete process is as follows:
Stage 1: Creation of Random Forest
1. From total of ‘m’ features select ‘n’ randomly such that n is less than m
2. From selected ‘n’ features , determine node d by applying best split
3. By using best split, form the child nodes of node d
4. Repeat steps 1 to 3 till leaf nodes are formed 5. Forest is build by iterating from 1 to 4 for ‘k’
times in order to form a forest with k number of trees
Stage 2: Prediction
Once classifier is trained, prediction is made as follows:
1. Test features are parsed through all the trees of generated forest
2. Each tree will make a prediction
3. Output is calculated based on concept of voting
Final prediction is made by voting procedure in which target is predicted by considering maximum votes of classifiers.
Dataset has 1843 records in total. 75% of data is split into training and remaining 25% as testing set. Total we have 1382 records in train set and 461 records in test set. Generated model is trained with training summarises performance of a classifier. Algorithm’s performance is visualised in terms of True positive, False negative, True Negative and False positive. The confusion in classification of prediction is represented. This depicts sum of correctly depicted and misclassified labels. Used in analysing the measure of performance of classifier.
Table 1.
Confusion Matrix For Test Set
Reference
Prediction 0 1
0 677 4
1 0 701
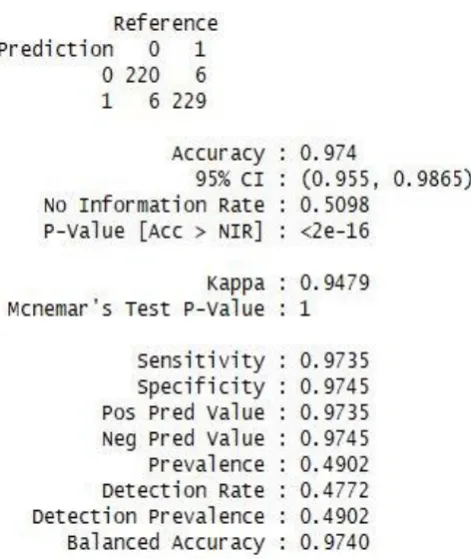
Confusion matrix for testing data is mentioned in Table 2 as follows:
Table 2.
Confusion Matrix For Test Set
Reference
Prediction 0 1
0 224 10
1 2 225
Prediction statistics over testing data is represented below:
Figure 3. Prediction Statistics
Error in prediction can be decreased by increasing tree count in forest. An estimate that calculates error in prediction for Random forest is OOB [out of bag error]. Graph representing relation between Error vs Number of trees is as follows:
Figure 4. Relation between Error in prediction and Number of trees in Forest
Among all available features/variables only a few will play crucial role in predicting the results. The top 10 important variables is shown in following figure:
Figure 5. Top 10 important variables/features
VI.
CONCLUSIONVII.
REFERENCES
[1].Yixue Hao, Kai Hwang,Min Chen, fellow IEEE,, Lin Wang* and Lu Wang* "Disease Prediction by Machine Learning over Big Data from Healthcare Communities",2017
[2].P. Groves, B. Kayyali, D. Knott, and S. V. Kuiken, "The’big data’revolution in healthcare: Accelerating value and innovation," 2016.
[3].M. Qiu and E. H.-M. Sha, "Cost minimization while satisfying hard/soft timing constraints for heterogeneous embedded systems," ACM Transactions on Design Automation of Electronic Systems (TODAES), vol. 14, no. 2, p. 25, 2009. [4].P. B. Jensen, L. J. Jensen, and S. Brunak, "Mining
electronic health records: towards better research applications and clinical care," Nature Reviews Genetics, vol. 13, no. 6, pp. 395–405, 2012. [5].J. Wang, M. Qiu, and B. Guo, "Enabling real-time