Vol. 6, Issue 2, February 2017
Study on the Removal Characteristics of Heavy
Metals from Aqueous Solution by Fly Ash Collected
from Suratgarh and Kota Thermal Power Stations
Christina Rahel, Mridula Bhatnagar
Research Scholar, P.G. Department of Chemistry, G.D.C., Bikaner Rajasthan, India
Lecturer, P.G. Department of Chemistry, G.D.C., Bikaner Rajasthan, India
ABSTRACT: Coal fly ash from Suratgarh and Kota Thermal Power Stations, Rajasthan was used to effectively remove heavy metals from aqueous solution. Batch studies were performed to evaluate the adsorption process and the effect of pH and metal ion concentration on removal process was investigated. Equilibrium adsorption data were correlated with Freundlich adsorption isotherm model. The value of n >1 indicated that the sorption of metal ions was favourable on the surface of FA-1 and FA-2. Also, the higher K values for all the four metal ions indicate greater adsorption capacity. These values follow the same order as shown by solid/water distribution ratio, Kd = Qe/Ce, determined at neutral pH 7 for FA-1, Pb (0.604) > Cu (0.080) > Zn (0.031) > Cd (0.012).
Similar ratios were also obtained for FA-2, and increased as pH increased indicating that the relative tendency for different heavy metal ions to bind to them follows identical order. Fly ash from Suratgarh Thermal power station has comparatively higher adsorption capacity due to smaller particle size and larger surface area as examined by particle size analysis of fly ash samples. This work proved that fly ash from Rajasthan thermal power stations can be used as an effective low-cost adsorbent for the removal of heavy metals from aqueous solution.
KEYWORDS: Coal Fly Ash, Heavy metals, Batch sorption studies, Freundlich Isotherm Model, Adsorption Capacity
1. INTRODUCTION AND ORIGIN OF THE RESEARCH PROBLEM
Vol. 6, Issue 2, February 2017
(TPS-2) thermal power stations using Batch technique. The adsorption capacity of both the fly ashes will be measured using Atomic Adsorption Spectrometer (AAS) and pH and metal concentration will be varied to study its effect on metal sorption capacity of fly ash. The main objective of this study was to find out and compare the adsorption capacities of fly ash from TPS-1 and TPS-2 and to identify the optimum removal conditions for each metal ion for further reference in future research studies involving improvement of fly ash adsorption efficiency.
II. LITERATURE SURVEY
Kumar (2003) [7]has reported that utilization of coal ash in India has been so far very low compared to other developed countries in the world. In some countries in the west, utilization is almost close to 100%, whereas in India, utilization is about 23% . These values point towards increase in the utilization of ash at present compared to what was in early nineties. On the other hand discharge of wastewater into environment containing elevated levels of heavy metals and toxic pollutants without proper treatment has led to adverse environmental effects. Thus conventional methods like chemical precipitation, filtration, chemical oxidation or reduction, ion exchange, electrochemical application and biological treatment are applied for removing dissolved heavy metal ions from industrial wastewaters [8]. The adsorption technique involving non-conventional low cost adsorbents [9] has been shown to be highly efficient for the removal of heavy metals due to significant advantages like low cost, simplicity, availability, profitability, ease of operation and efficiency, in comparison with the conventional adsorbents which are highly expensive and non affordable by most of the developing nations. Seco et al. [10] studied the adsorption of heavy metal ions Cu, Cd, Zn and Ni onto activated carbon and reported that adsorption of Cu ions is less sensitive to the presence of other metal ions, when compared to Ni, Cd and Zn. Aksu and Yener (1999) [11] used dried activated sludge and fly ash as a substitute for activated carbon and compared the capacities achieved with that of granular activated carbon. Several research studies were conducted to show the effectiveness of fly ash in the removal of heavy metal ions [12-14] from aqueous solutions. However, there is a research need to study more on the removal characteristics of fly ash and their effect on adsorption capacity under varying experimental conditions to reduce its environmental and health effects as well as the hazards associated with the use of heavy metals.
III. MATERIALS AND EQUIPMENT
This paper presents the experimental procedures including details of laboratory tests; equipments and test procedures followed in the present research work.
A. HEAVY METALS
In the present study heavy metals zinc, lead, cadmium and copper in the form of chloride salts (Aldrich) were removed from their aqueous solutions using fly ash from TPS-1 and TPS-2. Fly ash which is considered a by-product of thermal power stations is a strong alkali material with negatively charged surface at high pH’s, so it can be used to remove metal ions from aqueous solution by precipitation or electrostatic adsorption.
B. FLY ASH
Fly ash samples collected from TPS-1 and TPS-2 were initially sieved from sieve size of 75 μm, since the maximum particles were in the range of 25 to 75 μm as analysed by Particle Size Analyser (PSA).
C. CHEMICALS AND REAGENTS
Vol. 6, Issue 2, February 2017
D. INSTRUMENTATION
The instruments and apparatus used during the course of experiment are listed below:
Table 3.1 Instruments used, their make and function
Instrument
Make Function
pH meter
CP 901 pH measurement
Electronic weight balance
Sartorius Weight measurement
Atomic Adsorption
Spectrometer AAS Model GBC 932 Concentration measurement
Oven
Shivaki Drying of samples
Shaker Environmental orbital shaker To stir the content
IV. PROCEDURE
A. PREPARATION OF ADSORBENT
The raw coal fly ash samples (500g) collected from TPS-1 and TPS-2 were washed with double distilled water four to five times (10 g with 100ml of water) and finally washed with deionized water (1000ml) to remove the present unwanted inorganic matter. The fly ash samples were then dried in the electric oven at 120 0C for at least 24 hours and stored in vacuum desiccators for further use without any pre-treatment.
B. PREPARATION OF METAL IONS (ADSORBATE) SOLUTION
The analytical reagent [AR] grade [15] metal salts (Aldrich) used as heavy metal source were copper chloride (CuCl2), zinc chloride (ZnCl2), lead chloride (PbCl2) and cadmium chloride (CdCl2). Stock solutions of
metal concentration 1000 mg/l were prepared by dissolving the appropriate amounts of chloride salts of the four heavy metals in fresh doubly distilled water. The concentrations of the metal solution of 50 mg/l to 400 mg/l were prepared by diluting stock solution. The solutions were prepared using standard flasks.
C. ADSORPTION EXPERIMENTS
Vol. 6, Issue 2, February 2017
Atomic Absorption Spectrometer (AAS Model GBC 932) equipped with hollow cathode lamp and air- acetylene burner was used for determination of heavy metal concentration. Standard solution for the establishment of calibration curves for each of the four metals was prepared and analysis of each sample was carried out in triplicate to calculate mean wavelength (Adsorption maxima) for each set of values.
Table 4.1 Maximum Absorption Wavelength for Heavy Metals
S. No. Heavy metal Wavelength, nm
1. Copper 324.8
2. Zinc 213.9
3. Cadmium 228.8
4. Lead 217
Above table illustrates maximum wavelength used for each of the heavy metals.
E. EFFECT OF PH
100 ml of aqueous solutions containing 100 mg/l heavy metal ions and 20 g/l fly ash samples were transferred into stopper conical flasks and pH was adjusted in the range of 3 to 10. The solutions were agitated for 2 hours at room temperature with a constant speed of 120 rpm. After mixing, the solutions were filtered through a 0.45 μm membrane filter and the residuals were analysed using atomic adsorption spectrometer. A graph is plotted between pH and % Removal after calculating the value of Qe according to the following equation:
Qe = V (Ci – Ce) /m (Eq 4.1)
% Removal = 100 ( Ci – Ce )/ Ci (Eq 4.2)
where
Qe = amount of metal ion adsorbed per unit mass of adsorbent (mg/g adsorbent)
Ci = initial concentration of metal ion (mg/l) Ce = equilibrium concentration of metal ion (mg/l) V = volume of the metal ion solution (l)
m = weight of the adsorbent (g)
F. EFFECT OF METAL ION CONCENTRATION
100 ml of aqueous solution containing 50-300 mg/l heavy metal ions were added to 250 ml stopper conical flasks. 20g/l or 2g/100ml fly ash dosage was added and the pH value was adjusted at the optimum value for each metal obtained from the above experiments. After 2 hours shaking at room temperature with a speed of 120 rpm, the solutions were filtered using 0.45 μm membrane filter and the residual was investigated for heavy metal concentration using atomic adsorption spectrometer. A graph is plotted between % Removal and metal ion concentration according to Eq. 4.2
V. RESULT AND DISCUSSION
A. CHARACTERIZATION OF THE FLY ASH SAMPLES
5.1.1 Chemical composition of fly ash
Vol. 6, Issue 2, February 2017
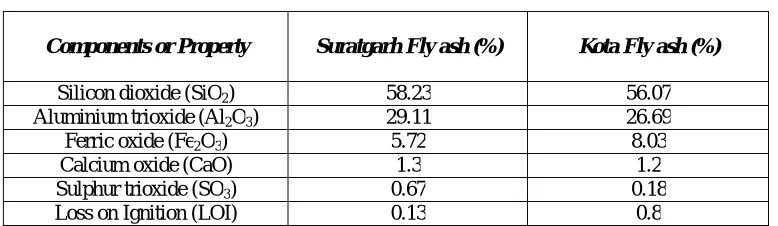
FA-2 respectively. The chemical composition of the fly ashes collected from Suratgarh and Kota thermal power stations are given in Table 5.1.
Table 5.1: Chemical Composition of Suratgarh (TPS-1) and Kota (TPS-2) Fly Ash
Components or Property Suratgarh Fly ash (%) Kota Fly ash (%)
Silicon dioxide (SiO2) 58.23 56.07
Aluminium trioxide (Al2O3) 29.11 26.69
Ferric oxide (Fe2O3) 5.72 8.03
Calcium oxide (CaO) 1.3 1.2
Sulphur trioxide (SO3) 0.67 0.18
Loss on Ignition (LOI) 0.13 0.8
It is evident from the above results that the fly ash is predominantly composed of SiO2 and Al2O3 with small
amounts of Fe2O3 which together account for 93.06%and 90.79% by mass of the total ash content from TPS-1
and TPS-2 respectively. CaO content of fly ash has a relatively low value of 1.3 and 1.2 for TPS-1 and TPS-2. According to the ASTM C618, this fly ash can be classified as class F for having a less than 10% CaO content and a greater than 70% content of SiO2, Al2O3 and Fe2O3 altogether [17]. The loss on ignition (LOI), a measure
of unburnt carbon in the fly ash was reported to be having a low value of 0.13 and 0.8 for TPS-1 and TPS-2 respectively. These LOI values can be used as an indicator for the efficiency of the combustion chamber at the thermal power station.
5.1.2 Particle Size Analysis
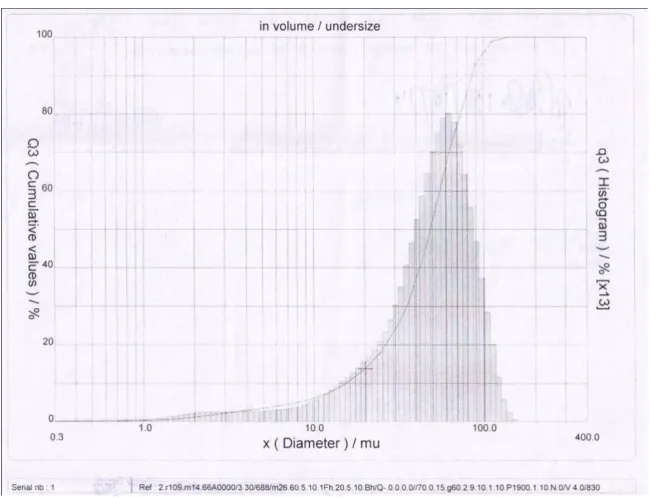
Particle size distribution of fly ash samples was analysed using particle size analyser (CILAS PARTICLE SIZE ANALYSER 920L) which provides diffraction data and stores it as volume percentage against the particle size as shown in Fig 5.1 and 5.2.
Vol. 6, Issue 2, February 2017
Fig 5.2. Particle Size Distribution of Fly Ash from TPS-2
Results of particle size analysis of fly ash samples collected from TPS-1 and TPS-2 are represented in Table 5.2:
Table 5.2: Particle size analysis of FA-1 and FA-2
Sample
Particles finer than (Vol %) Diameter (μm) at
10 (mu)
5 (mu)
2 (mu)
1 (mu)
10 Vol% of particles
(d10)
50Vol% of particles
(d50)
90 Vol% of particles
(d90)
100 Vol% of particles (d100)
Mean Dia (mu)
TPS-1 9.34 4.84 1.88 0.78 10.60 42.79 92.19 180.00 48.35
TPS-2 6.19 3.60 1.27 0.40 15.35 48.74 85.90 140.00 50.52
Particle size distribution shows weather a material is fine, coarse, well graded or poorly graded and helps in the classification of the coal ashes. The particle size distribution of fly ash mainly depends on firing condition, initial pulverization of coal and sedimentation in lagoons, which has the greatest influence on the grading of fly ash [18]. Granulometric data for fly ashes and their size fractions in Table 3.2 show that d(90) and d(50) values are
Vol. 6, Issue 2, February 2017
particles plays an important role in determining its adsorptive capacity. It was observed that for effective adsorption smaller particle size and larger surface area gives higher adsorbate removal at equilibrium [19]. With smaller particle size, equilibrium is more easily achieved and nearly full adsorption capability can be attained owing to reduction in internal diffusion and mass transfer limitation for penetration of the adsorbate into the adsorbent. The effective specific surface area decreases with increasing particle size, as a result of which the saturation adsorption per unit mass of the adsorbent will also decrease [20]. Therefore, FA-1 exhibited higher adsorption capacity in comparison to FA-2 as increase in percentage of finer particles in FA-1 resulted in the increase in total surface area which provided more active sites for the adsorption of phenol at smaller particle sizes [21, 22].
B. BATCH STUDIES
5.2.1 Effect of pH on Adsorption
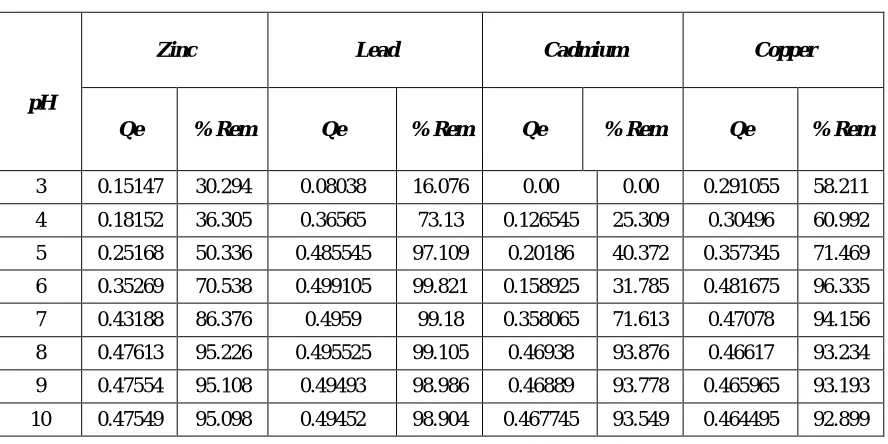
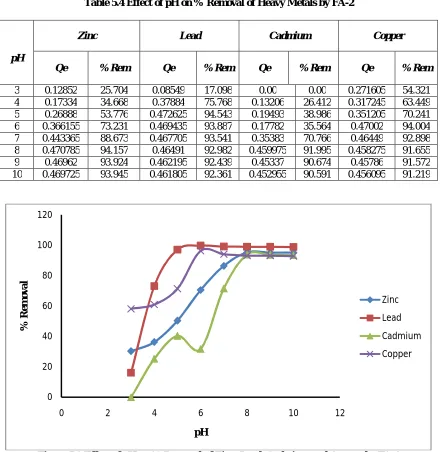
The pH of the solution is one of the most important variables that has a marked influence on the uptake of heavy metals since it determines the surface charge of the adsorbent and the degree of ionisation of the adsorbate. Figure 5.3 and 5.4 shows the effect of pH on % removal of four heavy metals zinc, lead, cadmium and copper at a heavy metal concentration of 100 mg/l and a fly ash concentration of 20 g/l. Figure 5.3 shows the % removal by fly ash from TPS-1 and figure 5.4 shows the % removal by fly ash from TPS-2. It was evident from the plots that generally the amount of heavy metal adsorbed increased as pH increased and sharply reached 90% at a fixed pH value for each metal ion. As pH increased from 3 to 8 fly ah particles became more negatively charged as a result of which electrostatic attractive forces increased cationic metal ion adsorption. However the % removal of heavy metal ion by FA-1 and FA-2 was different for each metal ion as well as for the type of fly ash used. Maximum pH was fixed at 10 to obtain high adsorption and prevent the precipitation of heavy metal ions.
Fly ash from TPS-1 showed that more than 90% of the four metal ions were removed at pH 8 beyond which metal ions started precipitating. Optimum sorption capacity for zinc was reported 95.226% at ph 8 whereas for copper it was 96.335% at pH 6. Cadmium removal increased with increasing pH from 0% at pH 3 to 93.876% at pH 8. For lead amount adsorbed sharply increased from 73.13% at pH 4 to 99.821% at pH 6.
According to the plots obtained for the effect of pH on % Removal of metal ions by fly ash from TPS-2, it was obtained that the maximum metal removal occurred over a narrow pH range of 5 to 8. In the case of zinc, adsorption increased from 25.704% at pH 3 to 94.157% at pH 8. The maximum removal of 94.543% for lead occurred at pH 5. With the increasing pH value, the copper removal rate increased and maximum removal 94.004 % occurred at pH 6. Cadmium ions showed maximum adsorption at pH 8 with 91.995% metal removal.
The results obtained above are in close agreement with those obtained by other research studies. It was shown by Widi et al. that at pH value higher than 6, metal precipitation occurs for lead ions so consequently beyond this pH lead adsorption decreases and maximum adsorption occurred at pH 5 [23]. Jinjing et al. showed that at pH 6, the removal rate of copper reached the maximum of 99.60% [24]. According to Agarwal et al. when the Zn2+ ions concentration was 20 mg/l, the maximum removal efficiency of Zn2+ ions has been increased from 49.05% to 98.7% with the increase in pH of the solution from 5.89 to 8.5 [25]. Batch studies conducted by Rao et al. showed that fly ash removed 93% of the cadmium in the wastewater in the pH range 7 to 8 [26].
The results showed that the adsorption of heavy metal cations is strongly dependent on pH and the percent ion sorbed increases sharply over a narrow pH range. The oxides of SiO2, Fe2O3 and Al2O3 found on the
Vol. 6, Issue 2, February 2017
The increase in adsorption with increasing pH over a narrow range can also be explained by metal cation hydrolysis reactions [29]. Divalent metal cations in aqueous solutions hydrolyse according to the following generalized expression shown below-
M2+ (aq) + nH20 = M (OH)2-n + nH+
Hydroxyl-metal complexes adsorb with higher affinity as compared to hydrated metal ions because free energy required for adsorption is reduced by hydroxyl group formation on the metal ion [30]. The distribution of various hydroxyl complexes depends on pH of the solution, therefore the adsorption of metal ions can be related to the change in availability of hydroxyl metal complex. At low pH the surface of adsorbent is positively charged which will adsorb the M(OH)2-n complex formed in the solution. However, at very high pH formation
of metal hydroxides and precipitation decreases the rate of adsorption [31].
Effect of pH on removal of heavy metal ions using other adsorbents was also investigated by several other studies and their values were compared with those obtained by fly ash. It was shown by Omar et al. that Cu2+ and Zn2+ were effectively adsorbed in the pH range 4 to 8 and the maximum adsorption using peanut husk charcoal occurred at pH 6 and 7, respectively, while the maximum adsorption of Cu2+ and Zn2+ ions using natural zeolite occurred at pH 6 and the maximum adsorption for fly ash occurred in the pH range 6 to 8 [32]. Similar results were also obtained by Rodda et al. [33] for heavy metal ions sorption onto agricultural waste sorbents. The effect of solution pH on the removal of Pb2+ and Cd2+ with pine sawdust was studied by Hidalgo et al. and optimum pH range obtained was 3 to 9 [34]. The maximum biosorption of Cd2+ and Pb2+ on dried activated sludge was shown to be at pH 6 and 4 respectively by Wang et al [35]. Hence, it can be explained that % Removal of heavy metal ions increases by increasing pH, because at higher pH the adsorbent surface is negatively charged and deprotonated which facilitates the attraction between metal cations and adsorbent surface [36].
Table 5.3 Effect of pH on % Removal of Heavy Metals by FA-1
pH
Zinc Lead Cadmium Copper
Qe % Rem Qe % Rem Qe % Rem Qe % Rem
3 0.15147 30.294 0.08038 16.076 0.00 0.00 0.291055 58.211
4 0.18152 36.305 0.36565 73.13 0.126545 25.309 0.30496 60.992
5 0.25168 50.336 0.485545 97.109 0.20186 40.372 0.357345 71.469
6 0.35269 70.538 0.499105 99.821 0.158925 31.785 0.481675 96.335
7 0.43188 86.376 0.4959 99.18 0.358065 71.613 0.47078 94.156
8 0.47613 95.226 0.495525 99.105 0.46938 93.876 0.46617 93.234
9 0.47554 95.108 0.49493 98.986 0.46889 93.778 0.465965 93.193
Vol. 6, Issue 2, February 2017
Table 5.4 Effect of pH on % Removal of Heavy Metals by FA-2
pH
Zinc Lead Cadmium Copper
Qe % Rem Qe % Rem Qe % Rem Qe % Rem
3 0.12852 25.704 0.08549 17.098 0.00 0.00 0.271605 54.321 4 0.17334 34.668 0.37884 75.768 0.13206 26.412 0.317245 63.449 5 0.26888 53.776 0.472625 94.543 0.19493 38.986 0.351205 70.241 6 0.366155 73.231 0.469435 93.887 0.17782 35.564 0.47002 94.004 7 0.443365 88.673 0.467705 93.541 0.35383 70.766 0.46449 92.898 8 0.470785 94.157 0.46491 92.982 0.459975 91.995 0.458275 91.655 9 0.46962 93.924 0.462195 92.439 0.45337 90.674 0.45786 91.572 10 0.469725 93.945 0.461805 92.361 0.452955 90.591 0.456095 91.219
Figure 5.3 Effect of pH on % Removal of Zinc, Lead, Cadmium and Copper by FA-1 (Adsorbent dosage of 20g/l, Ci of 100 mg/l)
0 20 40 60 80 100 120
0 2 4 6 8 10 12
%
R
e
m
o
v
al
pH
Zinc
Lead
Cadmium
Vol. 6, Issue 2, February 2017
Figure 5.4 Effect of pH on % Removal of Zinc, Lead, Cadmium and Copper by FA-2 (Adsorbent dosage of 20g/l, Ci of 100 mg/l)
5.2.2 Effect of Metal Ion Concentration on Adsorption
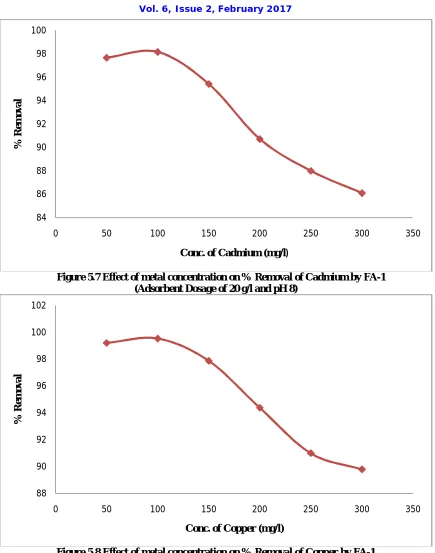
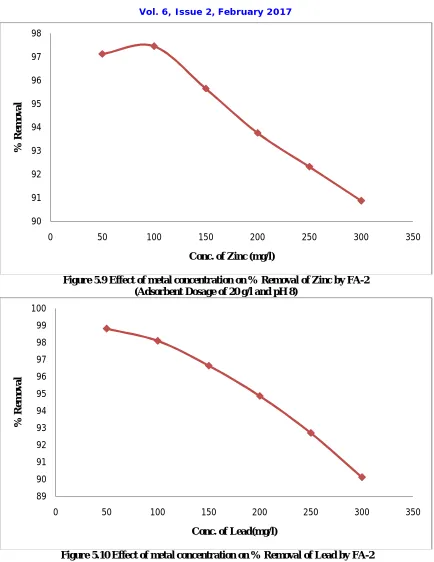
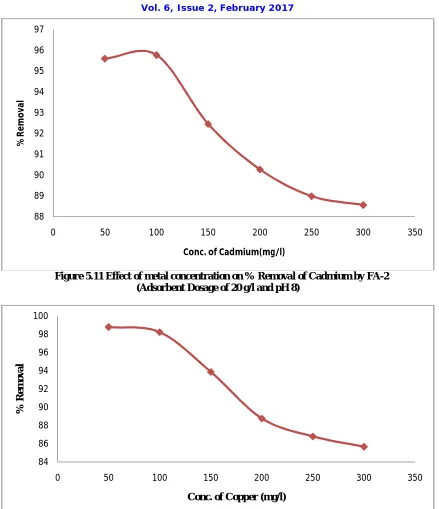
The rate of adsorption depends on the initial concentration of the adsorbate as it provides important driving force to overcome all mass transfer resistance of the metal between the aqueous and solid phase [37]. The effect of changing the initial concentration of metal ions on adsorption, while keeping the dosage of fly ash constant at room temperature and optimum pH values are illustrated in Fig. 5.5 to 5.12. With the increasing concentration from 50 to 100 mg/L, removal rate of metal ions was increased, while when the metal ion concentration increased from 100 to 300 mg/L, the tendency of removal rate was decreased.
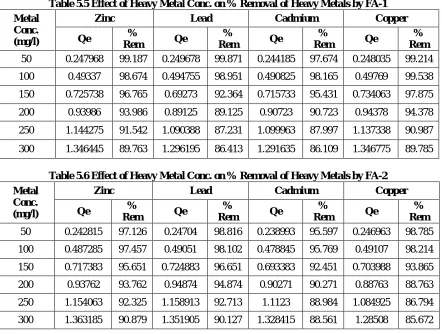
The influence of initial metal ion concentration to the removal rate was investigated for fly ash from TPS-1. It was observed that cadmium showed highest percentage removal of 98.165% from the aqueous solution at 100 mg/l metal ion concentration. It is evident that the % removal of zinc decreases from 99.187% to 89.763% at 50mg/l to 300mg/l, whereas % removal of lead decreases from 99.871% to 86.413% at the same metal ion concentration. Copper showed highest removal of 99.538% at 100mg/l after which it decreased with increasing metal ion concentration.
Fly ash from TPS-2 showed approximately similar results for the effect of metal ion concentration on percentage removal of heavy metals. Cadmium and zinc showed highest removal of 95.769% and 97.457% at an initial metal concentration of 100mg/l respectively. Removal of lead was highest of 98.816% at an initial metal concentration of 50 mg/l and copper also showed maximum removal of 98.785% at the same initial metal ion concentration. When the concentration of metal ions increased from 100mg/l to 300mg/l, significant decrease in removal efficiency was observed for all the four metal ions. Therefore, it is evident from the above data that all the metals showed above 95% removal at or below 100mg/l of initial metal ion concentration.
All the results reported above are compatible with the results obtained by earlier researchers. It was reported by Jinjing et al. [38] that with the increasing concentration from 5 to 50 mg/l, removal rate of copper increased to 99.52% which decreased with further increasing concentration to 400mg/l. It was shown by Sridevi et al.that as initial lead ion concentration increases, the percentage removal of lead ion decreases from 90.817% at 40 mg/l to 83.523% at 140 mg/l [39]. Reza et al. reported that at 100 mg/l the removal efficiency of zinc was above 90% which decreased subsequently with an increasing metal ion concentration [40]. In similar studies
0 20 40 60 80 100 120
0 2 4 6 8 10 12
%
R
e
m
o
v
al
pH
Zinc
Lead
Cadmium
Vol. 6, Issue 2, February 2017
conducted by Kumar et al., it was shown that the % removal of cadmium ions decreased above 100mg/l to 60.96% at 250 mg/l [41]. Based on the above studies optimum metal ion concentration for heavy metal removal by fly ash from TPS-1 and TPS-2 was fixed at 50mg/l for copper and lead whereas 100mg/l for cadmium and zinc.
At the beginning when the initial concentration of metal ions is high, the percentage of removal is high due to larger area of the ash being available for the adsorption of metal ions. When the concentration becomes greater than 100mg/l, the percentage removal decreases due to saturation of active sites present in the adsorbent at certain concentration [42]. Adsorbent has a limited or fixed number of active sites and at a certain metal ion concentration the active sites becomes used up and saturated and any further increase in the concentration of metal ion will only lead to a decrease in the percentage removal as the active sites are already occupied, hence more metal ions will be remain in solution after adsorption. However, amount adsorbed (Qe) increases with initial metal ion concentration. This is due to the fact that increase in the concentration of metal ions led to an increase in the number of metal ions available for binding to the active sites of fly ash which in turn increased collision between the ions and adsorbent and hence increased the driving force to overcome resistance to mass transfer and thus an increase in adsorption amount was observed [43]. Hence, this is the major mechanism of the effect of the metal ion concentration in aqueous phase on adsorption process.
Table 5.5 Effect of Heavy Metal Conc. on % Removal of Heavy Metals by FA-1 Metal
Conc. (mg/l)
Zinc Lead Cadmium Copper
Qe %
Rem Qe
%
Rem Qe
%
Rem Qe
% Rem
50 0.247968 99.187 0.249678 99.871 0.244185 97.674 0.248035 99.214
100 0.49337 98.674 0.494755 98.951 0.490825 98.165 0.49769 99.538
150 0.725738 96.765 0.69273 92.364 0.715733 95.431 0.734063 97.875
200 0.93986 93.986 0.89125 89.125 0.90723 90.723 0.94378 94.378
250 1.144275 91.542 1.090388 87.231 1.099963 87.997 1.137338 90.987
300 1.346445 89.763 1.296195 86.413 1.291635 86.109 1.346775 89.785
Table 5.6 Effect of Heavy Metal Conc. on % Removal of Heavy Metals by FA-2 Metal
Conc. (mg/l)
Zinc Lead Cadmium Copper
Qe %
Rem Qe
%
Rem Qe
%
Rem Qe
% Rem
50 0.242815 97.126 0.24704 98.816 0.238993 95.597 0.246963 98.785
100 0.487285 97.457 0.49051 98.102 0.478845 95.769 0.49107 98.214
150 0.717383 95.651 0.724883 96.651 0.693383 92.451 0.703988 93.865
200 0.93762 93.762 0.94874 94.874 0.90271 90.271 0.88763 88.763
250 1.154063 92.325 1.158913 92.713 1.1123 88.984 1.084925 86.794
Vol. 6, Issue 2, February 2017
Figure 5.5 Effect of metal concentration on % Removal of Zinc by FA-1 (Adsorbent Dosage of 20 g/l and pH 8)
Figure 5.6 Effect of metal concentration on % Removal of Lead by FA-1 (Adsorbent Dosage of 20 g/l and pH 6)
88 90 92 94 96 98 100
0 50 100 150 200 250 300 350
%
R
e
m
o
v
al
Conc. of Zinc(mg/l)
84 86 88 90 92 94 96 98 100 102
0 50 100 150 200 250 300 350
%
R
e
m
o
v
al
Vol. 6, Issue 2, February 2017
Figure 5.7 Effect of metal concentration on % Removal of Cadmium by FA-1 (Adsorbent Dosage of 20 g/l and pH 8)
Figure 5.8 Effect of metal concentration on % Removal of Copper by FA-1 (Adsorbent Dosage of 20 g/l and pH 6)
84 86 88 90 92 94 96 98 100
0 50 100 150 200 250 300 350
%
R
e
m
o
v
al
Conc. of Cadmium (mg/l)
88 90 92 94 96 98 100 102
0 50 100 150 200 250 300 350
%
R
e
m
o
v
al
Vol. 6, Issue 2, February 2017
Figure 5.9 Effect of metal concentration on % Removal of Zinc by FA-2 (Adsorbent Dosage of 20 g/l and pH 8)
Figure 5.10 Effect of metal concentration on % Removal of Lead by FA-2 (Adsorbent Dosage of 20 g/l and pH 5)
90 91 92 93 94 95 96 97 98
0 50 100 150 200 250 300 350
%
R
e
m
o
v
al
Conc. of Zinc (mg/l)
89 90 91 92 93 94 95 96 97 98 99 100
0 50 100 150 200 250 300 350
%
R
e
m
o
v
al
Vol. 6, Issue 2, February 2017
Figure 5.11 Effect of metal concentration on % Removal of Cadmium by FA-2 (Adsorbent Dosage of 20 g/l and pH 8)
Figure 5.12 Effect of metal concentration on % Removal of Copper by FA-2 (Adsorbent Dosage of 20 g/l and pH 6)
VI. ADSORPTION ISOTHERM
In order to successfully represent the dynamic sorptive behaviour and to examine the relationship
88 89 90 91 92 93 94 95 96 97
0 50 100 150 200 250 300 350
%
R
em
o
va
l
Conc. of Cadmium(mg/l)
84 86 88 90 92 94 96 98 100
0 50 100 150 200 250 300 350
%
R
e
m
o
v
al
Vol. 6, Issue 2, February 2017
description of the equilibrium state between the two phases composing the sorption system. Equilibrium adsorption processes in this study are described by Freundlich isotherms, governing the distribution of metal ions between liquid phase and the adsorbent at a constant temperature.
Freundlich isotherm is commonly empirical and is used to describe the adsorption characteristics for the heterogeneous surface [44]. Freundlich isotherm is used to describe adsorption in aqueous systems and supposes that the ratio between the amount of adsorbed metal ions and the concentration of metal ions in the liquid phase is not a constant at different concentrations. Freundlich isotherms were obtained by agitating the metal ion solution of a different concentration with fixed dosage of the adsorbent for a contact time greater than the equilibrium time, given in Table 5.5 and 5.6 above.
The Freundlich equation can be described by the following linearised form [45]: Log Qe = log K + (1/n) log Ce,
where,
Qe = amount adsorbed (mg/g) Ce = equilibrium concentration (mg/l) K = adsorption capacity
n = adsorption intensity
A plot of log Qe against log Ce gives straight line, the slope and intercept of which corresponds to 1/n and log K.
Freundlich adsorption isotherms for zinc, lead, cadmium and copper for FA-1 and FA-2 are shown in fig 6.1 to 6.8. Freundlich isotherm constants determined from the plot of log Qe versus log Ce are summarized in Table 6.2 and 6.4. The values of the Freundlich constants (K and n), indicating capacity and intensity of adsorption, respectively, are greater than unity for adsorption of all the four metal ions fulfilling the Freundlich isotherm condition of favourable adsorption.
The Freundlich isotherms are mainly empirical with a little theoretical basis and are suitable for a highly heterogeneous surface over a restricted range of concentration, indicating a multi-layer adsorption [46]. The constant Kis an approximate indicator of adsorption capacity and ease of separation of heavy metal ion from aqueous solution, while 1/n is a function of distribution of bonded ions on the adsorbent surface and the strength of adsorption in the adsorption process [47]. Values of n between 1 and 10 represents beneficial adsorption, equals to 1 represents that the two phases are independent of the concentration and the values of K and n determine the steepness and curvature of the isotherm [48, 49].
From the data in table 6.2 and 6.4, it is evident that the value of n >1 indicating that the sorption of metal ions is favourable on the surface of FA-1 and FA-2. Also, the higher K values for all the four metal ions indicate greater adsorption capacity. The value of K in case of FA-1 for lead (0.468) is greater than that of copper (0.465) which in turn is greater than that of zinc (0.387) and cadmium has the least (0.300) value. The values of K for FA-2 also increase in the similar manner, lead (0.341) > copper (0.332) > zinc (0.243) > cadmium (0.175), although they are low in comparison to FA-1. These values follow the same order as shown by solid/water distribution ratio, Kd = Qe/Ce, determined at neutral pH 7 for FA-1, Pb (0.604) > Cu (0.080) > Zn
(0.031) > Cd (0.012). Similar ratios were also obtained for FA-2, and increased as pH increased indicating that the relative tendency for different heavy metal ions to bind to them follows identical order. Hence, it is evident from the above data that the adsorption capacity and intensity of fly ash from TPS-1 and TPS-2 gives satisfactory results on Freundlich adsorption isotherm.
Table 6.1 Parameters of Freundlich isotherms for adsorption by FA-1
S. No.
Zinc Lead Cadmium Copper Log Ce Log Qe Log Ce Log Qe Log Ce Log Qe Log Ce Log Qe
Vol. 6, Issue 2, February 2017
3 0.685966 -0.13922 1.058957 -0.15944 0.835912 -0.14525 0.50345 -0.13427 4 1.080193 -0.02694 1.337459 -0.05 1.268438 -0.04228 1.050921 -0.02513 5 1.325208 0.05853 1.504097 0.037581 1.47723 0.041378 1.352809 0.05589 6 1.487294 0.129189 1.610245 0.11267 1.619855 0.11114 1.48636 0.129295
Table 6.2 Adsorption isotherm constant for adsorption of heavy metals on FA-1
Heavy Metals Freundlich Equation
K (mg/g) n R2
Zinc 0.387 2.724 0.981
Lead 0.468 4.291 0.964
Cadmium 0.300 2.531 0.92
Copper 0.465 3.267 0.884
Table 6.3 Parameters of Freundlich isotherms for adsorption by FA-2
S. No.
Zinc Lead Cadmium Copper Log Ce Log Qe Log Ce Log Qe Log Ce Log Qe Log Ce Log Qe
1 0.157457 -0.61472 -0.22768 -0.60723 0.342719 -0.62161 -0.21645 -0.60737 2 0.405346 -0.31222 0.278296 -0.30935 0.626443 -0.31981 0.251881 -0.30886 3 0.814481 -0.14425 0.701006 -0.13973 1.053981 -0.15903 0.963906 -0.15243 4 1.096075 -0.02797 1.010809 -0.02285 1.289098 -0.04445 1.35168 -0.05177 5 1.283018 0.06223 1.260489 0.064051 1.439964 0.046222 1.518711 0.0354 6 1.437164 0.134555 1.47157 0.130946 1.535509 0.123334 1.633307 0.10893
Table 6.4 Adsorption isotherm constant for adsorption of heavy metals on FA-2
Heavy Metals Freundlich Equation
K (mg/g) n R2
Zinc 0.243 1.862 0.958
Lead 0.341 2.341 0.986
Cadmium 0.175 1.760 0.971
Vol. 6, Issue 2, February 2017
Figure 6.1 Freundlich adsorption isotherm of Zinc by FA-1
Figure 6.2 Freundlich adsorption isotherm of Lead by FA-1
y = 0.367x - 0.412 R² = 0.981
-0.7 -0.6 -0.5 -0.4 -0.3 -0.2 -0.1 0 0.1 0.2
-0.5 0 0.5 1 1.5 2
L
o
g
Q
e
Log Ce
y = 0.233x - 0.330 R² = 0.964
-0.7 -0.6 -0.5 -0.4 -0.3 -0.2 -0.1 0 0.1 0.2
-1.5 -1 -0.5 0 0.5 1 1.5 2
L
o
g
Q
e
Vol. 6, Issue 2, February 2017
Figure 6.3 Freundlich adsorption isotherm of Cadmium by FA-1
y = 0.395x - 0.523 R² = 0.92
-0.7 -0.6 -0.5 -0.4 -0.3 -0.2 -0.1 0 0.1 0.2
0 0.2 0.4 0.6 0.8 1 1.2 1.4 1.6 1.8
L
o
g
Q
e
Log Ce
y = 0.306x - 0.333 R² = 0.884
-0.7 -0.6 -0.5 -0.4 -0.3 -0.2 -0.1 0 0.1 0.2
-1 -0.5 0 0.5 1 1.5 2
L
o
g
Q
e
Vol. 6, Issue 2, February 2017
Figure 6.5 Freundlich adsorption isotherm of Zinc by FA-2
Figure 6.6 Freundlich adsorption isotherm of Lead by FA-2
y = 0.537x - 0.615 R² = 0.958
-0.7 -0.6 -0.5 -0.4 -0.3 -0.2 -0.1 0 0.1 0.2
0 0.2 0.4 0.6 0.8 1 1.2 1.4 1.6
L
o
g
Q
e
Log Ce
y = 0.427x - 0.467 R² = 0.986
-0.7 -0.6 -0.5 -0.4 -0.3 -0.2 -0.1 0 0.1 0.2
-0.5 0 0.5 1 1.5 2
L
o
g
Q
e
Vol. 6, Issue 2, February 2017
Figure 6.7 Freundlich adsorption isotherm of Cadmium by FA-2
Figure 6.8 Freundlich adsorption isotherm of Copper by FA-2
y = 0.568x - 0.758 R² = 0.971
-0.7 -0.6 -0.5 -0.4 -0.3 -0.2 -0.1 0 0.1 0.2
0 0.2 0.4 0.6 0.8 1 1.2 1.4 1.6 1.8
L
o
g
Q
e
Log Ce
y = 0.345x - 0.479 R² = 0.965
-0.7 -0.6 -0.5 -0.4 -0.3 -0.2 -0.1 0 0.1 0.2
-0.5 0 0.5 1 1.5 2
L
o
g
Q
e
Vol. 6, Issue 2, February 2017
VII. CONCLUSIONS AND FUTURE SCOPE
Summarised results with major conclusions drawn from this research are as follows:
Suratgarh Thermal Power Station (TPS-1), the first Super Thermal Power Station of Rajasthan has a total planned installed capacity of 1500 MW. Kota Thermal Power Station (TPS-2), Rajasthan's first major coal-fired power plant has 7 units with an installed capacity of 1240 megawatts.
Total coal consumed during the year 2012-2013 at TPS-1 and TPS-2 is 6.8178 mtpa and 6.2243 mtpa respectively. Fly ash generation and utilization in various fields at TPS-1 and TPS-2 in the year 2012-2013 was 2.125903 and 88.40% and 1.850390 and 123.71% respectively.
No work has so far been reported in adsorption of heavy metals and phenol from fly ash generated from TPS-1 and TPS-2.
According to the ASTM C618, FA-1 and FA-2 can be classified as class F for having a less than 10% CaO content and a greater than 70% content of SiO2, Al2O3 and Fe2O3 altogether. Siliceous or class F
fly ash is responsible for pozzolanic activity, which decreases by loss of ignition and such type of fly ash is produced by burning of anthracite or bituminous coal and possesses pozzolanic properties. This pozzolanic property of fly ash makes it a significant resource to be used in making cement and other ash based products. Therefore, amount of metal removed was high in case of class F fly ash on account of greater silico- aluminous content.
Granulometric data for fly ashes and their size fractions in show that d(90) and d(50) values are 92.19 and
42.79 for FA-1 and 85.90 and 48.74 for FA-2, respectively. The particle size of the fly ash from TPS-1 ranges from 0.30 to 180 μm and from TPS-2 ranges from 0.30 to 140 μm. It was found that there were some significant differences in particle size distribution of both the types of fly ashes.
Fly ash from TPS-1 has a higher percentage of finer particles than TPS-2 as indicated by granulometric data. The size of fly ash particles plays an important role in determining its adsorptive capacity. It was observed that for effective adsorption smaller particle size and larger surface area gives higher adsorbate removal.
Therefore, FA-1 exhibited higher adsorption capacity in comparison to FA-2 as increase in percentage of finer particles in FA-1 resulted in the increase in total surface area which provided more active sites for adsorption of the metal ions and phenol at smaller particle sizes.
It can be concluded that generally the amount of heavy metals adsorbed increased as pH increased and sharply reached more than 90% at a fixed pH value for each metal ion. Therefore it can be attributed that the pH of the solution is one of the most important parameters that has a marked influence on the uptake of heavy metals since it determines the surface charge of the fly ash and the degree of ionisation of the adsorbate.
it was observed that when the concentration becomes greater than 100mg/l, the percentage removal decreased due to saturation of active sites present in the adsorbent at certain concentration. So it was concluded that fly ash has a limited or fixed number of active sites and at a certain metal ion concentration the active sites becomes used up and any further increase in the concentration of metal ion will only lead to a decrease in the percentage removal, hence more metal ions will be remain in solution after adsorption.
The equilibrium data could be described by the Langmuir and Freundlich isotherm equations. However, the Freundlich model better represented the adsorption process, in comparison to the Langmuir model as indicated by correlation coefficient values obtained for both the approaches.
Vol. 6, Issue 2, February 2017
Therefore, it is evident that the adsorption capacity of fly ash from TPS-1 was found to be higher in comparison to TPS-2 giving satisfactory results on Freundlich adsorption isotherm.
Recommendations and suggestions for future work:
More studies should be carried out on how to improve the adsorption capability of coal fly ash by subjecting it to physico-chemical treatments to increase its specific surface area and to enhance development of micropores within the fly ash, in order to change its adsorption capacity.
Adsorption capacity of fly ashes from different power stations can be compared and subjected to direct treatment of waste streams to gauge their suitability and efficiency to promote large scale use of non-conventional adsorbents.
The waste water generated from any industry may have many other pollutants besides studied heavy metals, thus adsorptive removal of these adsorbates in the presence of other metal ion / pollutant may be performed.
Physical and chemical characterisation study for exposed and unexposed fly ash may be done to have direct evidence of adsorptive removal of heavy metals.
REFRENCES
[1] Weber Jr WJ, McGinley PM, Katz LE. Sorption phenomena in subsurface systems: concepts, models and effects on contaminant fate
and transport. Water Res; 25(5):499–528 (1991).
[2] Nagham A. Ageena, The use of Local Sawdust as an Adsorbent for the Removal of Copper Ion from Wastewater using Fixed Bed
Adsorption, J., 28(2), 859-860 (2010).
[3] Renge V. C., Khedekar S. V. and Shraddha V. Pande., 2012. Removal of Heavy Metals from Wastewater Using Low Cost Adsorbents: A
Review. Sci. Revs. Chem. Commun.: 2(4), 580-584 (2012).
[4] Zacaria R., Adsorption of several metal ions onto low-cost biosorbent: kinetic and equilibrium studies. Environ. Sci. Technol. 36:
2067-2073 (2002).
[5] Dasmahapatra, G.P., Pal T.K.,. Bhadra A.K and Buhattacharya B. Studies on separation characteristics of hexavalent chromium from
aqueous solution by fly ash. Separation Science and Technology 31, 2001–2009 (1996).
[6] Chong, K.H. and Volesky, B. Description of 2-metal biosorption equilibria by Langmuir-type models. Biotechnology and
Bioengineering, vol. 47, no. 4, p. 451-460 (1995).
[7] Kumar Vimal, 2003. “Key Note Address”, 3
rd
International Conference- Fly Ash Utilisation and Disposal, New Delhi, India 19-21 (February 2003).
[8] Aswar, W. R. Fly ash disposal and utilization: National scenario, International Conference on Fly ash Disposal and Utilization, New Delhi, India.80 -86,(2001).
[9] Pollard S., Fowler G., Sollars C., and Perry R., "Low-cost adsorbents for waste and wastewater treatment: A review," Science of the
Total Environment, vol. 116, pp. 31-52, (1992).
[10] Seco, A., Marzal, P., Gabaldon, C. & Ferrer, J. Adsorption of Heavy Metals from Aqueous Solutions onto Activated Carbon in Single
Cu and Ni Systems and in Binary Cu-Ni, Cu-Cd and Cu- Zn Systems. Journal of Chemical Technology and Biotechnology, 68(1):
23-30(1997).
[11] Aksu, Z. and Yener, J. J. Environ. Sci. Health A 34, 1777 (1999).
[12] Bayat B., Comparative study of adsorption properties of Turkish fly ashes –I. The case of nickel (II), copper (II) and zinc (II), J.
Hazard. Mater. B95 251–273(2002).
[13] Ayala J., Bianco F., Garcia P., Rodriguez P., Sancho J., Asturian fly ash as a heavy metals removal material, Fuel 77 1147–1154(1998).
[14] Apak R., Tutem E., Hugul M., Hizal J. Heavy metal cation retention by unconventional sorbents (red muds and fly ashes), Water Res.
32 430–440(1998).
[15] Gamze Guclu., Ebru Al., Serkan Emik., Tulin B. Iyim., Saadet Ozgumus., Mustafa Ozyurek., Polym. Bull. Vol 65, pp 333–346, (2010).
[16] Ćurković, L., Cerjan-Stefanovic, Š & Rastovèan-Mioè, A. Batch Pb2+ and Cu2+ Removal by Electric Furnace Slag. Water Resource, 35(14):3436-3440 (2001).
[17] ASTM C-618. Standard speciation for fly ash and raw or calcined natural pozzolan for uses as a mineral admixture in Portland cement
concrete. American Society for Testing and Materials, Philadelphia, Pennsylvania (1993).
[18] A. Trivedi, S. Singh, Geotechnical and geoenvironmental properties of power plant ash, Journal of the Institution of Engineers.
India.85: 93-99 (2004).
[19] P. N. Kao, J. H. Tzeng, and T. L. Huang, Removal of chlorophenols from aqueous solution by fly ash. Journals of Hazardous Materials
76, p. 237-249 (2000).
[20] K. Banerjee, P. N. Cheremisinoff, S. L. Cheng, Adsorption kinetics of o-xylene by fly ash. Water Res., 31(2), 249–261 (1997).
[21] K K Wong, C K Lee, K S Low, M J Haron. Removal of Cu and Pb by tartaric acid modified rice husk from aqueous solutions.
Vol. 6, Issue 2, February 2017
[22] S.K. Yadav, D.K. Singh, S. Sinha, Chemical carbonization of papaya seed originated charcoals for sorption of Pb (II) from aqueous
solution, J Environ Chem Eng, 2 pp. 9–19 (2014).
[23] Widi A., Prasetya A., Endang Tri W., Bendiyasa I. M.; The Adsorption of Lead from Aqueous Solutions Using Coal Fly Ash : Effect of
Crystallinity, World Academy of Science, Engineering and Technology Vol:5 06-29 (2011).
[24] Jinjing Luo, Huazhen Shen, Hanna Markström, Zhongye Wang, Qiang Niu, Removal of Cu2+ from Aqueous Solution using Fly Ash ,
Journal of Minerals & Materials Characterization & Engineering, Vol. 10, No.6, pp.561-571, (2011).
[25]Agarwal Ajay K., Kadu Mahendra S., Pandhurnekar Chandrashekhar P., Muthreja Ishwardas L. an investigation of characteristics of a
low cost adsorbent for removal of zn2+ ions from aqueous solution Journal of Environmental Research And Development Vol. 9 No. 01,
July-September (2014).
[26] Rao G.A.K., Adsorption of Cadmium and Chromium from Wastewaters by Peat and Fly ash, M.Sc. Thesis, University of Regina, Regina, Saskatchewan, Canada, (1989).
[27] PandayK, .K., PrasadG, . and Singh,V .N., Copper (ll) Removal from Aqueous Solutions by Fly Ash, Water Res.,V ol.19, pp.867-873,
(19 85).
[28] Bayat, B., Combined Removal of Zinc(II) and Cadmium (ll) from Aqueous Solutions by Adsorption onto High-Calcium Turkish Fly
Ash, Water, Air and Soil Pollut., Vol. 136, pp. 66-92, (2002).
[29] Elliott, H.A. and Huang, C.P., Adsorption Characteristicso f Some Cu(II) Complexes on Alumino Silicates,W ater Res.,V ol.15,
pp.849-855, (19 81).
[30] Alinnor, I. J. Adsorption of Heavy Metal Ions from Aqueous Solution by Fly ash. Fuel, 86, 853-857 (2007).
[31] Mousavi H. Z., Hosseynifar A., Jahed V. and Dehghani S. A. M. REMOVAL OF LEAD FROM AQUEOUS SOLUTION USING
WASTE TIRE RUBBER ASH AS AN ADSORBENT Brazilian Journal of Chemical Engineering Vol. 27, No. 01, pp. 79 - 87, January -
March, (2010).
[32] Omar E. Abdel Salam, Neama A. Reiad,, Maha M. ElShafei, A study of the removal characteristics of heavy metals from wastewater
by low-cost adsorbents, Journal of Advanced Research 2, 297-303 (2011).
[33] Rodda DP, Johnson BB, Wells JD. The effect of temperature and pH on the adsorption of copper (II), lead(II) and zinc(II) onto
goethite. J Colloid Interface Sci; 161(1):57–62 (1993).
[34] Hidalgo Vázquez A.R., Alfaro Cuevas Villanueva R., Márquez Benavides L. and Cortés Martínez R., Cadmium and Lead Removal
From Aqueous Solutions Using Pine Sawdust as Biosorbent Journal of applied sciences in environmental sanitation, Volume 6, Number 4:
447 462, December, (2011).
[35] Wang X., Xia S., Chen L., Zhao J., Chovelon J., Nichole J., Biosorption of cadmium(II) and lead(II) ions from aqueous solutions onto
dried activated sludge, Journal of Enviornmental Sciences Vol. 18, 5. pp. 840-844, (2006).
[36] Lohani M.B., Singh A., Rupainwar D.C. and Dhar D.N., Studies on efficiency of guava (Psidiumguajava) bark as bioadsorbent for
removal Hg(II) from aqueous solutions, J. of Hazard Mater.,159, 626-629 (2008).
[37] Aksu Z., Akpinar D., Modelling of simultaneous biosorption of phenol and nickel (II) onto dried aerobic activated sludge [J].
Separation Purification Technology, 21: 87-99, (2000).
[38] Jinjing L., Huazhen S., Hanna M., Zhongye W., Qiang N., Removal of Cu2+ from Aqueous Solution using Fly Ash Journal of
Minerals & Materials Characterization & Engineering, Vol. 10, No.6, pp.561-571, (2011).
[39] Sridevi V., Chandana Lakshmi M.V.V., Satya V., Adsorption Isotherm studies of lead from aqueous solution using fly ash,
International Journal of Innovative Research in Science, Engineering and Technology Vol. 2, Issue 11, November (2013).
[40] Reza K., Hossein Z., Abouzar F., Mohamad O., Ghasem D., Removal of zinc from aqueous phase by charcoal ash, World applied
sciences journal 13 (2): 331-340, (2011).
[41] Kumar S., Mishra A.K., Upadhyay M., A study on adsorption of Cd(II) from aqueous solution using fly ash American International Journal of Research in Science, Technology, Engineering & Mathematics 6(2), March-May, pp. 133-139 , (2014).
[42] Tsai W.T. and Chen H.R., Removal of malachite green from aqueous solution using low-cost chlorellabasedbiomass, J Hazard Mater.,
175(1-3), 844-849 (2010).
[43] Vimala R., and Das N., “Biosorption of Cadmuim(II) and Lead(II) from aqueous solution using mushrooms: a comparative study, J.
Hazard. Mater, Vol.168, pp 376-382, (2009).
[44] Hutson N.D., and Yang R.T., Adsorption. J. Colloid Interf Sci., pp 189 (2000).
[45] Freundlich, H.M, Uber die adsorption in lusungen, Z. Phys. Chem., vol.57, p. 385 –470 (1906).
[46] Juang R.S, Wu F.C., Tseng R.L., J. Chem. Eng. Data 41 487-492 (1996).
[47] Jain C K, Adsorption of zinc onto bed sediments of the River Ganga; Adsorption models and kinetics [J]. Hydrological Sciences
Journal-des Sciences Hydrologiques, 46(3): 419– 434 (2001).
[48] Kadirvelu K., Namasivayam C., Environmental Technology 21(10) 1091-1097 (2000).