Effective Traffic Management for Two major
junctions of Pune city by Predictive analysis
and Design of Simulation Model
Kalyani Kulkarni 1, Sneha Khedekar2, Ninad Pande3
Assistant Professor, Department of Civil Engineering, AISSMS College of Engineering, Pune, Maharashtra, India1
Assistant Professor, Department of Civil Engineering, AISSMS College of Engineering, Pune, Maharashtra, India2
U.G. Student, Department of Civil Engineering, AISSMS College of Engineering, Pune, Maharashtra, India3
ABSTRACT: This paper deals with traffic volume studies to determine the volume of traffic moving on the roads and classification of roadway vehicles at a particular section during particular time. Volumes of a day or an hour can vary greatly depending on the different day of the week or different time period of a day. Traffic volume survey is determination of number, movement and classification of roadway vehicles at a given location.
Traffic volume is the most delicate information to implement transportation planning, design and to start new transportation modes. In this paper we have chosen simulation model as the problem of uncontrolled traffic is rising in the city. The management of traffic has become a necessity. The model and its analysis are helpful for prediction of the traffic volume at the end of five years at selected junctions in Pune city facing maximum traffic congestion.
KEYWORDS: Traffic volume, simulation model, major junctions, prediction, five years.
I. INTRODUCTION
Effective traffic management is the need of the hour as the vehicular population and the problem caused by traffic congestion are ever increasing. There is no system adopted for traffic management in our city; however no mechanism has been implemented for co-operation and co-ordination.
Several studies related to traffic density, volume, congestion problems were conducted. This covered traffic systems like bus rapid transit, non motorised transport and public transport.
Due to scarcity of resources and desire to streamline the arrangement, a simulation model has been put to use. We plan to design a simulation model that will help us predict the traffic situation as well as the traffic volume at a particular junction for future.
Through this simulation model we can apply the remedial measures such as changes in road dimension, alternative routes to avoid traffic congestion, construction of flyovers or subways.
II. RELATED WORK
i. Analysis of the Construction Traffic Management Information (International) -Linda Ming
With China’s rapid development of information technology and widely used in the transportation industry, on transport had a profound impact. Therefore, only the information continue to promote the construction of traffic management with the help and application of modern information processing technology, our transportation industry to adapt to the traffic construction, production and management of all aspects of development needs, better serve the public.
With China’s rapid economic development, transportation management and service highlights the growing problem is not high. To this end, an urgent need of information technology into the construction of traffic and transport management to the whole process, therefore, the need to strengthen traffic management the construction of information for the public to provide more information services to the transportation industry to enhance the management level.
ii. The traffic control department in the role of rural road construction (national) - Anonymous (Science Direct)
Speed up rural road construction is the transport sector in the new period of a glorious and arduous task. We must clearly understand the situation, unify the thinking up to the central strategic plan, give the whole transport sectors ability to overcome difficulties, do solid work, and earnestly to the work of rural road construction as the focus of the traffic good job in order to build a new socialist in rural areas to make new and greater contributions.
Rural road constructions is to promote the building of new socialist countryside important content is to speed up rural economic development, adjusting the agricultural structure, to protect the farmers an important foundation for sustained income growth conditions, but also improve the road transport network, an important component. Building a new socialist countryside, we must comprehensively accelerate the pace of rural road construction. In accordance with the requirements of building a socialist new countryside and further speed up the country road construction in rural areas is the transport sector in the new period of a glorious and arduous task. We must clearly understand the situation, unify the thinking up to the central strategic plan, give the whole transport sectors ability to overcome difficulties, do solid work, and earnestly to the work of rural road construction as the focus of the traffic good job in order to build a new socialist in rural areas to make new and greater contributions.
III. AIM & OBJECTIVES
The aim of the study is to design the simulation model for forecasting and solving issues related to traffic congestion by predicting the traffic volume in the future from the analysis of the current traffic volume.
To achieve this aim following objectives were set:
V. DATA COLLECTION
For the predictive analysis we needed the current traffic volume. Out of the many methods available for finding the current traffic volume we selected the manual method. Considering the generalized traffic scenario at both the junctions, for collection of this traffic volume we selected the time slots of one hour in the peak hours in the morning and evening and one hour in the slack hours in the afternoon. We recorded the traffic by taking video recording.
a) NAL STOP
This junction connects prime commercial areas such as Deccan and Shivajinagar. It also connects prime residential areas like Kothrud, Karvenagar and Warje. These areas have large number of schools and colleges and are considered the heart of the city. Thus we observe crowded roads having mixed traffic conditions.
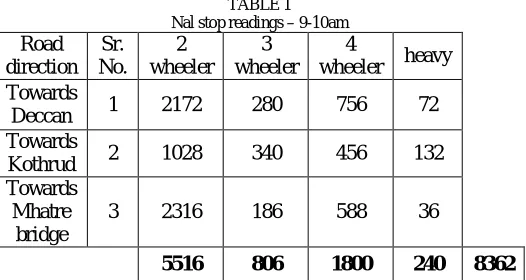
TABLE 1 Nal stop readings – 9-10am Road
direction Sr. No.
2 wheeler
3 wheeler
4
wheeler heavy Towards
Deccan 1 2172 280 756 72 Towards
Kothrud 2 1028 340 456 132 Towards
Mhatre bridge
3 2316 186 588 36
5516 806 1800 240 8362
Table 1 describes readings for time 9-10am for 2, 3, 4 wheeler and heavy vehicles at Nalstop towards Deccan, Kothrud & Mhatre bridge.
TABLE 2 Nalstop readings – 2-3pm
Road
direction Sr.No 2 wheeler
3 wheeler
4
wheeler heavy Towards
Deccan 1 1184 288 536 100 Towards
Kothrud 2 1624 356 672 108 Towards
Mhatre bridge
3 1902 240 534 66
Table 2 describes readings for time 2-3pm for 2, 3, 4 wheeler and heavy vehicles at Nalstop towards Deccan, Kothrud & Mhatre bridge.
TABLE 3 Nal stop readings – 7-8 pm
Table 3 describes readings for time 7-8pm for 2, 3, 4 wheeler and heavy vehicles at Nalstop towards Deccan, Kothrud & Mhatre bridge.
From the above data we get to know about the current overall traffic scenario at Nal Stop. From the analysis of this data we can clearly see that the two wheeler traffic is the maximum compared to the other three vehicle types.
b) KESHAVNAGAR – MUNDHWA JUNCTION
The area connected by this junction has largely developed over the past few years due to many corporate companies having their large campuses and also development of residential and commercial places like Magarpatta City, Amanora Park Town, Seasons Mall and many other famous hotel chains.
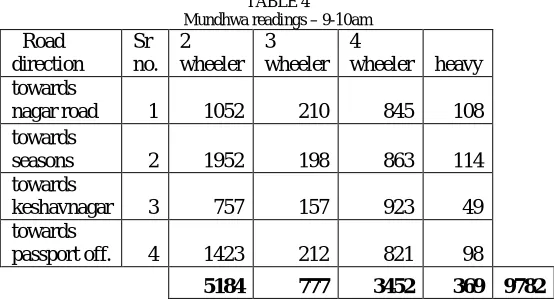
TABLE 4 Mundhwa readings – 9-10am Road
direction
Sr no.
2 wheeler
3 wheeler
4
wheeler heavy towards
nagar road 1 1052 210 845 108 towards
seasons 2 1952 198 863 114 towards
keshavnagar 3 757 157 923 49 towards
Road
direction Sr.no 2 wheeler
3 wheeler
4
wheeler heavy Towards
Deccan 1 1920 432 858 120 Towards
Kothrud 2 2234 376 875 112 Towards
Mhatre bridge
3 1452 225 658 62
Mundhwa readings – 2-3pm
Table 5 describes readings for time 2-3pm for 2, 3, 4 wheeler and heavy vehicles at Mundhwa towards Nagar road, Seasons, Keshavnagar & Passport office.
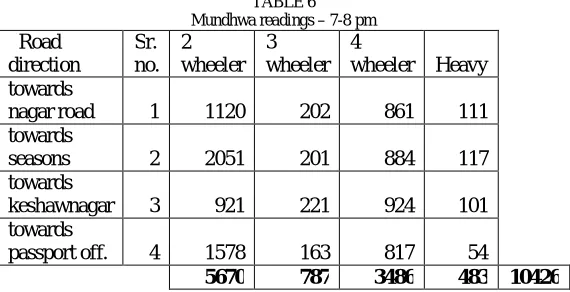
TABLE 6 Mundhwa readings – 7-8 pm Road
direction
Sr. no.
2 wheeler
3 wheeler
4
wheeler Heavy towards
nagar road 1 1120 202 861 111 towards
seasons 2 2051 201 884 117 towards
keshawnagar 3 921 221 924 101 towards
passport off. 4 1578 163 817 54
5670 787 3486 483 10426
Table 6 describes readings for time 7-8pm for 2, 3, 4 wheeler and heavy vehicles at Mundhwa towards Nagar road, Seasons, Keshavnagar & Passport office.
This suggests that the two wheeler based traffic is the maximum. But as compared to the other areas of the city, the 4 wheeler based traffic is greater as the connecting areas have large commercial and corporate zones.
VI. ANALYSIS
Analysis of data collected was divided in 2 cases:
1. Case A: Keeping direction and time constant (vehicular type analysis) NAL STOP JUNCTION
Time : 9-10am
Vehicle type: Two wheeler
Road direction
Sr no.
2 wheeler
3 wheeler
4
wheeler heavy Towards
nagar road 1 639 103 430 53 Towards
seasons 2 986 91 523 49 Towards
keshawnagar 3 452 67 578 43 Towards
passport off. 4 782 107 334 19
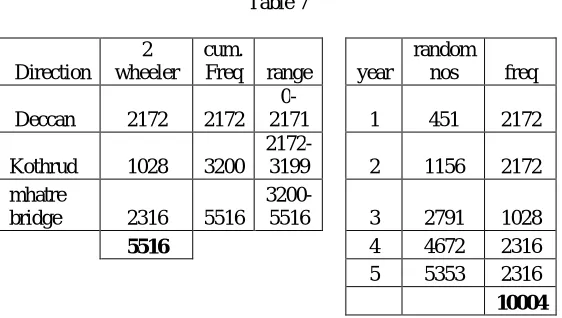
Table 7
Table 7 gives analysis of data by simulation for 2 wheeler at Nalstop junction towards deccan, kothrud and Mhatre bridge for time 9-10am.
Vehicle type: Three wheeler
Table 8
Table 8 gives analysis of data by simulation for 3 wheeler at Nalstop junction towards deccan, kothrud and Mhatre bridge for time 9-10am.
Vehicle type: 4 wheeler
Table 9 Direction
2 wheeler
cum.
Freq range year
random nos freq
Deccan 2172 2172
0-2171 1 451 2172
Kothrud 1028 3200
2172-3199 2 1156 2172 mhatre
bridge 2316 5516
3200-5516 3 2791 1028
5516 4 4672 2316
5 5353 2316 10004
Direction 3 wheeler
cum.
Freq range Year
random
nos freq
Deccan 280 280
0-279 1 101 280
kothrud 340 620
280-619 2 304 340
mhatre
bridge 186 806
620-806 3 413 340
806 4 599 340
5 734 186
Table 9 gives analysis of data by simulation for 4 wheeler at Nalstop junction towards deccan, kothrud and Mhatre bridge for time 9-10am.
Vehicle type: Heavy Table 10
Table 10 gives analysis of data by simulation for heavy vehicles at Nalstop junction towards deccan, kothrud and Mhatre bridge for time 9-10am.
2. Case B : Vehicle and duration constant: NAL STOP JUNCTION
Towards deccan Time: 9-10am
Table 11
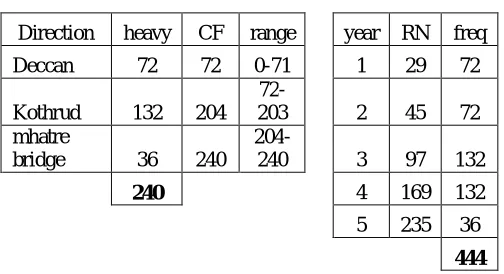
Table 11 gives analysis of data by simulation for heavy vehicles at Nalstop junction towards deccan for time 9-10am keeping vehicle and duration constant.
Direction heavy CF range year RN freq
Deccan 72 72 0-71 1 29 72
Kothrud 132 204
72-203 2 45 72 mhatre
bridge 36 240
204-240 3 97 132
240 4 169 132
5 235 36
444
vehicle type
towards
deccan CF range year RN freq 2
wheeler 2172 2172
0-2171 1 1014 2172 3
wheeler 280 2452
2172-2451 2 1736 2172 4
wheeler 756 3208
2452-3207 3 2463 756
Heavy 72 3280
3208-3280 4 2902 756
3280 5 3127 756
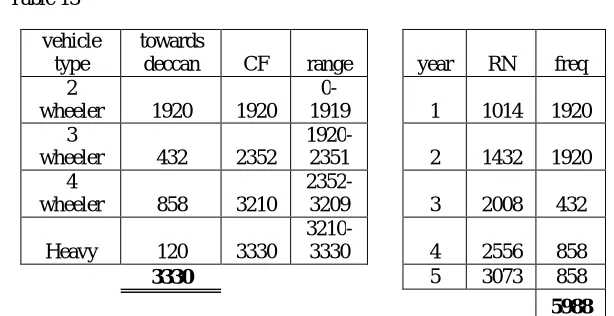
Time: 2-3pm Table 12
Table 12 gives analysis of data by simulation for heavy vehicles at Nalstop junction towards deccan for time 2-3pm keeping vehicle and duration constant.
Time: 7-8pm Table 13
Table 13 gives analysis of data by simulation for heavy vehicles at Nalstop junction towards deccan for time 7-8pm keeping vehicle and duration constant.
Similar calculations were done for case A and B for other junctions and time periods. vehicle
type
towards
deccan CF range year RN freq 2
wheeler 1184 1184
0-1183 1 966 1184 3
wheeler 288 1472
1184-1471 2 1270 288 4
wheeler 536 2008
1472-2007 3 1542 536
Heavy 100 2108
2008-2108 4 1754 536
2108 5 2008 100
2644
vehicle type
towards
deccan CF range year RN freq 2
wheeler 1920 1920
0-1919 1 1014 1920 3
wheeler 432 2352
1920-2351 2 1432 1920 4
wheeler 858 3210
2352-3209 3 2008 432
Heavy 120 3330
3210-3330 4 2556 858
3330 5 3073 858
VII. RESULTS&OUTCOME
Case A : Keeping direction and time constant
OUTCOME: Which type of vehicle is causing max. traffic.
Table 14
Table 14 shows results for maximum traffic by simulation for 2 wheeler, 3 wheeler, 4 wheeler and heavy vehicles for nalstop and mundhwa junction for time 9-10am, 2-3pm, and 7-8pm by keeping direction and time constant. It can be seen that maximum traffic is predicted for 2 wheeler at 9-10am at Nalstop and Mundhwa junction.
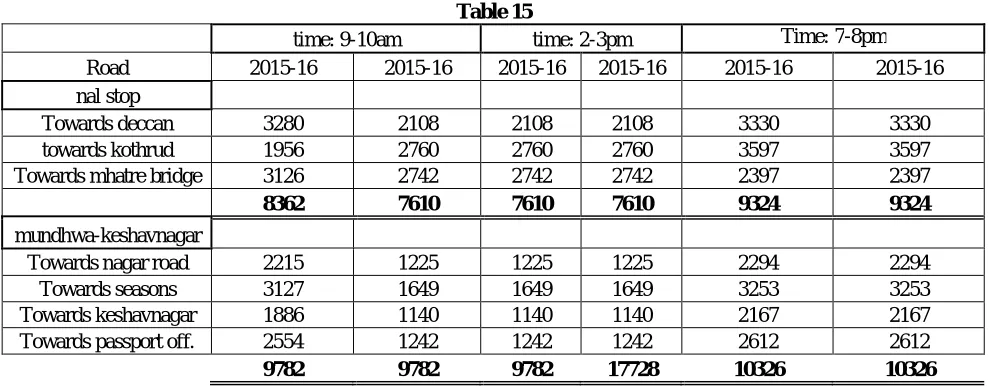
2. CASE B: Keeping vehicle type and duration and direction constant Table 15
time: 9-10am time: 2-3pm Time: 7-8pm
Road 2015-16 2015-16 2015-16 2015-16 2015-16 2015-16
nal stop
Towards deccan 3280 2108 2108 2108 3330 3330 towards kothrud 1956 2760 2760 2760 3597 3597 Towards mhatre bridge 3126 2742 2742 2742 2397 2397
8362 7610 7610 7610 9324 9324
mundhwa-keshavnagar
Towards nagar road 2215 1225 1225 1225 2294 2294 Towards seasons 3127 1649 1649 1649 3253 3253 Towards keshavnagar 1886 1140 1140 1140 2167 2167 Towards passport off. 2554 1242 1242 1242 2612 2612 9782 9782 9782 17728 10326 10326
Table 15 shows results for maximum traffic by simulation for time 9-10am, 2-3pm, 7-8pm for nalstop junction towards deccan, kothrud and mhatre bridge and for munhwa-keshavnagar junction towads nagar road, seasons, keshavnagar and passport office.
2 wheeler 3 wheeler 4 wheeler heavy
Road 2015-16 2020-21 2015-16 2020-21 2015-16 2020-21 2015-16 2020-21
Nal stop
time 9-10 5516 10004 806 1486 1800 3144 240 444 time2-3 4710 8954 884 1596 1742 3086 274 524
time 7-8 5606 9292 1055 1992 2391 4124 294 518
Mundhwa-keshavnagar
time 9-10 5184 7136 777 989 3452 4351 369 467
time2-3 2859 3988 468 487 1865 2498 164 213
VIII. CONCLUSION
From the analysis of the current traffic condition, and depending on the data we predicted the traffic volume data after a five year period. The irrational rise in the traffic volume data is studied and depending on the data remedial measures are suggested. The irregular rise in vehicular traffic is shown with the help of bar graphs. From the simulation data we can see that the traffic volume has almost doubled in the predicted time period (5 years). The same simulation model can be used to predict the traffic volume for even 10 or greater number of years. But, as there is so much traffic rise in just five years recommendations are made on the predictive analysis of five years. The remedial measures suggested can be included in the development plans by the Municipal Corporation or local governing authorities to avoid the traffic congestion problems in future.
Remedial measures that can be implemented are:
1. Road widening can be done where there is enough space available.
2. Delhi pattern can be followed i.e. vehicles having odd number in the unit place of the number plate are allowed on odd days and vehicles having even number on even days. It is more of complicated remedy having much criticism but if followed perfectly it is a good solution.
3. Reductions of existing elements, for e.g. bus stops on critical turns can be shifted to some other location and can be avoided near to junctions.
4. Provision of grade separation and flyovers.
5. Diversion of traffic can be done wherever parallel road options are available. 6. Change of pattern of vehicular flow, provision of one ways.
7. Use of smart traffic control and signalling systems by use of traffic volume sensor.
REFERENCES
[1] Amudapuram Mohan Rao , Kalaga Ramachandra Rao, “MEASURING URBAN TRAFFIC CONGESTION – A REVIEW”, International Journal for Trace and Transport Engineering, 2012, 2(4): 286.
[2] Mingkuan Wang, Li Kexin, “Transportation Model Application for the Planning of Low Carbon City Take Xining City in China as Example The 4th International Conference on Ambient Systems, Networks and Technologies (ANT 2013), the 3rd International Conference on Sustainable Energy Information Technology (SEIT-2013)
[3] Arvind Jayaraman, Ashley Micks, Ethan Gross,” Creating 3D Virtual Driving Environments for Simulation-aided Development of Autonomous Driving and Active Safety, SAE International
[4] The road traffic management corporation: Case study (International)
[5] Explore the cost of road traffic management and construction issues to think: (Case Study: International)
[6] Prof. K.V.Krishna rao (iit powai), “Evaluation of development plan towards sustainability for pune metropolitian area” [7] Zonal details of pune city from sarang awhad commisioner (pune city traffic dept.)
[8] Sadia Mannan “Analysis of TDM-based measures of urban traffic congestion” – International Journal of transportation Engineering ,2013, pp34-39.