DOI: 10.1534/genetics.109.113480
The Rim101p/PacC Pathway and Alkaline pH Regulate Pattern Formation
in Yeast Colonies
Sarah Piccirillo,* Melissa G. White,* Jeffrey C. Murphy,
†Douglas J. Law*
and Saul M. Honigberg*
,1*Division of Cell Biology and Biophysics, School of Biological Sciences, University of Missouri, Kansas City, Missouri 64110 and†Nickel City Software, Lancaster, New York 14086
Manuscript received November 20, 2009 Accepted for publication December 23, 2009
ABSTRACT
Multicellular organisms utilize cell-to-cell signals to build patterns of cell types within embryos, but the ability of fungi to form organized communities has been largely unexplored. Here we report that colonies of the yeastSaccharomyces cerevisiaeformed sharply divided layers of sporulating and nonsporulating cells. Sporulation initiated in the colony’s interior, and this region expanded upward as the colony matured. Two key activators of sporulation,IME1andIME2, were initially transcribed in overlapping regions of the colony, and this overlap corresponded to the initial sporulation region. The development of colony sporulation patterns depended on cell-to-cell signals, as demonstrated by chimeric colonies, which contain a mixture of two strains. One such signal is alkaline pH, mediated through the Rim101p/PacC pathway. Meiotic-arrest mutants that increased alkali production stimulated expression of an early meiotic gene in neighboring cells, whereas a mutant that decreased alkali production (cit1D) decreased this expression. Addition of alkali to colonies accelerated the expansion of the interior region of sporulation, whereas inactivation of the Rim101p pathway inhibited this expansion. Thus, the Rim101 pathway mediates colony patterning by responding to cell-to-cell pH signals. Cell-to-cell signals coupled with nutrient gradients may allow efficient spore formation and spore dispersal in natural environments.
I
N metazoans, the hallmark of cell patterning is the establishment of sharp boundaries between cells of different fates. These boundaries are established and maintained by cell-to-cell signals. Even simple organ-isms can differentiate into several cell types, and these cell types can be organized into patterns within a larger community. For example, different cell types are organized within biofilms of the pathogenic yeast,Candida albicans (Baillie and Douglas 1999), and within the fruiting body of the slime mold,Dictyostelium discoideum (Kimmel and Firtel 2004; Strmecki et al. 2005). However, in most cases communities of micro-organisms have not been shown to contain sharp boundaries between cell types, and the role if any of cell-to-cell signals in organizing cell types within fungal communities is not known.
The yeastSaccharomyces cerevisiaemay prove a geneti-cally tractable model for fungal cell patterning (re-viewed in Palkovaand Vachova2006). For example, periodic ammonia production during colony matura-tion can subdivide colonies into regions of cell growth and cell death (Vachovaand Palkova2005), colonies can form a skin-like cell layer on their surface (Vachova
et al.2009), andS. cerevisiaecan form elaborate biofilm-like structures on agar surfaces (Reynoldsand Fink2001). Finally, yeast colonies preferentially contain sporulated cells at their edge (Purnapatreand Honigberg2002). Localization of sporulated cells (termed asci) to the edge of colonies may be related to variations in nutrient microenvironments in different regions of the colony. For example, because growth inhibits sporulation (Colomina
et al.1999; Purnapatreet al.2002), regions of the colony that are more depleted for nutrients might sporulate more efficiently.
In addition to the inhibition of sporulation under growth conditions, sporulation is activated only after fermentable carbon sources such as glucose are fully metabolized to nonfermentable carbon sources such as ethanol (reviewed in Honigberg and Purnapatre 2003; Kassir et al. 2003). Nonfermentable carbon sources stimulate sporulation directly, and metabolism of these carbon sources (via respiration) can also pro-mote sporulation ( Jambhekarand Amon2008). Respi-ration causes an increase in the pH of the media as a result of cells secreting bicarbonate, and this increased pH may further stimulate sporulation in cultures (Ohkuni et al. 1998). Activation of sporulation by alkaline pH might occur through the highly conserved Rim101/PacC pathway (Penalvaand Arst2004), since this pathway activates transcription of many genes that Supporting information is available online athttp://www.genetics.org/
cgi/content/full/genetics.109.113480/DC1.
1Corresponding author:University of Missouri, 5007 Rockhill Rd., Kansas City, MO 64110. E-mail: [email protected]
respond to alkaline pH, including genes required for sporulation (Lamband Mitchell2003; Rothfelset al. 2005). However, a direct connection between alkaline pH and the Rim101 pathway in regulating sporulation has not been demonstrated. In the current study, we report on spatial patterns of sporulation that develop as colonies mature and the role of pH signals and the Rim101p pathway in regulating these patterns.
MATERIALS AND METHODS
Strains and media: Yeast strains (supporting information,
Table S1) were constructed in the W303 background (Leeand
Honigberg 1996) using standard methods (Kaiser et al.
1994); all strains compared in this study contained identical auxotrophies. Construction of genomic LacZ-fusion alleles has been described (Purnapatreet al. 2002). To maximize
sporulation, colonies were grown on YNA medium [2% potassium acetate (pH 7.0), 0.25% yeast extract, 2% agar, supplemented with the minimal amino acids necessary to balance auxotrophies]. For experiments withcit1Dmutants, strains were grown on SPS2-0.3 medium, which contains 0.3% glucose, 2% acetate, 0.25% ammonium sulfate, and 0.09% yeast nitrogen base (no amino acids or ammonium sulfate).
For measurement of LacZ expression, 0.04 mg/ml of X-gal was added to the media after autoclaving. For colonies inoculated from 0.5-ml spots, we employed YNA-2 media [6% potassium acetate (pH 7.0), 0.5% yeast extract, 2% agar], which decreased the time required for color development. To detect increased pH in the colony environment, 20 mg/liter of phenol red was added to YNA-2 medium before autoclaving. To measure the effect of pH on sporulation, 100 mmTris–HCl
at the indicated pH was added to the medium after auto-claving. To change the pH of YNA medium after 3 days of growth, a 6-mm well was made in the center of the plate using a Pasteur pipette and then filled with 130ml of 1mNaHPO4
buffer (pH 8.0). Colonies 2–4 cm from the well were analyzed for sporulation patterns. All other media are as described (Roseet al.1990).
Chimeric colonies: For colonies started from spot inocu-lations, here termed ‘‘spot colonies,’’ 13105cells were spotted
on YNA-2 plates containing X-gal in a volume of 0.5ml. For chimeric spot colonies, equal concentrations of each strain from overnight cultures were mixed, harvested, resuspended in H2O, and spotted as above, except as noted. Plates were
incubated for 6 days and photographed (Olympus C-60 camera), and the digital images were analyzed as described below. To determine the proportion of reporter cells in chimeric colonies, we suspended colonies in water, spread 500 cells on YPD medium, and replica plated the resulting colonies to sporulation (SP31) medium for 3 days before overlaying this medium with top agar containing X-gal and incubating for an additional 3 days (Serebriiskiiet al.2000).
Cryosections: Colonies were grown for various times on YNA medium, and then an agar block containing one colony was frozen in OCT (detailed protocol in File S1). Twenty-micrometer sections were examined by light microscopy and quantified as described below.
Embedded sections:To embed colonies for sectioning, we modified a previously described method (Scherzet al.2001),
with a major change being the substitution of Spurr’s reagent as embedding medium, as described in detail inFile S1. We determined the distribution of asci within a colony by super-imposing nine equal-sized rectangles on the colony image and counting all cells in each rectangle (200–350 cells).
Image acquisition, processing, and statistical analysis: All microscope images were captured using a Colorview II camera and AnalySIS software (SIS). Images in Figures 1, 2, and 4 were adjusted for brightness and contrast using Canvas 8. Quanti-fication of prIME-LacZ expression in cryosections and spot colonies used Image J (National Institutes of Health) and a plug-in scripted for this study (color histogram). To achieve the greatest discrimination between blue and white regions in the images, we used the inverse of the signal in the red channel. For the cryosections, the red signal in each bin was subtracted from the bin with the highest red signal. For spot colonies, the signal was subtracted from the signal observed in a control (LacZ) colony. All data is expressed as mean6SEM.
RESULTS
Colonies contain a sharply delimited layer of sporulated cells: Because sporulation occurs pref-erentially at the edge of colonies (Purnapatre and Honigberg2002), we investigated the pattern of spor-ulation within colonies. For this purpose, we embedded and sectioned colonies incubated for 8 days on YNA medium (Figure 1A), a medium that allows both growth and sporulation. The most striking feature of these sections was a sharp boundary between an upper layer containing many tetrad and dyad asci and a lower layer completely devoid of asci (Figure 1B). This boundary provides one of the clearest examples of cell patterning within the fungal kingdom.
Figure 1.—Patterns of sporulation in wild-type colonies.
Sporulation initiates in the interior of colonies and at the agar surface:The sharp boundary between spor-ulated and unsporspor-ulated regions led us to investigate the development of sporulation patterns after 4, 6, 8, and 10 days. Initially, four distinct layers of alternating sporulating and unsporulated regions were observed. For example, after 6 days, a thin layer of cells (3- to 5-cell widths) at the bottom of the colony contained a high frequency of tetrad and dyad asci (region 9 in Figure 2, A and B). Above this layer was a second layer (25- to 30-cell widths) that contained few if any asci (region 4–8 in Figure 2, A and B). Above this was a third layer, which was of variable size (5- to 10-cell widths) and contained many asci (region 2–3 in Figure 2, A and B). Finally, at the top of the colony was a layer of cells (5- to 10-cell widths) that contained relatively few spores (region 1–2 in Figure 2, A and B).
The interior region of sporulation expands as colonies mature while colony size remains constant: As colonies matured from 4 to 10 days, the interior layer
of sporulated cells expanded upward to include the top of the colony (Figure 3). In contrast, the lower band of sporulated cells remained relatively narrow even after 10 days. Despite the expansion of the interior sporula-tion layer, the boundaries between the interior layer of unsporulated cells and the two surrounding layers of sporulated cells remained sharply defined, even after many days of incubation (Figure 3).
It is possible that the changes in sporulation patterns over time described in the previous paragraph result from ongoing cell growth in the colony. However, we found that the diameter of colonies remained constant after 4 days of incubation, and spores began to appear only after this time (Figure 2C). Similarly, the average number of cells per colony did not increase significantly from 4 to 6 days (P¼0.82,n¼3). Thus, it is unlikely that continued cell division plays an important role in the development of sporulation patterns in colonies.
Patterns ofIME1-LacZandIME2-LacZexpression in colonies: Sporulation in specific regions of colonies could reflect nonuniform expression of sporulation regulators through the colony. Two key activators of sporulation, the Ime1p transcription factor and the Ime2p protein kinase, are not always coregulated, because IME2expression requires Ime1p-independent signals as well as Ime1p (reviewed in Honigbergand Purnapatre2003). To investigate the expression pat-terns ofIME1andIME2 within colonies, we examined colony cryosections expressing either prIME1-LacZ or
prIME2-LacZ promoter fusions. For the initial experi-ments, we measured prIME1-LacZ in an ime1D back-ground and prIME2-LacZ in an ime2D background to separate induction of these genes from autoregulation by their products (i.e., feedback). Strikingly, the pattern
Figure2.—Sporulation initiates in central region of
colo-nies. (A) A longitudinal section through the center of the col-ony, with the top (‘‘T’’) and bottom (‘‘B’’) of the colony indicated. To the left of the colony are 10 equally spaced marks that subdivide the colony into nine regions. Arrows in-dicate representative tetrad asci (four spores) and arrowheads indicate representative dyad asci (two spores). Bar, 50mm. (B) Sporulation distribution in 6-day colonies. Bars represent per-centage of sporulation in each of the nine regions of each im-age, as shown in A, from the top of the colony (left) to the bottom (right) (n¼4). (C) Timing of growth and sporulation in colonies. Colony diameter (open triangles) and percentage of sporulation (solid circles) are shown in colonies (SH1020) grown for various times on YNA medium (n¼5).
Figure3.—Time course of spore distribution in wild-type
of expression for the two fusion genes was different (Figure 4). After 12 days incubation, both genes were expressed in a narrow band at the bottom of the colony, but prIME1-LacZ was also expressed through a broad region from the top to the center of the colony (Figure 4A), whereas prIME2-LacZ was mainly expressed in a narrow band in the center of the colony (Figure 4B). Because the overlap between IME1 and IME2 expres-sion domains corresponds to the region of the colony in which asci were first observed, the interior layer of sporulation in colonies may reflect a region apical enough to expressIME1and basal enough to express
IME2.
To investigate the development of prIME1-LacZ ex-pression patterns over time, colonies were sectioned at 4, 6, 8, and 10 days. At 4 days, the prIME1-LacZ ex-pression zone was limited to the top approximately one-fourth of the colony, but by 6 days this zone had expanded to include approximately the top half of the colony (Figure 5A). The same pattern of expression was observed in a prIME1-LacZ/IME11
strain as in the
prIME1-LacZ/ime1D strain (Figure 5C); this result in-dicates that Ime1p is not required for the pattern of
IME1transcription in colonies.
Expression ofprIME2-LacZpeaked several days after
prIME1-LacZexpression (compare Figure 5A and 5B). Interestingly, the LacZ expression pattern was different in prIME2-LacZ/IME2 strains relative to prIME2-LacZ/
ime2Dstrains (compare Figure 5B and 5D). Both strains expressed LacZ at the bottom of the colony, but prIME2-LacZ/IME2 colonies (unlike prIME2-LacZ/ime2D colo-nies) expressed LacZ only transiently if at all in the interior of the colony. A likely explanation for this difference is that prIME2-LacZ/IME2 cells rapidly re-press the fusion gene as they complete sporulation (negative feedback), whereas prIME2-LacZ/ime2D cells continue to express this gene. Thus, the ime2D back-ground allowed visualization of the initial expression of
prIME2-LacZin a central region of the colony and also allowed accumulation of the fusion gene product to higher levels.
Figure4.—Expression ofprIME1-LacZandprIME2-LacZin
colonies. Colonies were sectioned after 12 days incubation on YNA medium containing X-gal. (A)prIME1-LacZ/ime1Dstrain (SH3830); (B) prIME2-LacZ/ime2D strain (SH3825). Bar, 0.1 mm.
Figure5.—Time course ofprIME1-LacZandprIME2-LacZ
expression patterns and requirement ofIme1p or Ime2pfor these patterns. Colonies were incubated for the indicated times on YNA medium containing X-gal and sectioned, and the distribution of LacZ expression was quantified as de-scribed in materials and methods(n ¼ 3). Each bar in
Signaling within colonies: Higher expression of
prIME2-LacZin ime2D strains relative to IME21 strains was apparent not only in cryosections (Figure 5, B and D) but also in whole colonies viewed from the top, including colonies inoculated from a drop of culture, termed spot colonies (Figure 6, A and B, compare i and ii; quantification shown in Figure 6C). This observation is consistent with previous studies showing thatIME2is regulated through negative feedback (Mitchellet al. 1990). Negative feedback occurs in part through cell autonomous mechanisms; for example, Ime2p targets Ime1p for degradation, thus repressing transcription of its own gene (Guttmann-Ravivet al.2002). In addition, negative feedback in the context of colonies could proceed through cell nonautonomous mechanisms; for example, signals secreted by one cell could regulate sporulation in neighboring cells.
To distinguish between cell autonomous and non-autonomous mechanisms, we mixed equal numbers of cells from two different strains (a ‘‘reporter’’ and a ‘‘signal’’ strain) and then spotted the mixture on plates to generate ‘‘chimeric’’ colonies. The reporter strain contained the prIME2-LacZ gene, whereas the signal strain lacked the fusion gene; so, if the genotype of the latter strain affects LacZ expression in the chimeric colony, then there must be communication between cells. We verified that the two strains in each chimera were present in an approximately 1:1 ratio after colony growth was complete by resuspending cells, plating for isolated colonies, and determining the genotype of these isolated colonies (seematerials and methods). As a control, prIME2-LacZ/ime2D reporter cells were mixed with equal numbers ofime2D/ime2Dsignal cells (Figure 6, A–C, iii). In these control colonies, LacZ expression in this colony was approximately half that observed in colonies containing only prIME2-LacZ/ ime2Dcells, as would be expected from the 1:1 ratio of genotypes (Figure 6, A–C, compare ii and iii).
We next examinedprIME2-LacZexpression in chime-ric colonies containing equal mixtures ofprIME2-LacZ/
ime2D and IME2/IME2 cells (Figure 6, A–C, iv). If induction of sporulation is not affected by neighboring cells, then chimeras containingIME2/IME2signal cells should be the same intensity blue as chimeras contain-ingime2D/ime2Dsignal cells. In contrast, we found that the IME2 chimeras expressed prIME2-LacZ at much lower levels than ime2D chimeras (Figure 6, A–C, compare iii and iv). Thus, the genotype of cells within a colony affects the phenotype of neighboring cells in the same colony (i.e., a cell nonautonomous mecha-nism). The same result was also obtained when an
IME21
reporter strain, IME2, was substituted for the
prIME2-LacZ/ime2D strain (Figure S1A). These results indicate that cell-to-cell signals regulate IME2 expres-sion in colonies.
As an independent test of signaling within colonies, we measured spore formation in IME2 1 ime2D
chi-meras. Although ime2D mutants do not sporulate, in-creasing the fraction of ime2D cells in these chimeras increased the efficiency of spore formation in theIME2
cells (Figure S1B). Thus, intercellular signals regulate both IME2 expression and spore formation within colonies.
Alkaline pH as both cause and effect of sporulation in colonies: As described in the Introduction, an alkaline pH environment has been implicated as both a by-product of sporulation and a signal that stimulates sporulation (Ohkuniet al.1998). Thus, alkaline pH is a candidate for a cell-to-cell signal that regulates
sporula-Figure6.—Cell-to-cell signaling regulates sporulation
effi-ciency in colonies. (A) Diagram represents chimeric colony experiments, in whichprIME2-LacZexpression was compared in four colonies containing the following genotypes: (i) prIME2-LacZ/IME2(SH3824) alone, (ii)prIME2-LacZ/ime2D (SH3825) alone, (iii) equal numbers of prIME2-LacZ/ime2D and ime2D/ime2D (SH3883), and (iv) equal numbers of prIME2-LacZ/ime2D and IME2/IME2 (SH3881). Z, prIME2-LacZ/ime2D; i, ime2D/ime2D; I1
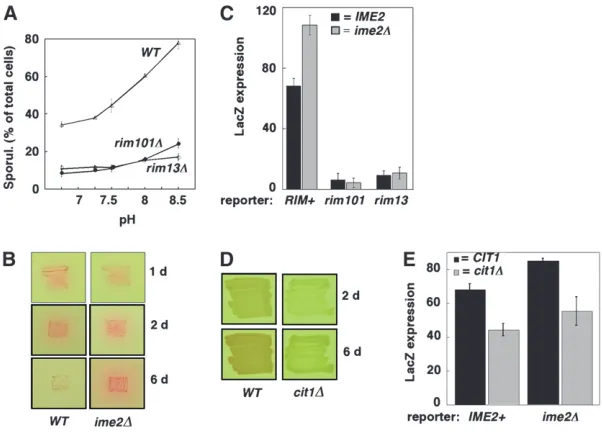
tion in colonies. To test this hypothesis, we first compared sporulation in wild-type spot colonies grown on medium buffered in the range pH 6.75–8.5. Sporu-lation in colonies showed a sharp dependence on pH in the range 7.5–8.5 (open triangles, Figure 7A). This result indicates that pH limits sporulation in colonies, consistent with the hypothesis that sporulating cells stimulate sporulation in neighboring cells by secreting alkali.
Given that the ime2Dmutant stimulates sporulation in neighboring cells more than does theIME21
control, we next asked whether this mutant produces more alkali than the control. For this purpose, we compared extracellular pH surrounding IME2 andime2D strains using a pH indicator, phenol red. This indicator becomes increasingly red in the pH range 7.0–8.0. After a 1-day incubation, the mutant generated slightly less alkali than the wild type, consistent with higher in-duction of metabolic genes in sporulation-competent cells relative to sporulation-defective cells (Primiget al. 2000). In contrast, after a 2-day incubation, the pink color surroundingIME2andime2Dpatches was almost indistinguishable, and after a 6-day incubation,ime2D patches were noticeably redder than IME2 patches. Thus, the wild type initially produced more alkali than the mutant; but over the longer term, the mutant eventually produced more alkali (Figure 7B).
Theime2Dmutant may produce more alkali than the wild type because IME2specifically inhibits alkali pro-duction or because cells arrested in meiosis produce alkali for a longer period than the wild type. To address these possibilities, we measured alkali production in three other mutants arrested in meiosis:ime1Dmutants, which like ime2D mutants arrest at the initiation of meiosis;hop2Dmutants, which arrest early in pachytene (Leuet al.1998); andndt80Dmutants, which arrest later in pachytene (Xuet al.1995). As was seen for theime2D mutant, after 6 days, the meiotic-arrest mutants pro-duced significantly more alkali than the wild type (Figure S2 A). This latter result is consistent with the wild type ceasing alkali production once sporulation is complete; whereas the mutants, which fail to complete sporulation, continue to produce alkali. Interestingly, thehop2Dandndt80Dmutants are somewhat less red on pH indicator plates than theime1Dandime2Dmutants (Figure 7B and Figure S2 A), so on the basis of this qualitative assay, it may be that mutants arrested early in meiosis produce more alkali than mutants arrested later in the program.
We next tested the ability of the meiotic-arrest mutants to stimulate sporulation in chimeras. Chimeric colonies containing any of these mutants as the signal strain induced prIME2-LacZ in the reporter strain to significantly higher levels than did a wild-type signal
Figure 7.—Alkaline pH, mediated through
the Rim101p/PacC pathway, regulates colony sporulation efficiency. (A) Effect of pH on spor-ulation levels of wild type (SH3881), rim101D (SH4375), andrim13D(SH4415). Colonies were grown for 6 days on YNA-2 medium buffered to the indicated pH, and the percentage of cells in colonies that formed spores was assayed by mi-croscopy after resuspending the complete colony (n¼ 3). (B) Production of alkali in wild type (WT) andime2Dmutant grown for 1, 2, or 6 days on YNA-2 media containing the pH indicator, phenol red. Red color in and around the patches of cells indicates an increased secretion of alkali from this strain. (C)RIM101andRIM13required to respond to neighboring cells. As indicated, chimeric colonies contained a prIME2-LacZ/ ime2D reporter strain that is RIM1
(SH3825), rim101D(SH4378), orrim13D(SH4417) and sig-nal strains that are either IME21
(SH3881) or ime2D(SH3883). LacZ expression was quantified after 12 days of growth to detect lowrimD expres-sion. Black bars indicate chimeras containing IME21
signal strain, and gray bars indicate chimeras containingime2D signal strain (n¼ 3). (D)CIT1is required for alkali production.CIT1(SH3881) andcit1D(SH4436) strains were patched to phenol red indicator medium containing both glucose and acetate (SPS2-0.3) to allow growth of thecit1Dstrain and photographed after 2 or 6 days of incubation. (E)CIT1is required to stimulate sporulation in neighboring cells. As indicated, chimeric colonies containedprIME2-LacZ/IME2reporter cells (SH3824) plus either theCIT1or thecit1Dstrain described in D as signal cells. Black bars indicate chimeras containingCIT11signal strain, and gray bars indicatecit1Dsignal strain (n¼3). To ensure approximately equal numbers ofcit1Dand reporter cells in the mature chimeras, all chimeras were grown on medium containing both glucose and acetate (SPS2-0.3). Even in this medium, growth of thecit1Dmutant is less than that of the wild type, so generation of mature chimeras containing approximately equal numbers of wild-type andcit1Dstrains required inoculating colonies with a 1:6 ratio ofIME2reporter tocit1Dstrain and a 1:10 ratio ofime2D reporter tocit1Dstrain; genotyping of 6-day chimeric colonies (seematerials and methods) revealed that all contained from 40
strain (Figure S2B). Given the correlation between al-kali production and the ability to stimulate sporulation, we propose that production of alkali during meiosis stimulates sporulation in neighboring cells.
Rim101p and Rim13p are required for response to alkali regulation of sporulation in colonies: Because the Rim101p pathway responds to alkali and is required for sporulation, we tested the ability of mutants in the Rim101p pathway (rim101Dandrim13D) to respond to neighboring cells. Rim101 is a transcriptional repressor that activates sporulation genes probably by repressing other transcriptional repressors, such as Nrg1 (Lamb and Mitchell2003; Rothfelset al.2005); Rim13p is a calpain-like protease required for processing and acti-vation of Rim101p (Liand Mitchell1997).
We measured the ability ofrim101DprIME2-LacZor
rim13D prIME2-LacZ reporter strains to respond to neighboring cells in chimeric colonies (Figure 7C). As expected given the role of the Rim101p pathway in
IME2transcription, expression of the reporter gene in theserimDmutants (Figure 7C, bars 3–6) was consider-ably less than forRIM1
strains (Figure 7C, bars 1 and 2), although this expression was still easily detectable in the mutants after extended incubation. To measure the ability of therimDreporter strains to respond to neigh-boring cells we compared expression of the fusion gene in chimeras containing an ime2D signal strain, which produces more alkali (Figure 7C, gray bars) to chimeras containing anIME2 signal strain, which produces less alkali (Figure 7C, black bars). We found that rimD reporter strains expressed the fusion gene to the same level regardless of whether the signal strain wasIME2or
ime2D(Figure 7, compare bar 3 to bar 4 and bar 5 to bar 6). These results contrast with the control chimera containing a RIM1
signal strain, where even after extended incubation the signal strain is expressed to significantly higher levels when the signal strain isime2D relative to when it isIME21
(Figure 7C, compare bar 1 to bar 2,P, 0.003). Thus,rim101Dandrim13Dmutants are defective in responding to neighboring cells.
As a further test of the role of the Rim101p pathway in responding to alkaline pH, we measured the effect of pH on sporulation in rimD mutants. If the Rim101p pathway stimulates sporulation by responding to extra-cellular alkali, thenrimDmutants should be defective in the stimulation of sporulation by alkaline pH. We found thatrimDmutants sporulated to levels significantly less than the wild type, regardless of the pH (Figure 7A). More importantly, whereas sporulation efficiency in-creased dramatically for the RIM1
strain over the pH range tested, pH had little or no effect on sporulation efficiency for eitherrimDmutant. This result is consis-tent with the Rim101p pathway being required for cells to initiate sporulation in response to an alkaline pH environment.
Alkali signaling in colonies depends on respiration: Sporulating cells secrete alkali, specifically bicarbonate,
as a by-product of respiration. To examine the relation-ship between respiration and cell-to-cell signals, we examined a mutant,cit1D, that fails to respire on acetate medium (Kim et al. 1986). Thus, we grew cit1D and control strains on medium containing both glucose and acetate, which allows the mutant to grow but not to respire. Not surprisingly, we found that the wild type produced more alkali than did thecit1Dmutant (Figure 7D). This result allowed an independent test of the role of alkali production in stimulating colony sporulation. To perform this test, chimeric colonies were prepared that contained aprIME2-LacZ/IME2reporter strain and a signal strain that was eithercit1DorCIT11. We found that expression of the reporter was significantly lower (P,0.02) in thecit1Dchimeric colony than in theCIT1
chimera (Figure 7E, bars 1 and 2). Similar results (P, 0.04) were obtained when the reporter strain was
prIME2-LacZ/ime2D rather than prIME2-LacZ/IME2
(Figure 7E, bars 3 and 4). Thus, the cit1D mutant is defective both in producing alkali and in stimulating sporulation in neighboring cells, consistent with our model that alkali produced by respiration is a cell-to-cell signal that stimulates sporulation in colonies.
Effect of alkaline pH and rim101D mutations on colony patterns:To examine the effect of pH on colony sporulation patterns, colonies were grown on standard medium for 3 days, and then the pH of the medium was raised by addition of NaHPO4buffer to a well created in the agar (see materials and methods). After an additional 3 days, the overall level of sporulation in these colonies was higher than in control colonies [266 5% sporulation for the pH-adjusted colonies (n¼4)vs.
1661% sporulation for unadjusted colonies (n¼6)]. Notably, the region of sporulation in pH-adjusted colonies was much broader than in control colonies (compare Figure 8A and 8B). This result suggests that the upward expansion of the central region of sporula-tion in colonies is normally limited by extracellular pH. We next measured colony sporulation patterns in a
rim101Dmutant. The pattern of sporulation inrim101D colonies, even after 8 days of incubation, was much different from that in the wild type. In particular, the region of sporulation in the mutant colony was limited to a narrow central region of the colony rather than extending through the entire top half of the colony as in the wild type (compare Figure 8C and 8D). These results indicate that Rim101p, like alkaline pH, regulates the expansion of the interior region of sporulation within colonies.
DISCUSSION
the Rim101/PacC pathway responds to alkaline pH to regulate both the efficiency and the pattern of sporulation.
Our results suggest a model in which sporulating cells in colonies secrete alkali and this alkali in turn stim-ulates sporulation in neighboring cells. This model is consistent with an earlier finding that cells in sporula-tion cultures secrete bicarbonate (an alkali), and this bicarbonate stimulates sporulation in these cultures (Ohkuniet al.1998). Bicarbonate is produced during sporulation as a result of respiratory metabolism of nonfermentable carbon sources, and it is likely that secretion of alkali is just one of several ways that respiration and nonfermentable carbon sources stimulate sporulation (Treinin and Simchen 1993; Jambhekar and Amon2008). Our model is strongly supported by the finding that mutants (ime1D, ime2D, hop2D, and
ndt80D) producing more alkali than the wild type stimulated neighbor cell sporulation more than the wild type, whereas a mutant (cit1D) producing less alkali than the wild type stimulated neighbor cell sporulation less than the wild type.
SinceIME1and/orIME2are required for induction of most or all sporulation genes, it is worth considering
whyime1Dandime2Dmutants ultimately produce more alkali than the wild type. Many metabolic genes, in-cluding genes required for respiration, are induced under sporulation conditions, but most of these genes are induced under these conditions even in MAT ho-mozygous strains, which cannot initiate sporulation (Primig et al. 2000). Certain respiratory genes are induced to higher levels in sporulation-competent strains than in sporulation-defective strains (Primig
et al. 2000), and this higher induction likely explains why at early stages of growth on plates, the wild type produces more alkali than the mutant. In contrast, once cells complete sporulation, metabolism ceases until spores encounter an environment that promotes their germination ( Joseph-Strausset al.2007); hence, alkali production also would be expected to cease once cells complete sporulation. In summary, the higher produc-tion of alkali in meiosis-arrest mutants is very likely because these mutants produce alkali for a longer period than the wild type.
Alkali signaling between cells likely accounts for the upward expansion of the region of sporulation in colonies from a narrow initial band. This conclusion is based on the observations that addition of alkali to the medium accelerates the expansion of this band, whereas the rim101D mutant prevents this expansion. The Rim101 pathway is required for yeast and other fungi to respond to moderately alkaline pH environments (7.0–8.0); for example, this pathway allows pathogenic fungi to survive alkaline host environments (Davis 2009). Prior to this study, the Rim101 pathway had not been implicated in cell-to-cell signaling. Our results raise the possibility that pH signals are a general form of communication between cells. For example, pH signals may regulate the organization of extended colony-like structures termed ‘‘mats,’’ since a gradient of acidic pH (4.7–5.8) contributes to variation in cell adhesion through different regions of the mat (Reynoldset al. 2008). Furthermore, alkalinization is also a by-product of the periodic production of ammonia in colonies that triggers repeated cycles of growth and stasis in haploid colonies (Palkovaand Vachova2003).
The bottom layer of cells in a colony inhabits a unique nutrient environment close to the agar surface, which may explain the cells’ high sporulation rate relative to more apical cells. In contrast, initiation of sporulation within a narrow interior band of cells cannot be explained by a unidirectional diffusion of nutrients through the colony (Turing1952). Possibly, this region represents the intersection of two opposing gradients; for example, a gradient of acetate may diffuse upward from the bottom of the colony while a gradient of oxygen diffuses downward from the top. Consistent with this view,IME1andIME2, which are subject to different nutritional controls (see Introduction), are initially transcribed in different regions:IME1at the top of the colony and IME2 in the central part of the colony.
Figure8.—Effect of pH and Rim101p on sporulation
pat-terns. (A and B) Addition of alkaline buffer expands sporula-tion region in colonies. Wild-type colonies (SH3881) were grown on YNA medium for 3 days under standard conditions before 1.0msodium phosphate buffer (pH 8.0) was added
Because bothIME1andIME2are required for sporula-tion, the initial pattern of sporulation observed in the central region of the colony implies that this region may be apical enough to expressIME1and basal enough to also expressIME2.
Cell-to-cell signals may be necessary for efficient sporulation within the suboptimal nutrient environ-ment present in developing colonies. Indeed, by limit-ing meiosis and sporulation to a subset of cells in the colony, colony patterning may maximize the overall survival rate of the colony’s population. In the wild, yeast strains outcross with genetically diverse strains, and even though these outcrosses are relatively infrequent, they result in an increase in the genetic heterogeneity of the population ( Johnsonet al.2004; Ruderferet al.2006; Diezmannand Dietrich2009). Since communities of yeast in the wild could often contain genetically diverse strains, we speculate that clustering asci of different strains together within these communities would pro-mote outcrossing.
The foundation of pattern formation in metazoans is the combination of long-range and short-range cell signals (Irvine and Rauskolb 2001; Kerszberg and Wolpert 2007); thus, it is interesting that colony sporulation patterns likely involve both long-range gradients of nutrients and short-range cell-to-cell sig-nals. Differences in nutrient microenvironments across the colony could cause sporulation to initiate in specific regions, and pH signals between cells would reinforce these differences to sharpen the sporulation pattern. Nevertheless, pH signals are probably not sufficient to explain the remarkably sharp boundaries between sporulated and unsporulated regions in colonies. By analogy to pattern formation in metazoans, precise boundaries in developing colonies may require multiple signals, including both diffusible and cell-surface li-gands. In this respect, yeast colonies may preserve some of the simplest, yet most ancient and most fundamental, mechanisms of cell patterning.
We thank Misa Gray [University of Missouri–Kansas City (UMKC)] for strain construction, Jessica Kueker (UMKC) and Jennifer Baumler (UMKC) for help in developing the sectioning protocols, Jeffrey Price (UMKC) for use of equipment, Gerald Wyckoff (UMKC) for sugges-tions related to image analysis, Justin Fay (Washington University) for helpful discussions, and Daniel Gottschling (Frederick Hutchinson Cancer Center) for advice on colony cryosections. This work was supported by grants from the National Institutes of Health (R15GM80710 and R15GM80710-S1) to S.M.H.
LITERATURE CITED
Baillie, G. S., and L. J. Douglas, 1999 Role of dimorphism in the development of Candida albicans biofilms. J. Med. Microbiol.48:
671–679.
Colomina, N., E. Gari, C. Gallego, E. Herrero and M. Aldea, 1999 G1 cyclins block the Ime1 pathway to make mitosis and meiosis incompatible in budding yeast. EMBO J.18:320–329. Davis, D. A., 2009 How human pathogenic fungi sense and adapt to
pH: the link to virulence. Curr. Opin. Microbiol.12:365–370.
Diezmann, S., and F. S. Dietrich, 2009 Saccharomyces cerevisiae: population divergence and resistance to oxidative stress in clin-ical, domesticated and wild isolates. PLoS One4:e5317. Guttmann-Raviv, N., S. Martin and Y. Kassir, 2002 Ime2, a
meiosis-specific kinase in yeast, is required for destabilization of its transcriptional activator, Ime1. Mol. Cell. Biol.22:2047–2056. Honigberg, S. M., and K. Purnapatre, 2003 Signal pathway inte-gration in the switch from the mitotic cell cycle to meiosis in yeast. J. Cell Sci.116:2137–2147.
Irvine, K. D., and C. Rauskolb, 2001 Boundaries in development: formation and function. Annu. Rev. Cell. Dev. Biol.17:189–214. Jambhekar, A., and A. Amon, 2008 Control of meiosis by
respira-tion. Curr. Biol.18:969–975.
Johnson, L. J., V. Koufopanou, M. R. Goddard, R. Hetherington, S. M. Schaferet al., 2004 Population genetics of the wild yeast
Saccharomyces paradoxus.Genetics166:43–52.
Joseph-Strauss, D., D. Zenvirth, G. Simchen and N. Barkai, 2007 Spore germination in Saccharomyces cerevisiae: global gene expression patterns and cell cycle landmarks. Genome Biol. 8:
R241.
Kaiser, C., S. Michaelisand A. Mitchell, 1994 Methods in Yeast
Genetics: A Cold Spring Harbor Laboratory Course Manual. Cold Spring Harbor Laboratory Press, Cold Spring Harbor, NY. Kassir, Y., N. Adir, E. Boger-Nadjar, N. G. Raviv, I. Rubin-Bejerano
et al., 2003 Transcriptional regulation of meiosis in budding yeast. Int. Rev. Cytol.224:111–171.
Kerszberg, M., and L. Wolpert, 2007 Specifying positional infor-mation in the embryo: looking beyond morphogens. Cell130:
205–209.
Kim, K. S., M. S. Rosenkrantzand L. Guarente, 1986 Saccharomyces cerevisiae contains two functional citrate synthase genes. Mol. Cell. Biol.6:1936–1942.
Kimmel, A. R., and R. A. Firtel, 2004 Breaking symmetries: regula-tion of Dictyostelium development through chemoattractant and morphogen signal-response. Curr. Opin. Genet. Dev. 14:540– 549.
Lamb, T. M., and A. P. Mitchell, 2003 The transcription factor Rim101p governs ion tolerance and cell differentiation by direct repression of the regulatory genes NRG1 and SMP1 in Saccharo-myces cerevisiae. Mol. Cell. Biol.23:677–686.
Lee, R. H., and S. M. Honigberg, 1996 Nutritional regulation of late meiotic events inSaccharomyces cerevisiaethrough a pathway distinct from initiation. Mol. Cell. Biol.16:3222–3232. Leu, J. Y., P. R. Chuaand G. S. Roeder, 1998 The meiosis-specific
Hop2 protein of S. cerevisiae ensures synapsis between homolo-gous chromosomes. Cell94:375–386.
Li, W., and A. P. Mitchell, 1997 Proteolytic activation of Rim1p, a positive regulator of yeast sporulation and invasive growth. Genetics145:63–73.
Mitchell, A. P., S. E. Driscolland H. E. Smith, 1990 Positive con-trol of sporulation-specific genes by the IME1 and IME2 products in Saccharomyces cerevisiae. Mol. Cell. Biol.10:2104–2110. Ohkuni, K., M. Hayashi and I. Yamashita, 1998
Bicarbonate-mediated social communication stimulates meiosis and sporula-tion of Saccharomyces cerevisiae. Yeast14:623–631.
Palkova, Z., and L. Vachova, 2003 Ammonia signaling in yeast colony formation. Int. Rev. Cytol.225:229–272.
Palkova, Z., and L. Vachova, 2006 Life within a community: ben-efit to yeast long-term survival. FEMS Microbiol. Rev.30:806–824. Penalva, M. A., and H. N. Arst, Jr., 2004 Recent advances in the characterization of ambient pH regulation of gene expression in filamentous fungi and yeasts. Annu. Rev. Microbiol. 58:
425–451.
Primig, M., R. M. Williams, E. A. Winzeler, G. G. Tevzadze, A. R. Conwayet al., 2000 The core meiotic transcriptome in bud-ding yeasts. Nat. Genet.26:415–423.
Purnapatre, K., and S. M. Honigberg, 2002 Meiotic differentia-tion during colony maturadifferentia-tion in Saccharomyces cerevisiae. Curr. Genet.42:1–8.
Purnapatre, K., S. Piccirillo, B. L. Schneider and S. M. Honigberg, 2002 The CLN3/SWI6/CLN2 pathway and SNF1 act sequentially to regulate meiotic initiation in Saccharomyces cerevisiae. Genes Cells7:675–691.
Reynolds, T. B., A. Jansen, X. Pengand G. R. Fink, 2008 Mat formation in Saccharomyces cerevisiae requires nutrient and pH gradients. Eukaryot. Cell7:122–130.
Rose, M. D., F. Winstonand P. Hieter, 1990 Methods in Yeast
Genet-ics: A Laboratory Course Manual.Cold Spring Harbor Laboratory Press, Cold Spring Harbor, NY.
Rothfels, K., J. C. Tanny, E. Molnar, H. Friesen, C. Commisso
et al., 2005 Components of the ESCRT pathway, DFG16, and YGR122w are required for Rim101 to act as a corepressor with Nrg1 at the negative regulatory element of the DIT1 gene of Saccharomyces cerevisiae. Mol. Cell. Biol.25:6772–6788. Ruderfer, D. M., S. C. Pratt, H. S. Seidel and L. Kruglyak,
2006 Population genomic analysis of outcrossing and recom-bination in yeast. Nat. Genet.38:1077–1081.
Scherz, R., V. Shinderand D. Engelberg, 2001 Anatomical anal-ysis of Saccharomyces cerevisiae stalk-like structures reveals spatial organization and cell specialization. J. Bacteriol. 183:
5402–5413.
Serebriiskii, I. G., G. G. Tobyand E. A. Golemis, 2000 Streamlined yeast colorimetric reporter activity assays using scanners and plate readers. Biotechniques29:278–279, 282–284, 286–288.
Strmecki, L., D. M. Greeneand C. J. Pears, 2005 Developmental decisions in Dictyostelium discoideum. Dev. Biol.284:25–36. Treinin, M., and G. Simchen, 1993 Mitochondrial activity is
re-quired for the expression of IME1, a regulator of meiosis in yeast. Curr. Genet.23:223–227.
Turing, A., 1952 The chemical basis of morphogenesis. Philos. Trans. R. Soc. B237:37–72.
Vachova, L., and Z. Palkova, 2005 Physiological regulation of yeast cell death in multicellular colonies is triggered by ammonia. J. Cell Biol.169:711–717.
Vachova, L., O. Chernyavskiy, D. Strachotova, P. Bianchini, Z. Burdikovaet al., 2009 Architecture of developing multicellular yeast colony: spatio-temporal expression of Ato1p ammonium exporter. Environ. Microbiol.11:1866–1877.
Xu, L., M. Ajimura, R. Padmore, C. Klein and N. Kleckner, 1995 NDT80, a meiosis-specific gene required for exit from pachy-tene in Saccharomyces cerevisiae. Mol. Cell. Biol.15:6572–6581.
Supporting Information
http://www.genetics.org/cgi/content/full/genetics.109.113480/DC1
The Rim101p/PacC Pathway and Alkaline pH Regulate Pattern
Formation in Yeast Colonies
Sarah Piccirillo, Melissa G. White, Jeffrey C. Murphy, Douglas J. Law
and Saul M. Honigberg
Copyright © 2010 by the Genetics Society of America
S. Piccirillo et al.
2 SI
FILE S1
SUPPORTING INFORMATION
Detailed protocol for colony embedding: The following is a modification of a method for embedding yeast colonies for
light and electron microscopy (1). After incubation of approximately 300 colonies on agar medium for the indicated time, an
isolated colony (1-2 mmin diameter) and a small amount of the underlying agar medium was removed and placed on a
microscope slide. Several drops of 2% agar (42°C) were placed on a microscope slide, the colony was immediately placed on the
agar and then several drops of agar were placed on top of the colony. The resulting agar block was trimmed with a razor blade,
and placed in a 3.5 ml borosilicate screw-cap vial (Fisher 03-339-21B). All subsequent incubations and washes used 1.5 -2.0 ml
and were performed in the same vial. First, colonies were fixed by incubating in 2% paraformaldehyde / 2% glutaraldehyde for
7 days at 4°C. Agar blocks were then washed on ice by incubating twice for 15 minutes with 0.5 ml of 0.15M sodium cacodylate
(pH 7.2), and then twice more for 5 minutes with OS buffer (100 mM KH2PO4, 10 mM MgCl2, pH 6.0). To allow electron
microscopy of sections, 1% OsO4 in OS was added to vials to cover the agar block and incubated on ice in a fume hood for 1 hr,
then washed twice with OS buffer on ice, and incubated in OS overnight at 4°C. After washing two times with cold water, the
blocks were washed sequentially with 25%, 50%, 75%, 95% and 100% (twice) ethanol for 10 minutes each, and the blocks left
overnight at 4°C in 100% ethanol. Ethanol was removed, Spurr’s reagent (Electron Microscopy Sciences) added, vials rotated for
15 minutes, then allowed to stand for 30 minutes, and the Spurr’s treatment repeated four more times. After the final wash,
Spurr’s reagent was added to cover agar blocks (1.5-2.0 ml) and incubated for four hours, then the Spurr’s was replaced, the vial
rotated overnight, and this last step repeated again the next day. Finally, each agar block was placed in a mold with 0.2 ml of
Spurr’s and incubated at 60°C for four hours, topped off with Spurr’s and incubated at 60°C overnight. Sections (0.5 µ) from
the central region of the colony were collected in distilled H2O, placed on a drop of water, and dried on a 52°C heat block.
Sections were stained with1.0 % toluidine blue, 1% Sodium Borate for 5-15 sec., washed under a stream of water, dried,
covered in mounting media (KPL), and examined by light microscopy.
1. Scherz, R., Shinder, V. & Engelberg, D. (2001) J Bacteriol183, 5402-13.
Detailed Protocol for Cryosections: A square of agar surrounding a 2-3 mm colony was cut from an agar plate and
submerged in OCT compound (VWR) in a 15 X 15 X 5 mm cryomold(VWR) and incubated at room temperature for 90 min.
The cryomold was then submerged for 20 sec in an isopentane bath cooled by liquid nitrogen and sectioned at -20°C -- -25°C
using aMicrom HM 505Ecryostat. 20 m sections through the central region of the colony were covered with mounting media
S. Piccirillo et al. 3 SI
FIGURE S1.—Effect of neighboring cells on prIME2-LacZ expression and spore formation in IME2 cells. (A) LacZ expression in an prIME2-LacZ/IME2 strain (SH3824) that it was present at the indicated concentrations (12.5% to 100%) in chimeric colonies that also contained either an ime2Δ strain (yellow) or an IME2 strain (blue) or in a control colony containing only SH3824 (red). Particularly in the 25% chimera, there was significantly higher expression of LacZ in the chimeras containing the ime2Δstrain than the corresponding chimeras containing the IME2 strain (for 25%, P=0.02; for 12/5%, P=0.08). (B) Spore formation in
S. Piccirillo et al.
4 SI
FIGURE S2—Sporulation-arrest mutants produce more alkali and stimulate sporulation in surrounding cells more than the
S. Piccirillo et al. 5 SI
TABLE S1
Saccharomyces cerevisiae strains used in this study1
Strain Genotype
SH1020 MATa/MATα ade2/ade2 can1:ADE2:CAN1/can1:ADE2:CAN1 his3-11,15/his3-11,15 leu2-3,112/LEU2
lys2(3’∆):HIS3:lys2(5'∆)/LYS2 trp1-1 / trp1-3'∆ ura3-1 / ura3-1
SH3824 MATa/MATα ade2/ade2 can1:ADE2:CAN1/can1:ADE2:CAN1 his3-11,15/his3-11,15
lys2(3'∆):HIS3:lys2(5'∆)/LYS2 LEU2/leu2-3,112 trp1-1/trp1-3'∆ ura3-1/URA3 prIME2-LacZ-TRP1 / IME2
SH3825 MATa/MATα ade2/ ade2 can1:ADE2:CAN1/ can1:ADE2:CAN1 his3-11,15/his3-11,15
lys2(3'∆):HIS3:lys2(5'∆/LYS2 leu2-3,112/leu2-3,112 trp1-1/trp1-3'∆ ura3-1/ URA3 prIME2-LacZ-TRP1 / ime2∆::LEU2
SH3826 MATa/MATα ade2/ade2 can1:ADE2:CAN1/can1:ADE2:CAN1 his3-11,15/his3-11,15
lys2(3'∆):HIS3:lys2(5'∆)/LYS2 leu2-3,112/ leu2-3,112 TRP1/trp1-3'∆ ura3∆::LEU2/ura3-1 IME1/ prIME1-LacZ-URA3
SH3830 MATa/MATα ade2/ade2 can1:ADE2:CAN1/can1:ADE2:CAN1 his3-11,15/his3-11,15
lys2(3'∆):HIS3:lys2(5'∆)/LYS2 LEU2/ leu2-3,112 TRP1/trp1-3'∆ ura3-1/ura3-1 ime1∆ / prIME1-LacZ-URA3
SH3881 MATa/MATα ade2/ade2 can1:ADE2:CAN1/can1:ADE2:CAN1 his3-11,15/his3-11,15
lys2(3'∆):HIS3:lys2(5'∆)/LYS2 URA3/ura3-1
SH3883 MATa/MATα ade2/ade2 can1:ADE2:CAN1/can1:ADE2:CAN1 his3-11,15/his3-11,15 leu2-3,112/leu2-3,112 lys2(3'∆):HIS3:lys2(5'∆)/LYS2 URA3/ura3-1 ime2∆::LEU2/ime2∆::LEU2
SH3972 Isogenic to SH3881 except LEU2 / leu2-3,112 TRP1/trp1-3'∆ ime1∆ ime1∆
SH4300 Isogenic to SH3881 except LEU2 / leu2-3,112 TRP1/trp1-3'∆ ura3-1/ura3-1 ndt80∆::URA3 / ndt80∆::URA3
SH4302 Isogenic to SH3881 except TRP1 / trp1-3'∆ ura3-1/ura3-1 hop2∆::URA3∆/ hop2∆::URA3
SH4375 Isogenic to SH3881 except ura3-1/ ura3-1 rim101∆::URA3/ rim101∆::URA3
SH4378 Isogenic to SH3825 except ura3-1/ ura3-1 rim101∆::URA3/ rim101∆::URA3
SH4415 Isogenic to SH3881 except ura3-1/ ura3-1 rim13∆::URA3/ rim13∆::URA3
SH4417 Isogenic to SH3825 except ura3-1/ ura3-1 rim13∆::URA3/ rim13∆::URA3
SH4436 Isogenic to SH3881 except ura3-1/ ura3-1 cit1∆::URA3/ cit1∆::URA3