Study of the Parameters in EDM through
Design of Experiments Using Taguchi Method
Shiv Singh1, Dr.MP Singh2, Sanjay Singh3
P.G. Student, Department of Production Engineering, Jagannath University, Jaipur, Rajasthan, India1 Professor, Department of Mechanical Engineering, Jagannath University, Jaipur, Rajasthan, India2 Asst. Professor, Department of Mechanical Engineering, Jagannath University, Jaipur, Rajasthan, India3 ABSTRACT: The experiment for optimization of EDM processparameter is performed on EN-31 alloy steel using copperelectrode of 4 mm diameter in this paper. The process parametersare decided based on the Taguchi method. The various input factors like Pulse ON time, Discharge current and voltage were considered as the input processing parameters, while the MRR and TWR is considered as the output. Optimization using Taguchi method was performed to predict the best combination of inputs towards maximum output. From this experiments it is found that different combination of EDM process parameters are required to achieve higher MRR and lower TWR for EN-31 alloy steel. Mean ratio are used to analyzed the effects of parameters on TWR and MRR and also optimize the optimum input parameters.
KEYWORDS: EDM, Taguchi method, EN-31, TWR, Material removal rate, copper electrode, dielectric fluid.
I. INTRODUCTION
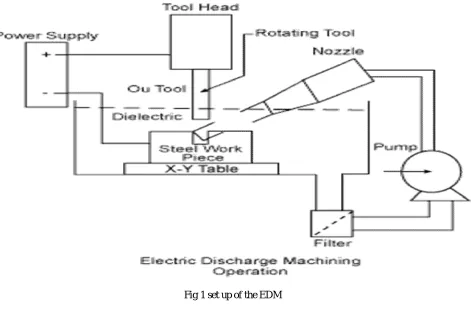
Electrical Discharge Machining or EDM is a machining method primarily used for hard metals or those that would be impossible to machine with traditional techniques. The non-contact machining technique has been continuously evolving from a mere tool and dies making process to a micro-scale application machining alternative attracting a significant amount of research interests. EDM is especially well-suited for cutting intricate contours or delicate cavities that would be difficult to produce with a grinder, an end mill or other cutting tools. Metals that can be machined with EDM include hardened tool-steel, titanium and carbide, Inconel etc. One critical limitation, however, is that EDM only works with materials that are electrically conductive. EDM is a thermoelectric process in which heat energy of spark is used to remove material from the workpiece. The workpiece and the tool should be made of electrically conductive material. A spark is produced between the two Electrodes (tool and workpiece) and its location is determined by the narrowest gap between the two.
II. WORKINGPRINCIPLEOFEDM
tool surface is much smaller than that from the work piece surface. A During EDM, pulsed DC of 80-100 V at approximately 5 kHz is passed through the electrodes. It results in intense electric field at location where surface irregularity provides the narrowest gap. Negatively charged particles (electrons) break loose from the cathode surface and move towards the anode surface under the influence of the electric field forces.
Fig 1 set up of the EDM
III. LITERATURESURVEY
value of the parameters for the MRR and TWR, and SR.B.Satyanarayan et al. [7] Found out the assumption of ANOVAs were tested and found to be valid. Then by using annova technique. It was found that the machining variables pulse on time is a significant factor that effect surface roughness. Machining parameter pulse on time most effective factor for the surface roughness. Pulse on time should be continuous for effective surface roughness.Prof. Ashok Choudhury et al. [8] found that Taguchi’s experimental design method is used to obtain optimum parameter combination for maximization of MRR.The material removal rate (MRR) mainly affected by peak current (Ip). Duty cycle (DC) has least effect on it. The electrode wear rate (EWR) is mainly influenced by peak current (Ip). The effect of gap voltage (Vg) is less on EWR and has least effect on itM. S. Reza et al. [9] Optimize the controlled parameters of EDM using injection flushing type machining on multi performance characteristics using GRA method. Parameters are optimized on different Response such as MRR, TWR and SR. For this experiment copper tool and AISI 304 stainless steel work piece is utilized. L18 Taguchi’s orthogonal array design planned for experiments. Selected machine settings are Ip, Ton, polarity, voltage, dielectric liquid pressure and machining depth have been taken.
IV. MATERIALPROPERTIES
[A] WORKPIECE MATERIAL
EN-31 contains the alloying element as per table given below:-
ELEMENT Mn C Si Cr
% 0.52 1.50 0.22 1.30
ELEMENT S P Mg -
[B] TOOL MATERIAL
In this experiment the copper is selected as a tool material with the properties listed in Table2.
TABLE 2.MECHANICAL AND THERMAL PROPERTIES OF
COPPER TOOL
Electrical resistivity 1.96mico-Ohm/cm
Melting point 1083oC
Electrical conductivity 92%
Thermal conductivity 380.7W/mk
Specific heat 0.092cal/goC
Coefficient of thermal expansion 6.6X10⁻⁶C
Density 8.9gm/cm3
V. EXPERIMENTALDATA
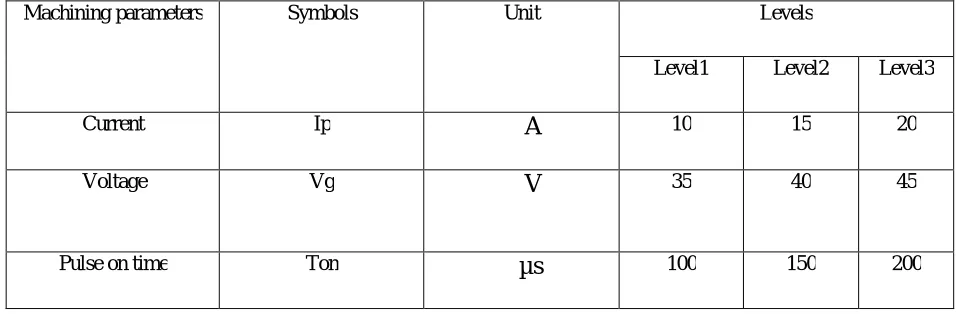
The machining parameters chosen for the present experiment are current, open circuit voltage and Pulse-on time (Ton)
is the duration of time (in µs) the current is allowed to flow per cycle.
TABLE 3. THE MACHINING PARAMETERS AND THEIR LEVELS
Machining parameters Symbols Unit Levels
Level1 Level2 Level3
Current Ip
A
10 15 20 Voltage VgV
35 40 45Work piece was cut in the form of 1.5inch* 1.5inch * 6inch. Subsequently nominal cut on lathe was carried out to remove rust and corrosion. After machining it was thoroughly cleaned with Acid to remove the carbon deposition, and the weight measurements were taken on electronic weighing machine, which has a resolution of 0.001 grams. Each experiment was carried out and weight loss of material and electrode are measured. Initial weights of the work piece and copper electrodes are given in the Table
VI. EXPERIMENTALPROCEDURE
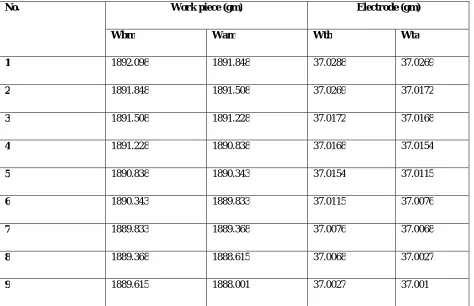
TABLE 4. INITIALS AND FINAL WEIGHTS OF WORK PIECES AND ELECTRODES
No. Work piece (gm) Electrode (gm)
Wbm Wam Wtb Wta
1 1892.098 1891.848 37.0288 37.0269
2 1891.848 1891.508 37.0269 37.0172
3 1891.508 1891.228 37.0172 37.0168
4 1891.228 1890.838 37.0168 37.0154
5 1890.838 1890.343 37.0154 37.0115
6 1890.343 1889.833 37.0115 37.0076
7 1889.833 1889.368 37.0076 37.0068
8 1889.368 1888.615 37.0068 37.0027
9 1889.615 1888.001 37.0027 37.001
Table 4 show the initial and the final weight of the work piece and tool, during experiments which can be find out
before and after machining these calculation are useful for find out the MRR and TWR.
MRR(Material removal rate) = Difference in Weight of work piece before and after machining/Time of machining
EWR (Electrode wear rate) = Difference in Weight of electrode before and after machining/ Time of machining
Whereas Wbm = weight of the work piece before machining, Wam = weight of the work piece after machining
During the experiment we have taken total 9 readings on the copper electrode. Time taken for machining was recorded by digital stop watch and then weight loss of work piece and electrode are calculated. From the equations given in above chapter electrode wear rate (EWR) and material removal rate (MRR) are measured which is given in the table described below. Other working parameters are kept constant like depth of cut and diameter of electrode is 4 mm…
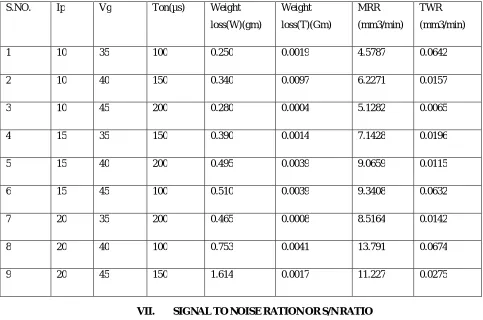
TABLE 5: - OBSERVATION TABLE
S.NO. Ip Vg Ton(µs) Weight
loss(W)(gm)
Weight
loss(T)(Gm)
MRR
(mm3/min)
TWR
(mm3/min)
1 10 35 100 0.250 0.0019 4.5787 0.0642
2 10 40 150 0.340 0.0097 6.2271 0.0157
3 10 45 200 0.280 0.0004 5.1282 0.0065
4 15 35 150 0.390 0.0014 7.1428 0.0196
5 15 40 200 0.495 0.0039 9.0659 0.0115
6 15 45 100 0.510 0.0039 9.3408 0.0632
7 20 35 200 0.465 0.0008 8.5164 0.0142
8 20 40 100 0.753 0.0041 13.791 0.0674
9 20 45 150 1.614 0.0017 11.227 0.0275
VII. SIGNALTONOISERATIONORS/NRATIO
The S/N ratios for MRR are calculated as given in Equation [1]. Taguchi method is used to analysis the result of
response of machining parameter for “larger is better” criteria for MRR, lower is the batter for TWR.
LB: η =
-
10 log [1/nΣ
in
Yi
-2]
Where η denotes the S/N ratios calculated from observed values, yi represents the experimentally observed value of the
TABLE 6:- OBSEVATION TABLE OF S/N RATIO (TWR)
S.NO. 1 2 3 4 5 6 7 8 9
TWR
Mm3/min
0.0642 0.0157 0.0065 0.0196 0.0115 0.0632 0.0142 0.0674 0.0275
S/N ratio
dB
23.8492 36.0820 43.7417 34.1548 38.7860 23.9855 36.9855 23.4262 31.2133
Table 6 is the table of the TWR and S/N ratio of the TWR this table will be used for plotting the graph manual method between controllable factor and S/N ratio for study of the maximum tool wear rate and minimum tool wear rate.
TABLE 7 MEAN RESPONSE TABLE FOR MEANS (MRR)
SYMBOLS CONTROLLABLE
FACTOR
Mean (MRR)
Low Medium High
V Voltage 6.7459 9.6932 8.5653
I Current 5.3113 8.5165 11.1781
Ton Pulse on time 9.2368 8.1989 7.5685
TABLE 8 MEAN RESPONSE TABLE FOR MEANS (TWR)
SYMBOLS CONTROLLABLE
FACTOR
Mean (TWR)
Low Medium High
V Voltage 0.0326 0.0314 0.0323
I Current 0.02880 0.03443 0.03637
Ton Pulse on time 0.06473 0.0209 0.01066
Table 8 show the mean of the means for MRR for controllable factors it show the mean at three levels low, medium and high. Which are very important for find out the optimum parameters for minimum tool wear rate, and these all values are very important for plot the graph. Between mean of means v/s controllable factor.
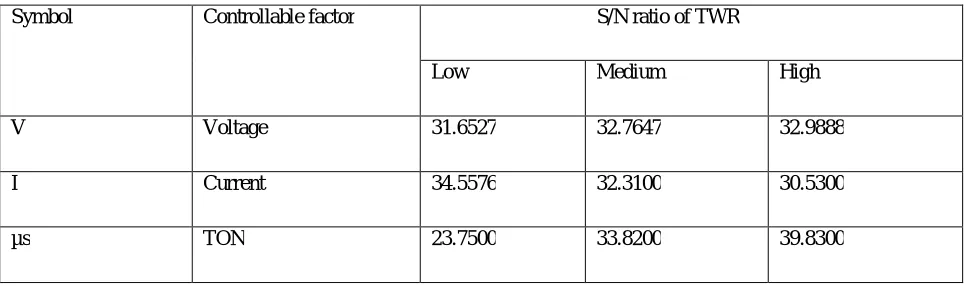
TABLE 9 MEAN RESPONSE TABLE FOR S/N RATIO FOR TWR
Symbol Controllable factor S/N ratio of TWR
Low Medium High
V Voltage 31.6527 32.7647 32.9888
I Current 34.5576 32.3100 30.5300
µs TON 23.7500 33.8200 39.8300
0 5 10 15
35 40 45
MRR
0.03 0.031 0.032 0.033
35 40 45
VOLTAGE
TWR
VIII. RESULTSANDDISCUSSIONFORMRR
Voltage Current Ton
(a) (b) (c)
Fig.2 Main effects plot for means of MRR
Fig.show The Material removal increases with increase in the current continuously and the effects of the voltage will increase the material removal rate between 35 V -40 V after that the voltage graph decrease continuously 40 v- 45v with voltage. And the effect of the pulse on time on the material removal rate is high at the staring at low pulse on time, decrease with linear manner in the graph which decrease the material removal rate.
IX. RESULTSANDDISCUSSIONFORTWR
(a) (B)
0 5 10
100 150 200
MRR
0 5 10 15
10 15 20
MRR
0 0.02 0.04
10 15 20
current
(C)
Fig.3 Main effects plot for means of TWR
Fig. show the results of the mean of the means for TWR according the fig. 3 (a) of current V/S mean of means in this figure When the current increase the mean of the means increase continuously with increases in current. And the effects of the pulse on time are shown in the figure 3 (c) of Ton v/s mean of means, in this figure when increase in the pulse on time the mean of means decrease, according to the pulse on time.it decrease quickly from 100 µs to 150 µs and after that id decrease slowly shown in fig. 3 (c) And the effects of the voltage is negligible mean of means decrease from 35 v to 40 v after that it Increase at 40v to 45 v shown in fig.3 (a)
(a) (b) (c)
Fig. 4 S/N ratio curve for TWR
The tool wear rate mainly affect by the current, when the increase the pulse on time the tool wear rate increase with pulse on time according to the fig.4(c). Pulse on time increase quickly from 100 µs – 150 µs after that it’s increase continuously with increase in pulse on time to 150 µs -200 µs.so that tool wear rate increase as shown in figure 4. Tool wear rate decrease with increases in current and the tool wear increase with decreases in current shown in fig.4 (b). And the effect of the voltage, when the increase in voltage from 35 v -40 v, the tool wear rate small increase in
0 0.05 0.1
100 150 200
TON
mean of means
30 32 34
35 40 45
voltage
S/N ratio
25 30 35
10 15 20
current
S/N ratio
0 20 40 60
100 150 200
TON
linear manner after 40 v – 45 v the tool wear rate increase with the increase in the voltage in fig.4 (a). The main investigation for maximum material removal rate, the optimum parameters should be high current, high pulse on time and the medium voltage for EN-31 work piece. And for tool wear rate the optimum parameters should be medium voltage, low current and high pulse on time for copper tool electrode.
CONFIRMATION OF EXPERIMENTS
For maximum MRR the combination of the optimum parameters (V2, I3, and Ton1) it means medium voltage, high
current and high pulse on time. For this combination V2 = 40v, I3= 20 amp, and TON = 100µs the MRR is 13.791
mm3/min. For minimum TWR the combination of optimum parameters (V2, I1, and Ton3) it means medium voltage and
low current and high TON. For this combination V2 =35, I1=10 amp and TON = 200µs, the TWR is 0.0065 mm3/min.,
for minimum TWR, the S/N ratio combination of optimum parameters (V2, I3, and Ton1) it means medium voltage,
high current and low Ton. For this combination V2 = 40, I1 = 20 amp, Ton = 100µs
X. CONCLUSION
The EDM performance of copper tools was examined with EN-31 tool Steel. In this work, an attempt was made to determine the important machining parameters for performance measures like MRR, TWR. In the EDM process factors like discharge current, pulse on time and voltage Taguchi’s experimental design method is used to obtain optimum parameter combination for maximization of MRR and minimization of TWR
The material removal rate (MRR) mainly affected by peak current (Ip). Voltage has least effect on it.
The electrode wear rate (EWR) is mainly influenced by peak current and by pulse on time. The effect of gap voltage (Vg) is less on EWR and has least effect on it. . For minimum TWR, the S/N
ratio combination of optimum parameters (V2, I3, and Ton1) it means medium voltage, high current
and low Ton. For this combination V2 = 40, I1 = 20 amp, Ton = 100µs.
ACKNOWLEDGMENT
I express my deep sense of gratitude and indebtedness to my thesis supervisor Dr.MP SINGH Professor, Department of Mechanical Engineering and SANJAY SINGH assistant professor department of mechanical engineering for providing precious guidance, inspiring discussions and constant supervision throughout the course of this work. His timely help, constructive criticism, and conscientious efforts made it possible to present the work contained in this thesis.
I would like to express my sincere gratitude to my project guide “Dr. MP SINGH and SANJAY SINGH” for giving me the opportunity to work on this topic. It would never be possible for us to take thisproject to this level without his innovative ideas and his relentless support and encouragement.
I am grateful to my parents, brother and sister for their moral support all the time, the have been always around on the phone to cheer me up in the odd times of the work.
REFERENCES
[1] Abbas Md. N., Solomon D.G. and Bahari Md. F., “A review on current research trends in electrical discharge machining (EDM) ”, International Journal of Machine Tool and Manufacture, 47 (2007): pp. 1214-1228.
[2] Brajesh Kumar Lodhia, Sanjay Agarwal “Optimization of machining parameters in WEDM of AISI D3 Steel using Taguchi Technique in (2014) ”,6th CIRP International Conference on High Performance Cutting, HPC 14 (2014 ):pp.194 – 199
[4] Kumar Ashok, Bedi Kuldeep Singh, Dhillo Karaj Singh and Singh Rashpal, “Experimental investigation of machine parameters for EDM using U shaped electrode of EN-19 tool steel”, International Journal of Engineering Research and Applications, 1(4): pp. 1674- 1684. [5] Kiyak M. and Cakir O., “Examination of machining parameters on surface roughness in EDM of tool steel”, Journal of Materials Processing
Technology, 191 (2007): pp. 141144.
[6] Milan Kumar Das, Kaushik Kumar, Tapan Kr. Barman and Prasant Sahoo, “Optimization of Surface Roughness and MRR in Electrochemical Machining of EN31 Tool Steel using Grey-Taguchi Approach”, International Conference on Materials Processing and Characterization : 6 ( 2014 ) pp: 729 – 740.
[7] Poddar A., “Experimental investigation of MRR, surface roughness and overcut of AISI 304 stainless steel in EDM”, B Tech thesis, 2012. Production Technology, New Delhi, Tata McGraw Hill Education Private Limited, 34th reprint, 2012.
[8] Pragya Shandilya, P.k.jain, N.K. Jain, “Parametric optimization during wire electrical discharge machining using response surface methodology”, 38 (2012):pp. 2371 – 2377
[9] Puertas I., Luis C.J. and Alvarez L., “Analysis of the influence of EDM parameters on surface quality, MRR and EW of WC-Co”, Journal of Materials Processing Technology, 153- 154 (2004): pp. 1026-1032
[10] R.Rajesh and M. Dev Anand, “The Optimization of the Electro-Discharge Machining Process Using Response Surface Methodology and Genetic Algorithms”, International Conference on Modelling, Optimization and Computing (ICMOC - 2012) 38 (2012):pp.3941 – 3950. [11] Rajurkar K. P., Sundaram M. M. and Malshe A. P., “Review of electrochemical and electrodischarge machining”, Procedia CIRP, 6 (2013):
pp. 13-26.44
[12] Rajmohan T., Prabhu R., Subba Rao G. and Palanikumar K., “Optimization of machining parameters in electrical discharge machining (EDM) of 304 stainless steel”, International Conference on Modelling, Optimization and Computing, Procedia Engineering, 38 (2012): pp. 1030-1036. 43
[13] S.Vijaya Kumar, C.Srinivasan, P.Paramasivam, “investigate Parametric Optimization of Electric Discharge Drilling Machine Using Al-SiC Metal MatrixComposite International Journal of Science”, Engineering and Technology Research (IJSETR), Volume 4, Issue 1, January 2015 [14] Tomadi S.H., Hassan M.A. and Hamedon Z., “Analysis of the influence of EDM parameters on surface quality, material removal rate and