PREDICTION OF SITE-SPECIFIC GROUND-MOTION PARAMETERS
BY A NON-PARAMETRIC APPROACH
I.Perus1, P.Fajfar1
1Faculty of Civil and Geodetic Engineering, University of Ljubljana, Jamova 2, Slovenia
E-mail of corresponding author: pfajfar@ikpir.fgg.uni-lj.si
ABSTRACT
A non-parametric empirical approach, called the CAE (Conditional Average Estimator) method has been used for prediction of the ground-motion parameters on soil and rock sites and of soil factors representing the (de)amplification of peak ground and spectral accelerations on soil sites. Using a combined PEER and European database, the soil factors were predicted as a function of the intensity of ground motion, as well as a function of the magnitude. The results were compared with the results obtained by NGA and European GMPEs and with the soil factors used in different codes. The results of the study reveal that the soil factor decreases with increasing ground motion intensity in terms of accelerations and also with decreasing magnitude of the earthquake. Existing models yield very different results for soil factors. They seem to be mostly conservative. The problem of soil influence is still far from being solved.
INTRODUCTION
Seismic ground motion at a specific site depends on the local site characteristics. In the case of usual structures, the so-called soil factors, representing the ratio between relevant ground motion parameters (typically accelerations) at a soil and a rock site, are used for determining design ground motion parameters. In the case of important structures, like nuclear power plants, ground motion prediction equations (GMPEs) are used for the prediction of the ground motion parameters. GMPEs include soil characteristics, which are typically defined as the shear velocity at the upper 30m of the soil profile, Vs30.
The problem addressed in this paper is the estimation of the (de)amplification of ground motion at soil sites (compared to rock sites) as a function of the intensity of ground motion. Research has already been performed on this topic (e.g. [1], [2], [3], [4], [5], [6]). Soil factors are provided in codes (e.g. NEHRP Provisions [7], ASCE-7 [8] and Eurocode 8 [9]), and nonlinear soil influence is included in some GMPEs (e.g. NGA, see Earthquake Spectra [10], 2008). Huang et al. [11] proposed a family of site class coefficients which were calculated based on the NGA GMPEs. The problem is, however, that very different results are obtained with different proposals.
In our research, the prediction of ground-motion parameters on rock and soil sites was made by a non-parametric empirical approach, called the CAE (Conditional Average Estimator) method ([12], [13]), which does not take into account any a priori information about the phenomenon. In the paper, the CAE method is briefly summarized. The input and output parameters and the database used in the study are explained. Using a combined PEER and European database, the soil factors are predicted as a function of the intensity of ground motion. The results are compared with the soil factors used in NEHRP/ASCE-7 and Eurocode 8, as well as with the results obtained by an European GMPE (AB – Akkar and Bommer [14]) and NGA GMPEs (AS – Abrahamson and Silva [15], BA – Boore and Atkinson [16], CB – Campbell and Bozorgnia [17] and CY – Chiou and Youngs [18]). A comparison is made also with the HWL - Huang et al. [11] proposal.
COMPUTATIONAL PROCEDURE
The CAE method and input/output variables
Transactions, SMiRT 21, 6-11 November, 2011, New Delhi, India Div-I: Paper ID# 102
two different soil classes were analyzed, namely “soil” and “rock”. Class “soil” (S=0.33) includes data recorded on soils with 180m/s ≤ Vs30 ≤ 360m/s and data characterized as “soft soil” in the European database, whereas class
“rock” (S=1.0) corresponds to Vs30 ≥ 760m/s and data characterized as “rock” in the European database. The class
“soft soil” (S=0.0) which includes data recorded on soils with Vs30 < 180m/s and data characterized as “very soft
soil” in the European database, and class “stiff soil” (S=0.67) which corresponds to 360m/s < Vs30 ≤ 760m/s and data
characterized as “stiff soil” in the European database, were not analyzed in this study. The first (unknown, i.e. PGA
and Sa) and the second (known, i.e. M, Rjb and S) set of variables are called the output and input variables,
respectively. It was assumed that the fault type does not influence the soil amplification factor, therefore it was not used as an input parameter. For analysis, an appropriate database is needed, which provides empirical data of a sufficient number of recordings which include both input and corresponding output variables.
The basic equations of the CAE method [13] can be written as:
N n n n PGA A A G P 1 ln ˆ ln ,
N i i n n a a A 1 ,
2 2 2 2 2 22 exp 2 2 2
4 1 S n R n M n S M R n w S S w R R w M M w w w a (1)
where lnPGˆA is the estimated ln PGA. ln PGAnis ln PGA of the n-th recording in the database, Mn, Rnand Sn are
the input parameters of the n-th recording in the database, M, R and S are the input parameters under consideration, and wM, wR and wS are the smoothing parameters for M, R and S, respectively. In the case of the estimation of
spectral values, in Eq. (1) PGA is replaced by spectral acceleration Sa(T). Note that the upper mark in labels PGˆ , A
which indicates the estimation, will be omitted in the following text.
The choice of smoothing parameters is an important step in the CAE method, which influences the results of the prediction. Although some guidelines can be used, this choice is, for the time being, still subjective. In this study the same values for the smoothing parameters for magnitude and distance were used as in [13] (wM=0.4,
wR=0=3 km and wR=50=8 km). For the smoothing parameter for soil class, wS = 0.1 was chosen. Such a small value
practically eliminates the influence of the recordings obtained on soils, which belong to a class different than the investigated one.
An intermediate result in the computational process (Eq. (1)) is the estimated probability density function
of known input variables. It helps to detect the possible less accurate predictions due to the data distribution in the database and due to local extrapolation outside the data range. The higher the value is, the more registrations (relatively to the total number of registrations in database) with input parameters (e.g. M and Rjb) similar to the input
parameters of the sample registration under consideration exist in the database. When studying the influence of magnitude on the soil factor (see Section Results), predictions characterized by a low value were eliminated.
The database and limitations
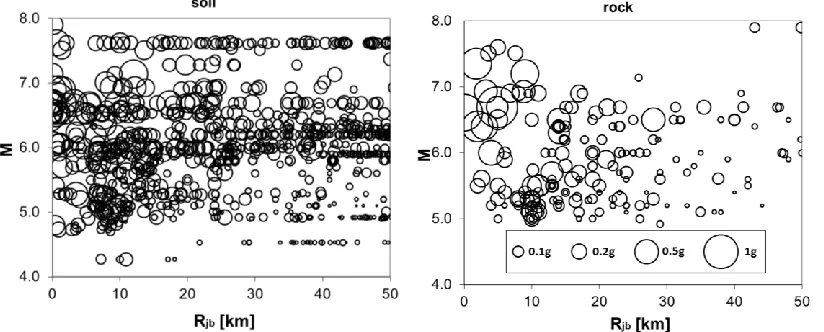
The PF-L database [13] includes all records (3550 records representing both main and after-shocks) which are included in five PEER-NGA databases ([10], [19]) and in the European database [14]. For illustration, parts of the PF-L database (Rjb ≤ 50 km) are shown in Fig. 1. Both “soil” data (180m/s ≤ Vs30 ≤ 360m/s) and “rock” data (Vs30
≥ 760m/s) are presented. Bubble size relates to the value of the peak ground acceleration. Considering the scarcity of “rock” data for magnitudes smaller than 5 and larger than 7, only input parameters within 5 ≤ M ≤ 7 and 0 km ≤ Rjb
≤ 50 km were taken into account for the determination of soil factors, although all available data were considered in analyses (Eq. (1)). Another feature of the database is a relatively small number of recordings with larger ground accelerations. (Note that for 45% recordings on soil and for 42% recordings on rock PGA was smaller than 0.05g.) Because very small accelerations have no engineering significance, only PGAs greater than or equal to 0.05 g are taken into account. For spectral accelerations, the lower limits of 0.1 g and 0.05 g were considered for Sa at T=0.2s
and T=1.0s, respectively.
Fig. 1: Data distribution for the combined PF-L database (European and NGA databases), used in the presented study. Shown are data for rock (235 recordings) and soil sites (1596 recordings) for distances Rjb < 50km.
Bubbles’ area corresponds to PGA
Soil factor
The soil factor SF = SF(M, Rjb, Ssoil, Srock) in terms of PGA is defined as the ratio between the estimated
PGA at a soil site PGAsoil and at a rock site PGArock. Both estimates are obtained by the CAE method (Eq. (1)). In
both cases the magnitude M and the distance from the fault Rjb are the same.
rock soil PGA
PGA
SF (2)
In the case of spectral values, in Eq. (2) PGA is replaced by spectral acceleration Sa(T).
In the study, the estimates of PGA (or Sa(T)) and the corresponding soil factors were determined for
different values of the input variables M and Rjb . These values were selected in two different ways. In the first
variant, Eq. (1) was used for the prediction of PGA (or Sa(T)) for M and Rjb corresponding to all recordings on
“soil” and “rock” sites in the PF-L database within 5 ≤ M ≤ 7 and 0 km ≤ Rjb ≤ 50 km. In the second variant, PGA
(or Sa(T)) for both soil types were calculated for discrete values of M and Rjb within the same range as above
(usually at constant magnitudes, M, for the increasing distances from the fault, Rjb). As noted previously, only the
results for PGA ≥ 0.05g, Sa(0.2s) ≥ 0.1g, and Sa(1s) ≥ 0.05g are considered.
RESULTS
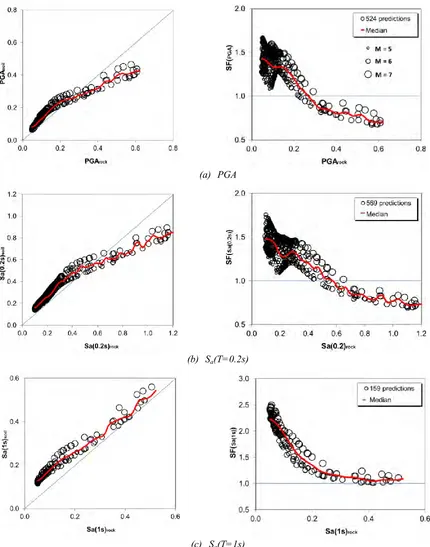
Selected results of the study are presented in Figs. 2 and 3. Fig. 2a shows the relation between PGAsoil and
PGArock, and soil amplification factors as a function of PGArock. Predictions were made for input variables M and Rjb
corresponding to recordings measured on rock and on soil sites in the PF-L database (first variant). It can be clearly seen that soil factor depends on the intensity of ground motion. With some exception at the low PGAs, the soil factor decreases with increasing PGA. At soil sites, site amplification occurs for PGA lower than about 0.3g. For larger
PGA, the accelerations at soil sites are smaller than at the rock sites. Qualitatively, these features have been well known (see references in Introduction). Qualitatively similar relations were obtained for spectral accelerations at
T=0.2s (Fig. 2b). In the case of spectral accelerations at T=1s (Fig. 2c) the soil factor is larger. It also decreases with increasing ground motion intensity. However, a de-amplification at soil sites does not occur. In addition to the discrete results of estimates, the continuous curves representing median results are also shown in Figs. 2. They were obtained by using CAE approach. Any other statistical technique could have been also used.
Transactions, SMiRT 21, 6-11 November, 2011, New Delhi, India Div-I: Paper ID# 102
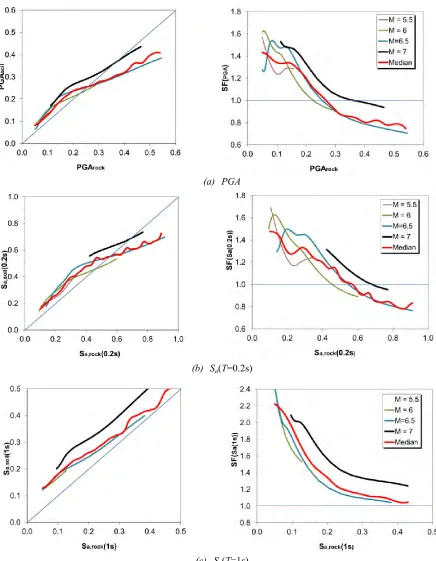
0.1g, and Sa,min(T=1s) ≥ 0.05g). Results presented in Fig. 3 clearly show that, at the same ground motion intensity at
a rock site, the soil factor increases with the magnitude.
(a) PGA
(b) Sa(T=0.2s)
(c) Sa(T=1s)
Fig. 2: Relation between predictions at soil and rock sites and the soil factor ((a) PGA; (b) Sa(T=0.2s); (c) Sa(T=1s)).
The diameter of bubbles corresponds to the magnitude
(a) PGA
(b) Sa(T=0.2s)
(c) Sa(T=1s)
Transactions, SMiRT 21, 6-11 November, 2011, New Delhi, India Div-I: Paper ID# 102
COMPARISON WITH EXISTING PROPOSALS
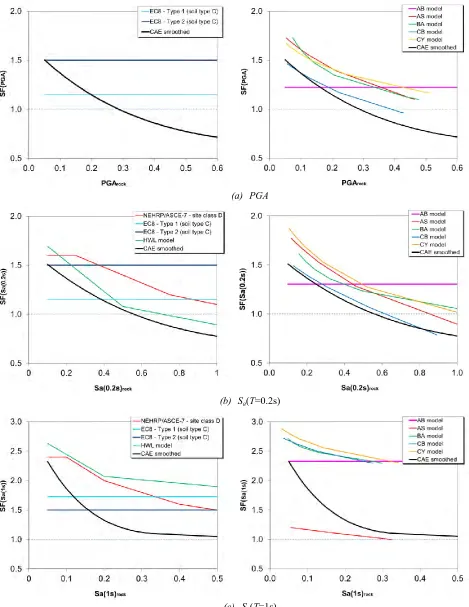
In this section, the soil factors (SFs) obtained by CAE were compared with existing solutions for PGA and spectral accelerations at T=0.2 and 1 second. Comparisons were made with SFs from codes (NEHRP [7] /ASCE-7 [8] and Eurocode 8 [9]) and with SFs proposed by Huang-Whittaker-Luco [11] (HWL), as well as with SFs obtained from four NGA GMPEs ([15], [16], [17], [18]) and the European AB model [14]. Note that the HWL model is based on the average SFs values from three NGA models for many different earthquake scenarios.
For Eurocode 8, SFs were determined as the ratio between spectral values for sites C (360m/s > Vs30 >
180m/s) and A (Vs30 > 800m/s, reference rock site), for two different spectral shapes (Type 1 and Type 2). In the
case of NEHRP / ASCE-7, SFs were determined as the ratio between spectral accelerations for sites D (360m/s >
Vs30 > 180m/s) and B (1500 > Vs30 > 760m/s, reference rock site). The HWL model uses the soil with Vs30 = 760m/s
as the reference site and provides soil factors for soils with shear-velocities of 1500, 360, 180 and 150 m/s. By a linear interpolation, SFs corresponding to a soil site with Vs30 = 270m/s and a reference rock site with Vs30 = 1130m/s
were obtained. These SFs were used for comparison in this section.
SFs for four NGA models were calculated for the scenario used by Perus and Fajfar [13]. In this study, only vertical strike-slip fault was used for M=7 and ZTOP=1 km. The median values Z1.0=0.034 km and Z1.0=0.024 km,
recommended by the original authors for a case where the soil/sediment depth was not known, were used for the AS and CY models, respectively. The CB model includes Z2.5, which represents the depth to VS=2.5 km/s. A value of
Z2.5=0.64 km, recommended by the original authors, was used. In the case of the European AB model, the soil site is
defined by Vs30 ≤ 360m/s and the reference rock site by Vs30 ≥ 760m/s.
The existing SFs recognize the decrease of SFs with increasing ground motion intensity. The only exception is the AB European model. The EC8 soil factors for each of two spectral shapes are independent on the ground motion intensity. However, a distinction is made indirectly, because Type 1 spectrum is intended for earthquakes with larger magnitude.
Comparisons shown in Fig. 4 demonstrate large differences between results obtained by different approaches. The CAE predictions for SFs are represented by smoothed median curves plotted in Figs. 2 and 3. The CAE soil factors are generally smaller than the existing SFs. Some exceptions represent the European models, i.e. EC8 type 1 (for Sa(T=1) also Type 2) and AB model, in the case of small ground motion intensity. The NEHRP /
ASCE-7, the HWL and the NGA results provide higher SFs, with the exception of the AS NGA model, which yields very low values in the case of the spectral acceleration at T=1. Interestingly, the SFs for CB NGA model match very well with CAE in the case of PGA and Sa(T=0.2). Note that the SFs for the NGA models were determined for M=7.
However, the influence of magnitude on the soil factors determined from the NGA models is very small.
CONCLUSIONS
The main conclusions of the study are as follows:
The soil factor depends strongly on the ground motion intensity. It decreases with increasing intensity in terms of peak ground and spectral accelerations.
The soil factor depends also on the magnitude of the earthquake. It increases with increasing magnitude. Existing models yield very different results for soil factors.
Existing models seem to predict mostly conservative soil factors.
The results suggest that the problem of predicting the site (de)amplification of seismic ground motion is far from being solved and that additional research is needed. The rapidly increasing databases of recorded ground motions will facilitate the development of more reliable ground motion predictions.
(a) PGA
(b) Sa(T=0.2s)
Transactions, SMiRT 21, 6-11 November, 2011, New Delhi, India Div-I: Paper ID# 102
REFERENCES
[1] Seed, B.H., Idriss, I.M., “Ground motions and soil liquefaction during earthquakes”, EERI publication, 1982.
[2] Darragh, R.B., Shakal, A.F., “The site response of two rock and soil station pairs to strong and weak ground motion”, Bulletin Seis.Soc. America Vol. 81(5), 1991, pp. 1885-1899.
[3] Borcherdt, R.D., “Estimates of site-dependent response spectra for design (methodology and justification)”,
Earthquake Spectra Vol. 10, 1994, pp. 617–653.
[4] Choi, Y., Stewart, J.P., “Nonlinear site amplification as a function of 30 m shear wave velocity”,
Earthquake Spectra Vol. 21(5), 2005, pp. 1-30.
[5] Walling, M., Silva, W., Abrahamson, N., “Nonlinear site amplification factors for constraining the NGA models”, Earthquake Spectra Vol. 24(1), 2008, pp. 243-255.
[6] Zhao, J.X., Zhang, J., Irikura, K., “Side effect of using response spectral amplification ratios for soil sites – variability and earthquake-magitude and source-distance dependent amplification ratios for soil sites”, Soil dynamics & earthquake engineering, Vol. 29, 2009, pp. 1262-1273.
[7] Building Seismic Safety Council (BSSC), “NEHRP Recommended Provisions and Commentary for Seismic Regulations for New Buildings and Other Structures”, FEMA 450CD, 712 pages, Washington DC, 2003.
[8] American Society of Civil Engineers (ASCE), “Minimum design loads for buildings and other structures”, ASCE/SEI 7-10, American Society of Civil Engineers, 650 pages, Reston, Virginia, 2010.
[9] CEN, Eurocode 8, “Design of structures for earthquake resistance, Part 3: Assessment and retrofitting of buildings”, EN 1998-3, March 2005.
[10]Earthquake Spectra, Special Issue on the Next Generation Attenuation Project. Vol. 24(1), 2008, pp. 1-341. [11]Huang, Y., Whittaker, A.S., Luco, N., “NEHRP site amplification factors and the NGA relationships”,
Earthquake Spectra Vol. 26(2), 2010, pp. 583-593.
[12]Perus, I., Poljansek, K., Fajfar, P. “Flexural deformation capacity of rectangular RC columns determined by the CAE method”, Earthquake eng. struct. dyn. Vol. 35(12), 2006, pp. 1453-1470.
[13]Perus, I., Fajfar, P., “Ground motion prediction by a non-parametric approach”, Earthquake eng. struct. dyn. Vol. 39(12), 2010, pp. 1395-1416.
[14]Akkar, S., Bommer, J.J., “Empirical equations for the prediction of PGA, PGV, and spectral accelerations in Europe, the Mediterranean region, and the Middle East”, Seism. Research Letters Vol. 81(2), 2010, pp. 195-206.
[15]Abrahamson, N.A., Silva, W.J., “Summary of the Abrahamson & Silva NGA Ground motion Relations”,
Earthquake Spectra Vol. 24(1), 2008, pp. 45-66.
[16]Boore, D.M., Atkinson, G.M., “Ground motion prediction equations for the average horizontal component of PGA, PGV, and 5%-damped PSA at spectral periods between 0.01 s and 10.0 s”, Earthquake Spectra
Vol. 24(1), 2008, pp. 99-138.
[17]Campbell, K.W., Bozorgnia, Y., “NGA Ground motion model for the geometric mean horizontal component of PGA, PGV, PGD and 5% damped linear elastic response spectra for periods ranging from 0.01 to 10 s”, Earthquake Spectra Vol. 24(1), 2008, pp. 139-171.
[18]Chiou, B.S.J., Youngs, R.R., “An NGA model for the average horizontal component of peak ground motion and response spectra”, Earthquake Spectra Vol. 24(1), 2008, pp. 173-215.
[19]PEER NGA; http://peer.berkeley.edu/products/strong_ground_motion_db.html, 2010.