Role of Thermal Driven Buoyancy Flow on
Solidification Process of Continuous Slab
Caster
Rohit Y Jambhulkar1, Vikas Singh2, Praveen Mishra3, Raghavendra Krishnamurthy4
P.G. Student, Department of Mechanical Engineering, Birla Institute of Technology Ranchi1 Principal Scientist, Research and Development Division, Tata Steel Jamshedpur2,
Assistance Professor, Birla Institute of Technology Ranchi3, Researcher, Research and Development Division, Tata Steel, Jamshedpur4
ABSTRACT: The main objective of present work is to study the effect of thermal driven buoyancy flow (also called as natural convection) on solidification process of continuous slab caster. A three dimensional fluid flow, heat transfer and solidification model is developed and result obtain from model are combined with non-dimensional formula to discuss the role of thermal driven buoyancy force. Result shows the importance of thermal driven buoyancy flow, inertial flow from SEN jet and flow through porous media. The strength of thermal driven buoyancy flow depends upon the characteristic velocity, temperature difference and porosity of mushy zone. The most effect zone of thermal buoyancy flow is centre of the mould, region away from the meniscus, and mushy zone.
KEYWORDS: Continuous slab casting, thermal driven buoyancy flow, solidification, mushy zone.
I. INTRODUCTION
Metal casting process used in various manufacturing industry to get different shapes and components and alternative method to it is continuous casting. The continuous casting is more advantageous than conventional casting in terms of productivity, yield and quality assurance. For this reason, many research done to understand the process and improve the productivity. One of the research areas is thermal driven buoyancy flow. In tundish thermal driven buoyancy flow are studied which cause change in flow pattern [1-2].
Similarly, in continuous casting temperature difference created due to heat transfer and solidification. So what about the thermal buoyancy flow in mould and sub mould region of casting?
X. Huang et al [3]. were the first to study the effect of thermal buoyancy with modified Froude number and concluded that inertia force is more important than thermal driven buoyancy flow. They came to this result because of not considering the mushy region. Yang et al[4] predict that thermal buoyancy is important in mushy region but due to neglecting the effect of inter dendritic flow the thermal buoyancy flow result gets misreported. Saul Garcia et al[5]. Investigated the effect of buoyancy force over inertia force and concluded that thermal buoyancy is 10% of inertia force. They got this result because of not considering the mushy region.
In present research work the analysis of thermal driven buoyancy flow are carried out by developing three dimensional fluid flow and solidification model and result are discuss through non dimensional formula. It is expected this will provide better understanding in developing the mathematical model for continuous casting.
region and secondary cooling zone not considered.4) Thermodynamic and transport properties of steel are invariant.5) Turbulent is approximated using SST K- model of turbulence from various pervious acceptable work [6-8).
Continuity Equation:
+
( )= 0
... (1)Momentum Equation:
( )+ = + − − ( − ) ... (2)
Energy Equation:
( )+ ( )= ... (3)
=ℎ+ ∆
ℎ=ℎ + ∫
The liquid fraction, β can be defined as,
= 0 if <
= 1 if >
= −
− if < <
Mushy region refers to a region in which metal is neither pure liquid nor pure solid and temperature lies between liquidus and solidus. As liquid jet of molten metal strike the mould wall, there exist a chilled zone and at the centre of mould there exist a equiaxed crystal zone and in between there exist columnar dendrites. Both equiaxed crystal and columnar dendrites block the fluid flow. Some of the columnar dendrites get cut off by fluid flow and some remain attached to solid shell. A microscopic model is required to simulate the above phenomena but due to lack of computational power, mushy zone considered as a porous media and porosity equal to liquid fraction that is keep on changing with solidification. For mushy zone Kozeny- Carman equation is applied given by:
∆
=
( ) ...(4)
∆ / Is constant for the particular plane, , is constant throughout the porous media, then the velocity is given
by:
=
[ ( . )]
...
(5)
III. MODEL CONSIDERATION
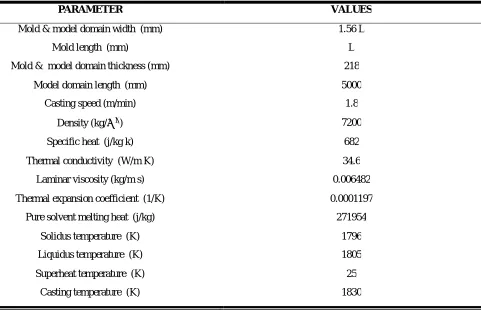
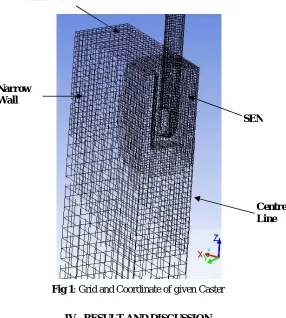
A numerical model was developed for continuous slab caster and solved on CFD commercial software FLUENT. Table 1 shows the geometrical parameter and steel properties of simulated model. Twine bore SEN is used with casting direction is negative Z-axis. Figure 1 shows the computational mesh for the given caster that has around 1700000 cells in structured mesh. This mesh was refining around the mushy zone for particular plane created to study thermal buoyancy force effect.
It is not easy to calculate the mould heat flux due to gap between mould and shell. Local heat flux are obtain by measuring the mould water volume and temperature at inlet and outlet. Savage Prichard in 1954 reported following relation for heat flux in mould [9]:
= 2.67
−
0.33
... (6)
The values of heat transfer below the mould from the strand surface to environment calculated by three modes: conduction, convection and radiation. Therefore, to predict the combine heat transfer coefficient trial and error method has adopted by knowing the spray cooling water volume from plant data
Table 1: Geometrical parameter and operating condition of simulated caster
PARAMETER VALUES
Mold & model domain width (mm) 1.56 L
Mold length (mm) L
Mold & model domain thickness (mm) 218
Model domain length (mm) 5000
Casting speed (m/min) 1.8
Density (kg/ ) 7200
Specific heat (j/kg k) 682
Thermal conductivity (W/m K) 34.6
Laminar viscosity (kg/m s) 0.006482
Thermal expansion coefficient (1/K) 0.0001197
Pure solvent melting heat (j/kg) 271954
Solidus temperature (K) 1796
Liquidus temperature (K) 1805
Superheat temperature (K) 25
Fig 1: Grid and Coordinate of given Caster
IV. RESULT AND DISCUSSION
1. Verification of Calculated Result
.
Fig 2: Comparison between Numerically Simulated and Measured Surface Temperature for given Slab Caster
Figure 2 shows the comparison between numerically simulated temperature and measured surface temperature in a given slab caster of a Tata Steel plant. It can be seen that the pattern for surface temperature given by simulated model is similar to the measured surface temperature from the plant data and can be used to validate the model.
Centre Line Narrow
Wall
Meniscus
2. Relative Importance Thermal Driven Buoyancy Force and Inertia Force by Jet Impinging.
In present work, Gr/ (called as Richardson Number) are consider to determine the importance of buoyancy driven flow and forced flow from SEN impinging jet, given by [10]:
=
∆=
In slab caster solidification are mainly in downward along the longitudinal direction and Sform narrow wall towards centre of the mould and thermal driven buoyancy occurs in lateral direction. is width of the mould and is the local velocity of convective heat transfer.
To study the effect of thermal driven buoyancy flow in mould; a plane is created at 800 mm downward form the meniscus perpendicular to the casting direction. Due to symmetry in the model any one half of the plane is considered that is from centre line towards narrow wall. The plane consist of three zones first liquid zone, where steel is in liquid form having liquid fraction 1. Next to, it is mushy zone whose liquid fraction varies from 1 to 0. Next to mushy zone is the solid zone where steel is in solid phase. Solid zone is not considered in study.
When Gr/ ratio tends to zero it means inertial force is dominant over and when it is above 1 thermal force is dominant. Considering this, Gr/ ratio for liquid zone and mushy zone are shown in figure 3 and figure 5.
In liquid region; at the centre line of the plane Gr/ ratio is below zero (Gr/ = 0.952, =0.19 m/s, ∆ = 24.53 K) which indicate the dominancy of inertia force over buoyancy force. Moving in lateral direction towards narrow wall Gr/ ratio increasing and reach to a peak value (Gr/ = 71.94, =0.022 m/s, ∆ = 23.77 K). The velocity at the centre line of the plane is quite high due to recirculation of the steel flow as shown in figure 4.
(3)
(4)
In between, centre line and narrow wall where Richardson number reaches to peak value, velocity become very low.
A
Fig 3: Richardson Number and Solid Fraction at 800 mm from Meniscus in Liquid Region Fig 4: Velocity Vectors at
Near to end of liquid region, Gr/ ratio again goes below zero as jet from SEN increases the velocity in this region. Therefore, along the plane Richardson number is below zero; leaving a little portion where Richardson number is quiet high then it can be say that in liquid region the inertia force is dominant over thermal buoyancy force
.
In mushy region, Kozeny- Carman equation are applicable. According to Kozeny- Carman equation variation of velocity in mushy region are given by equation 5. Figure 6 shows the variation of velocity in mushy region. It indicates that velocity of steel flow dropping very rapidly. As 2% of liquid converted to solid, velocity decreases from 0.38 m/s to 0.00097 m/s. This cause Gr/ ratio to increase instantly to a value of 35216.23 and it is keep on increasing in mushy region (See figure 5). Which means in mushy region thermal buoyancy is dominant over inertia force and buoyancy force is responsible for the motion of fluid in mushy region
.
(5) (6)
Fig 5: Richardson Number and Solid Fraction at 800 mm from Meniscus in mushy Region Fig 6: Velocity in Mushy Region for Plane at 800 mm
The temperature of mushy region is low compare to the liquid zone due to which the density of the of fluid is high, which cause the fluid to move in downward direction under the action of gravity because of which fluid particles get some momentum and ultimately increased in velocity. Therefore, we can say that thermal buoyancy decaying the delay of velocity. In liquid region density of liquid is low due to which it moves in upward direction and inertia force is in downward direction. These two forces are in opposite direction. Therefore, thermal buoyancy speeds up the decay of velocity. However, due to the recirculation fluid moving in the upward direction so thermal buoyancy supporting the inertia and increasing the speed.
To investigate the buoyancy effect outside the mould, a plane created at 3000 mm downward from the meniscus perpendicular to casting direction. Figure 7 shows the change in Gr/ ratio along the plane in lateral direction for liquid zone. Gr/ ratio in liquid region is above 1 from centre of plane (Gr/ = 114.3, =0.018 m/s,
∆
= 24.93 K). It reaches to the peak Value (Gr/ = 5114.17, =0.0027 m/s,∆
= 24.83 K) near to centre. After this, it starts decreasing but remains well above the 1 till the end of the liquid region. These phenomena can be explain with figure 8.
The right side recirculation slightly shifted towards left and two circulations mixed due to which the Gr/ ratio reach to peak value as velocity is very low. However, it is observed that at 3000 mm from meniscus the velocity gets very low due to which for complete liquid region Gr/ ratio is above 1.
(7) (8)
Fig 7: Richardson Number and Solid Fraction at 3000 mm from Meniscus in Mushy Region.Fig 8: Velocity Vectors at Mid Plane and Plane at 3000mm from the Meniscus.
(9) (10)
Fig 9: Velocity in Mushy Region for Plane at 3000 mm Fig 10: Richardson Number and Solid Fraction at 3000 mm from Meniscus in mushy Region.
Fig 11: Richardson Number and Solid Fraction at 3000 mm from Meniscus in Liquid Region
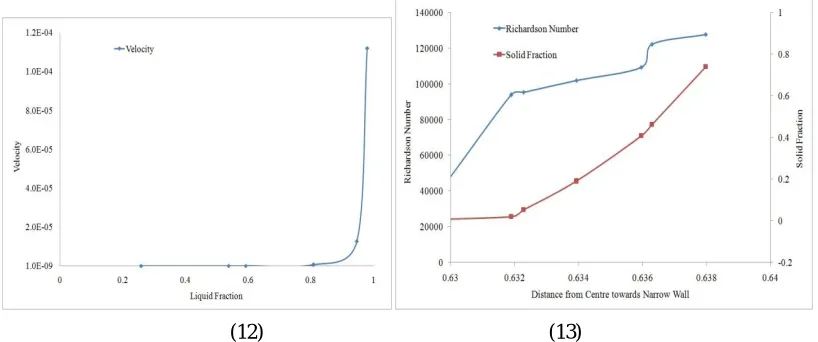
(12) (13)
.Fig 12: Velocity in Mushy Region Along Jet Fig 13: Richardson Number and Solid Fraction along the Jet in mushy
Region.
However, in mushy region velocity of jet suddenly drop to a value of 0.00011 m/s from 0.35 m/s when 2% of liquid phase changes to solid phase and change in velocity along mushy region shown in figure 12. In mushy region velocity drop continuously that cause Richardson number to increase throughout the mushy region indicated in figure 13 from start of mushy region towards end of it.From the above analysis, it can be seen that in mushy region only thermal driven buoyancy flow play an important role compare to the inertial force and buoyancy force is responsible for the motion of the fluid in mushy region.
Thermal buoyancy force plotted along the mushy region mushy region for the plane at 800 mm, 3000 mm downward from meniscus and along jet also. Figure 13, 14 and 15 indicate the ratio increase in buoyancy force along the mushy region. All the three figure shows same Patten of increasing in buoyancy force along the mushy region with little change in magnitude. It is observed that increasing buoyancy force ratio is almost 50% in mould region as in mould
(13) (14)
Fig 13: Thermal Buoyancy Force Ratio along the mushy region for plane at 800 mm Fig 14: Thermal Buoyancy Force
Ratio along the mushy region for plane at 3000 mm.
Fig 15: Thermal Buoyancy Force Ratio along the mushy region for jet region.
V. CONCLUSIONS
A 3-D fluid flow and solidification model has developed to study the effect of thermal driven buoyancy flow and conclusions derived from thee result are as follows:
1. It is observed that in mould region, inertial force is dominant over thermal buoyancy force in liquid zone. However, for mushy zone thermal driven buoyancy force is predominant and it is responsible for the motion of fluid in mushy region.
2. It is also observed that, region away from the meniscus thermal driven buoyancy force is dominant in both liquid zone as well as mushy zone.
3. Along the jet, inertial force is more important in liquid zone while in mushy region thermal buoyancy force play important role.
4. It is observed that for mushy region, anywhere in mould and sub-mould region thermal buoyancy play important role and there is almost 50% increasing in buoyancy force in mould region and 36 % increasing in jet region.
VI. NOMENCLATURE
g Acceleration due to gravity (m/s2)
, Velocity of steel flow along three dimensional coordinate
H Total enthalpy of material (J/Kg) ΔH Latent heat content of the cell (J/Kg) Cp Specific heat of solid and liquid (J/Kg K)
href Reference enthalpy (J/Kg)
Tsolidus Solidus temperature (K)
Tliquidus Liquidus temperature (K)
P Effective pressure (Kg/m s2) T Temperature (K)
Velocity in mushy region
z Cast length or distance below the meniscus (m) u Casting speed (m/s)
Gr Grashof Number Re Reynolds Number
ρ Density of solid and liquid (Kg/m3) β Liquid volume fraction
α Thermal diffusivity (m2/s)
REFERENCES
1. D.Y Sheng, C.S Kim, J.K Yoon, and T.C Hsiao: ISIJ Int.,38 (1998), 843 2. C. Damle and Y.Sahai: ISIJ Int.,36 (1996), 681.
3. X.Huang, B.G Thomas and F.M Najjar: Metall. Trans. B, 23B (1992),339.
4. H.L Young, L.G Zhao, X.Z Zhong, K.W Deng, W.C Li and Y. Gan: Metall. Trans. B, 29B (1998),1345. 5. Sual garcia-hernandez, Jose de Jesus Barreto, Rodolfo D. Morales : ISIJ Int.,53 (2013), 809.
6. B.Zhao, B.G Thomas, S.D Vanka and R.J O' Mally: Metall. Trans. B, 36B (2005),801. 7. P.Ramirez-Lopez and R.D Morales: Ironmaking and Steelmaking, 33 (2006), 157. 8. S.B Pope: Turbulent Flow, Cornell University Cambridge University Press, (2000) 373. 9. J. Savage and W. H. Prichard: J. Iron Steel Inst., 178 (1954), Nov, 269.
10. Chandrashekhar Damle and Yogeshwar Sahai: ISIJ Int.,36 (1996), 681
11. Fluid flow and Heat Transfer in Continuous casting Paul Matys university of Essen, West Germany 1985.
12. Hongaliang Yang, Liangang Zhao, Xingzhong Zhang, Yong Gan Kaiwen Deng: Metall. Trans. B, 23B (1998),1345. 13. M.R Aboutalebi, M.Hasan and R.I.L Guthrie: Numer. Heat Transfer A,28 (1995),279.
14. S. Mazumdar and S. K. Ray, “Solidification control in continuous casting of steel”, Sadhana, Vol. 26, Parts 1 & 2, February–April 2001, pp. 179–198.
15. F. M. Najjar, B. G. Thomas and D. E. Hershey: Metall. Trans. B, Vol. 26 B (1995), No. 4, 749.
16. Q. Yuan, B. Zhao, P. Vanka and B. G. Thomos, “Study of Computational Issues in Simulation of Transient Flow in Continuous Casting”, Steel Research Int. 76 (2005), No. 1, pp. 33-43.
17. S.A Sai and J.Szekely: ironmaking Steelmaking,3 (1975)205
18. Ambrish Maurya1 and Pradeep Kumar Jha: Int. J. Mech. Eng. & Rob. Res. 2014