ISSN(Online): 2319-8753
ISSN (Print): 2347-6710
I
nternational
J
ournal of
I
nnovative
R
esearch in
S
cience,
E
ngineering and
T
echnology
(An ISO 3297: 2007 Certified Organization)
Vol. 5, Issue 8, August 2016
Optimization of Pre-Processing Module for
Nadi Pariksha Yantra
Pavana.M.G 1, Shashikala.N 2,Dr. Joshi Manisha Shivram3, Dr.Shridhar.B.S4
U.G. Student, Department of Medical Electronics, BMS College of Engineering, Bangalore, India1,2 Assistant Professor, Department of Medical Electronics, BMS College of Engineering, Bangalore, India3
Professor and HOD, Dept. of Kayachikitsa, Govt. Ayurvedic Hospital, Bangalore, India4
ABSTRACT: Nadi Pariksha Yantra – “Pulse examination machine” is an automated system to find the diseases and other related information of the human body based on the pulse readings. In this project an attempt is being made to develop an optimized circuit for visualization of noise free Tridosha signals and reading the pulse rate of the Tridosha signals. The circuit for preprocessing of the signals was primarily developed using 8th order Bessel active filters however in order to optimize the circuit passive filters are used. Based on the waveform and pulse rate preliminary diagnostic test of the Nadi-pariksha can be performed.
KEYWORDS:NadiPariksha, tri-dosha signals, pre-processing module, passive filters, active filters.
I. INTRODUCTION
Identification of any diseases before treatment is very important in medical system [1]. Ayurveda is the ancient Indian system of medicine. In Ayurveda disease diagnosis is based on the dosha in an individual. Doshas are factors or agents which causes diseases in the body. Imbalance in vata, pitta and kapha causes diseases in human body. Vata, pitta and kapha are jointly called as Tridosha signals. In ayurvedic, there are eight different methods (Asthavidhapariksha) for diagnosis of imbalance in Tridosha signals. Among the eight different methods, the Nadi pariksha plays an important role in the identification of dosha in the human body. In Nadi Pariksha the Tridosha signals are measured by placing the three fingers at a proper position on the wrist of the patient [2]. Fig.1 shows the positioning of the fingers on the wrist of the patient. The sensation of the fingers corresponds to Tridosha.
The identification of the diseases from ayurvedic method probably costs lowest among the other existing diagnosis procedure. This is because just by studying the pulses in the wrist any ayurvedic practitioner can identify the diseases [1]. Therefore there is a necessity to develop a low-cost medical instrumentation based on the principle of Ayurveda for more accurate diagnosis.
Fig.1.Ancient method of Nadi Pariksha.
II. RELATED WORK
By using various sensors and methods in the recent years many devices were designed to read the Tri-dosha signal which helped in disease diagnosis. According to a recent development, a survey on Nadi Pariksha for Early Detection of Several Diseases and Computational Models Using Nadi Patterns. In this study, the author has explained about the quantitative measure of the Tridosha level (for Vata, pitta, and Kapha) using the pressure sensors which was placed on the wrist with Velcro tape. The sensors are further connected to three data acquisition channels through coaxial cables. The pulse data is observed on the computer screen to read the Nadi patterns [3].
Another development NadiAridhal: a pulse based automated diagnostic system. It is a non-invasive, computer aided device developed using three identical piezo-electric pulse sensors to capture the Tridosha signals. Springs are attached to the sensor to assist the doctor in applying required pressure. The raw signal acquired undergoes filtering to remove the unwanted frequency and the filtered signal is amplified .This amplified signal is read by a software application and displays the signal readings on the screen. Nadi Aridhal is the software used to plot the graph according to the pulse Signals. This software is the algorithm applied to the waveform to differentiate types of Nadi. By using the same sensor the pulse readings acquired with the digitizer of accuracy 8-bit, 12-bit and the readings was a plot. It was proven that this system has potential to measure, demonstrate and order the probable disease [4].
Another related development NadiTarangini: A Pulse Based Diagnostic System. At first, the pressure sensor was used to capture the radial signals which were insufficient to represent the waveform pattern, hence the adaptation of medium pressure sensors with diaphragm was used to capture the Tridosha signals. The data acquired from data acquisition card interfacing with the personal computer and the digitizer of 16-bit was digitized using the software LABVIEW, the frequency 500Hz analyzed the waveform and wavelet de-nosing technique was drawn to remove the intense high-frequency component. The Nadi patterns were observed [6].
Above all the developments, it is obvious that the ancient technique is being replaced by a device with suitable techniques and different sensors for examining the Nadi.
III.METHODOLOGY
The Tridosha signals are of very low amplitude and during acquisition, the noise gets added up. In order to visualize noise-free signal pre-processing of the signal is performed.
ISSN(Online): 2319-8753
ISSN (Print): 2347-6710
I
nternational
J
ournal of
I
nnovative
R
esearch in
S
cience,
E
ngineering and
T
echnology
(An ISO 3297: 2007 Certified Organization)
Vol. 5, Issue 8, August 2016
between the incident and reflected light is used in calculating the signal at a particular time interval. The sensors must be placed at a proper position in order to get a proper signal.
Roopini et al [7] proposed 8th order Butterworth filter for pre-processing of the Tridosha signal using optical pulse sensor. This paper describes an optimized Nadi Pariksha system developed using active and passive filters. For the acquisition of the signal from the patient radial artery , optical pulse sensors are used. Since there are three signals to be visualized, three pulse sensors are used. These sensors are placed adjacent to each other on a tape touching each other at the edges and stitched as shown in theFig2.
Fig.2. Optical Pulse sensor
The hardware set-up for the visualization of the raw signal is shown in shown in the Fig.3. and raw tridosha signals obtained from the set-up are shown in the Fig.4. The raw output signals obtained are of very low amplitude (in µv) and accompanied by random noise.For accurate diagnosis and post processing signal conditioning would be an important step.
Fig.3. Hardware setup Fig.4 Raw output signal before signal conditioning
IV.SIMULATIONANDRESULTS
In the following sections, design and development of pre-processing modules using active and passive filters has been discussed.
A. Design of pre-processing module using active filters
Fig.5. Preprocessing module developed using active filters
In the previous work by Pavana et al [8] spectral analysis of the Tridosha signals and comparison of Bessel and Butterworth filter for Tridosha signal was performed using different ordered filters. Based on the results obtained, an 8th ordered cascaded Bessel high filter was used for Vata signal. For pitta and Kapha, 8th ordered cascaded Bessel low-pass filters were used for designing the active filters for pre-processing of Tridosha signals.
Fig.6. The circuit diagram of 8th order high-pass and Low-pass Bessel filter for Tridosha signal
The circuit diagram for the development of the 8th order high pass filter for Vata signal and 8th order low pass for pitta and Kapha signal implemented in the LTspice software is shown in the Fig .6
Fig.7. Bode plot of high pass and low-pass 8th order Bessel Filter
Corresponding Bode plots is shown in the Fig 7. From the Bode plot, it can be inferred that the phase of the 8th order filter is linear.
ISSN(Online): 2319-8753
ISSN (Print): 2347-6710
I
nternational
J
ournal of
I
nnovative
R
esearch in
S
cience,
E
ngineering and
T
echnology
(An ISO 3297: 2007 Certified Organization)
Vol. 5, Issue 8, August 2016
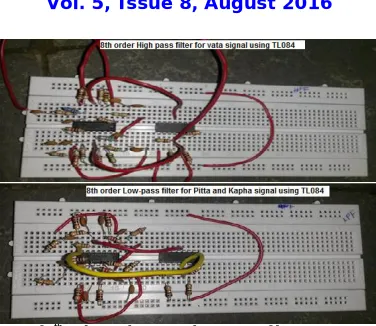
Fig.8. Hardware circuit of 8th order High-pass and Low-pass filter using TL084 IC for Tridosha signal
In this circuit, two ICs are used for filtering and amplification respectively. The signal processing circuit developed using TL084 is shown in the Fig.8.
The hardware setup for the visualization of the signal is shown in figure.9. The output signal from the signal conditioning circuit is connected to the Aurdino for A to D conversion. The digitalized output signal from the Aurdino is visualized in the Labview.
Fig.9 Hardware setup for visualization of filtered Tridosha signals
The developed source code for the visualization of the Tridosha signals in Lab view is shown in Fig 10. The sample output is shown in the Fig. 11
Fig.11. Result obtained using TL084 IC in Labview
The output shows the waveform of the digitalized Tridosha signal and the pulse rate of each signal. Even though the pulse rate and waveform of the Tridosha signal were agreeably, circuit was still bigger. Hence attempt has been performed to make the circuit even smaller which could be used as wearable device. In the next section, the system developed using passive filters is discussed.
B. Design of pre-processing module using passive filters
In the attempt to make the circuit as miniature as possible a common band pass filter whose cut-off frequency is same for all the Tridosha signals was used. The block diagram for the proposed optimized circuit is shown in the
Fig12.
Fig.12 Block diagram of proposed optimized circuit
The cut-off frequency of the Band-pass filter is 3-200Hz. In this optimization circuit, passive filters are used. The passive filter is a filter which uses passive components such as resistors, capacitors etc. Thus the number of electronic components in the circuit is reduced.
The circuit for the signal conditioning of the Vata signal is shown in the fig.13. LM358 IC is used for amplification with a gain of 470. The power supply to the circuit is given from external source.
ISSN(Online): 2319-8753
ISSN (Print): 2347-6710
I
nternational
J
ournal of
I
nnovative
R
esearch in
S
cience,
E
ngineering and
T
echnology
(An ISO 3297: 2007 Certified Organization)
Vol. 5, Issue 8, August 2016
The circuit for pitta and Kapha signal is also same, as shown in the Fig.16 but the only difference is the amplifier gain. The gain of the amplifier for Pitta and Kapha is slightly higher than that of the Vata this is due to the reason that the amplitude of the raw Vata signal is slightly higher than that of pitta and Kapha hence an amplifier of higher gain is required for Vata and pitta. The schematic of the circuit for pitta and Kapha is shown in the Fig.14. The Amplifier is designed for the gain 680 which amplifies the pulse signal to sufficient strength.
Fig.14. Optimized circuit for the signal conditioning of pitta and kapha signal
Here only one LM358 fourteen pin IC is used for the signal conditioning of the Tridosha signals which gives optimized circuit with desired performance.
Fig.15 Optimized hardware circuit on PCB Board
The complete signal conditioning circuit built on PCB board with SMD components attached to Aurdino and LCD module , as it will display the pulse rate as shown in Fig.15.
The filtered output of the Tridosha signal is visualized in the Labview.The Tridosha signal output obtained after preprocessing is shown in the fig. 16.
Fig.16 Filtered Tridosha signal output in Labview using optimized circuit
The output signal obtained is periodic and noises in the signal are also reduced. Based on the Pulse rate and the visualized signal preliminary diagnostic tests are performed
V. CONCLUSION
This research work represents design and development of optimized pre-processing module for NadiParikshaYantra for pulse signal analysis. The system has been designed with three optical sensors which are positioned on radial artery. In order to remove the noise induced due to the signal interaction with the skin and muscles, passive filters are designed.
The output obtained after signal conditioning has reduced interference of the noise. The signals are well amplified as a result Tridosha pulses obtained are more precise. Further, these results are suitable for post processing, feature extraction and classification purpose; which is the next step in this research work. The developed system will be an aid to Ayurveda practitioners as a preliminary diagnostic tool. The ayurvedic practitioners can predict the Prakurti to which the subject belongs to by comparing the pulse rate of the Tridosha signals and through visualization of the signals.
REFERENCES
[1] N.Arunkumar, K.M. Mohamed Sirajudeen, “Approximate entropy based Ayurvedic pulse Diagnosis for Diabetics – A case study” ,pp.133-135,
2011.
[2] SukeshRao M, RathnamalaRao, “Investigation on Pulse Reading Using Flexible Pressure Sensor”, International Conference on Industrial
Instrumentation and Control (ICIC), pp.213-216, 2015.
[3] Dhanalaxmi .Gaddam,” A Survey on NadiPareeksha for Early Detection of Several Diseases & Computational Models using Nadi Patterns”,
International Journal of Computer Science and Information Technologies, 2015.
[4] T.Thamaraiselvan ,M.Sharmila Begum,“NadiAridhal: A Pulse Based Automated Diagnostic System” pp.305-308,IEEE 2011.
[5] Lina Septiana, Wen-Chen Lin, Sheng-Cheng Huang, Kang-Ping Lin, “A Quantification Method for Radial Artery Pulsation Device”,IEEE
International Symposium on Bioelectronics and Bio-informatics (IEEE ISBB 2014).
[6] Joshi, A. Kulkarni, S. Chandran, V. K. Jayaraman, and B. D.Kulkarni, Naditarangini, “A pulse based diagnostic system”,Proceedings of the
29th Annual International Conference of the IEEE EMBS.
[7] N.Roopini, JM Shivram, “Design and Development of a system for NadiParikshsa” ,BMS College of Engineering, International journal of
engineering research and technology.
[8] Pavana.M.G,Shashikala.N,JM.Shivaram, “Design, development and comparative performance analysis of Bessel and Butterworthfilter for Nadi
Pariksha Yantra”,2nd IEEE International Conference on Engineering and Technology (ICETECH), 17th & 18th March 2016, Coimbatore, TN, India.
[9] T.Thamaraiselvan ,M.Sharmila Begum,“NadiAridhal: A Pulse Based Automated Diagnostic System” pp.305-308,IEEE 2011.
[10] Kalange A. E., Mahale B. P., Aghav S. T., Gangal S. "NadiParikshanYantra and Analysis of Radial Pulse", Physics and Technology of Sensors
(ISPTS), vol. 1,2012, pp. 165-168.
[11] Aniruddha Joshi, AnandKulkarni, SharatChandran, V.K.Jayaraman and B.D. Kulkarni,NadiTarangini“A Pulse Based Diagnostic System”,
Proceedings of the 29th Annual International Conference of the IEEE EMBS.
[12] Bhinav, SareenMeghna, Kumar Mahendra, AnandSneh, Salhan Ashok and SanthoshJayashree, “NadiYantra: A Robust System Design to
Capture the Signals from the Radial Artery for Non-Invasive Diagnosis,” The 2nd International Conference on Binformatics and Biomedical Engineering, pp. 1387–1390,May 2008
[13] Bhaskar Thakker, Anoop Lal Vyas, “Radial pulse Analysis at Deep Pressure in Abnormal Health Conditions”, in proc.of the IEEE 3rd