DOI: 10.1534/genetics.103.023945
Selection in Context: Patterns of Natural Selection in the Glycoprotein 120
Region of Human Immunodeficiency Virus 1 Within Infected Individuals
Alan R. Templeton,*
,1Rebecca A. Reichert,*
,2Anton E. Weisstein,*
,3Xiao-Fang Yu
†and Richard B. Markham
†*Department of Biology, Washington University, St. Louis, Missouri 63130-4899 and†Department of Molecular Microbiology
and Immunology, Johns Hopkins University School of Hygiene and Public Health, Baltimore, Maryland 21205
Manuscript received October 31, 2003 Accepted for publication April 20, 2004
ABSTRACT
Evolution of the HIV-1 V3 loop was monitored in 15 subjects over a period of 5 years at ⵑ6-month intervals. Putative recombination was detected in many of the sequences. Evolutionary trees were estimated from the nonrecombinant viral sequences found in each individual. Selection and altered demographic regimes were detected with logit and other contingency analyses in a highly context-dependent fashion. Mutations leading to amino acid substitutions are subject to positive selection over a broad range of clinical conditions in the nonsyncytium-inducing (NSI) form, and the growth rates of the NSI strains and their level of genetic subdivision change little in going from a healthy immune system to a severely compromised immune system. In contrast, the SI form has a significant increase in growth rate as the immune system goes from healthy to compromised, particularly in those subjects who did not receive any antiviral drug therapy. This increase in SI growth rate results in a significant growth advantage of SI over NSI when the immune system is compromised. The SI strains also show more demographic subdivision when the immune system is healthy than when the immune system is compromised, and the SI form has greater demographic subdivision than NSI in subjects with healthy immune systems who also are not receiving antiviral drug therapy. Positive selection on amino-acid-changing mutations weakens and then intensifies again in the SI strains in going from healthy to compromised immune systems. These patterns are consistent with other studies that suggest that NSI strains inhibit replication of SI strains, that the V3 loop is more hidden from the immune system in the NSI form, that evolution in the V3 loop influences cell tropism and coreceptor usage, that substrate for replication of SI forms increases as the disease progresses, and that death of CD8 cells is influenced by the type of coreceptor usage typically found in SI but not in NSI strains. Finally, the transition between NSI and SI forms is associated with a burst of evolutionary change due to strong positive selection at sites other than those that define the NSI/SI phenotypes.
T
HERE are three stages to human immunodefi- (AIDS) and is characterized by a final collapse of the ciency virus (HIV) infection (Leigh Brown and host’s immune system, high HIV viral titers, and a seriesHolmes 1994; Coffin 1999). The first stage, termed of opportunistic infections due to the host’s severely seroconversion, lasts for 7–8 weeks and is characterized suppressed immune system; these infections often be-by high viral titers within the body, the initiation of a come lethal. Although these three stages sequentially host immune reaction to the virus, and conversion from occur within any individual who dies of AIDS-related testing negative to testing positive for antibodies to HIV. illnesses, the time it takes a subject to progress through The second stage, termed latency, can last for a variable the last two stages is highly variable. Some individuals period of years and is characterized by relatively con- have a rapidly progressing infection and can move stant viral titers within the body and by decreases in through all three stages in⬍2 years. Others remain in host CD4 T-cell counts in most individuals. The third the latency period for over a decade without CD4 counts stage is termed acquired immune deficiency syndrome significantly decreasing and/or any indication of
AIDS-related illnesses.
Despite its name, the latency period is highly dynamic
Sequence data from this article have been deposited with the for both the host and the virus, involving continuous EMBL/GenBank Data Libraries under accession nos. AF016760–
rapid HIV-1 turnover, mutation, and evolution (Leigh
AF016825 and AF089109–AF089708.
BrownandHolmes1994;Bonhoefferet al.1995;Wei
1Corresponding author:Department of Biology, Campus Box 1137,
Washington University, St. Louis, MO 63130-4899. et al.1995; Coffin1999) along with a constant inter-E-mail: [email protected]
action between the host’s immune system and HIV-1 2Present address:Department of Medicine Education,
Newton-Welles-(Nowaket al.1995;Goudsmit1997). The potential for
ley Hospital, 2014 Washington St., Newton, MA 02462.
3Present address:Beloit College, 700 College St., Beloit, WI 53511. evolution during the latency period is high because the
viral reverse transcriptase has a large error rate (Leigh number of time points were analyzed for each subject (Markhamet al.1998). Indeed, this selective
heteroge-BrownandHolmes1994;Coffin1999), HIV-1 has a
short generation time of 1.2–2.6 days, and population neity was documented in our previous study on one of the larger cohorts to be studied: 15 subjects, followed sizes are 109–1010viruses within the body at any one time
in patients not treated with HIV antiretroviral medica- from seroconversion atⵑ6-month intervals, who display a broad range of overall disease progression trajectories tions (Perelsonet al.1996). Hence, during the latency
period, the HIV-1 population within one individual can (Markham et al. 1998). Markham et al. (1998) used analyses of synonymous and nonsynonymous differ-come to express high levels of variation and evolutionary
divergence (Coffin1995). ences and rates of divergence to reveal selective
hetero-geneity as a function of disease progression category. This study focuses on the glycoprotein coat that
af-fects HIV-1’s interaction with the host’s immune system The purpose of this article is to examine selection in the same 15 subjects as in the Markhamet al. (1998) (Goudsmit1997) and the target of host cell-type
prefer-ence (Shiino et al. 2000). The third variable domain study but to investigate a broader range of potential selective contexts. The contexts that we examine include on gp120, termed the V3 loop, contains an antigenic
site to which HIV-1 antibodies respond (Seibertet al. overall disease progression categories; the CD4 and CD8 T-cell counts observed at each visit; evolution within 1995; Goudsmit1997). The V3 domain also specifies
the coreceptor usage of HIV-1, which in turn determines NSI, SI, and transitional viral forms; and interactions among these factors.
target cell preference or cell tropism (Dittmar et al.
1997). Specific amino acid changes in the V3 loop re-gion alter coreceptor usage patterns and are therefore
SUBJECTS AND METHODS associated with a major phenotype switch in HIV-1: the
transition between nonsyncytium-inducing (NSI) to syn- The study population: The 15 HIV-1⫹ subjects were selected from a cohort of injection drug users participat-cytium-inducing (SI) forms that cause infected cells to
form large multinucleate bodies (syncytia). The NSI ing in the AIDS Linked to Intravenous Experience (ALIVE) study in Baltimore. This ongoing cohort study phenotype, associated with viral use of the CCR5
core-ceptor, dominates immediately after primary infection follows infected or at-risk injection drug users at 6-month intervals (visits), at which times blood was obtained for and during the latent phase. Although SI mutants,
which employ the CXCR4 coreceptor for viral entry, virologic and immunologic studies. All 15 subjects are thought to have contracted HIV from IV drug use after can arise from NSI forms by just one or two amino acid
changes in the V3 loop (Dittmaret al.1997), SI strains enrollment in the study. (The only possible exception involves two subjects who were sexually involved. While generally do not emerge as a dominant form until late
in infection and are correlated with worsened prognosis both used IV drugs and hence could have contracted HIV from IV drug use, there is the possibility that one and accelerated disease progression. The fact that the
SI forms can evolve from the NSI form by only one or contracted HIV via drug use and then sexually transmit-ted it to the other.) The earliest samples used in this two mutations yet do not dominate until late in infection
implies that there is some sort of selective force modulat- study were taken in 1989 and the last in 1993. The subset of individuals selected for this study was followed from ing this phenotypic switch (Callawayet al.1999;
Shi-ino et al. 2000). Hence, the V3 loop is a candidate the point of HIV-1 seroconversion and reflects different trajectories of CD4 T-cell counts. Rapid progressors region for selective effects exerted by the host’s immune
system, cell tropism, and the transition from NSI to SI were defined as having attained a level of⬍200 CD4 T cells within 2 years of seroconversion; moderate pro-forms.
In light of the many important functions coded for gressors had CD4 T-cell levels decline to 200–650 during the period of observation, and nonprogressors main-by the V3 loop of the envelope (env) gp120 gene, it is
not surprising that several studies have found evidence tained CD4 T-cell levels⬎650 throughout the observa-tion period.
for selection in this gene region, although the type and
pattern of inferred selection has varied among studies Only 5 of the 15 subjects received as monotherapy the weak antiviral drug AZT, which targets the product (Bonhoeffer and Nowak1994; Kelly 1994; Nowak
et al.1995;Seibertet al.1995;Endoet al.1996;Wolin- of thepolgene and notenv, the focus of this study. The compliance of these 5 subjects in taking their
medica-sky et al. 1996; Ganeshanet al. 1997;Liu et al. 1997;
McDonaldet al.1997;YamaguchiandGojobori1997; tion is not known, although compliance in injection drug users is often poor (Carrieriet al.2003;Palepu Markhamet al.1998;Shankarappaet al.1998). Given
the diversity of selective forces that can potentially oper- et al.2003;Woodet al.2003). With the exception of 1 subject and 1 visit for another, AZT was not prescribed ate on this gene, this heterogeneity among studies is
not surprising because many studies involved only a until the CD4 counts were⬍500. Given these facts and the observation that resistance emerges rapidly to single-small cohort of infected subjects, the subjects chosen did
had much impact in this group on the selective forces haplotype pairs that differ at many other nucleotide sites than to haplotype pairs that differ at only one or on theenvgene. However, these drugs might have had
an impact on viral demographic patterns, so our analy- a few nucleotide sites. We estimated a SP haplotype tree for each of the 15 individuals. In some cases, there ses of viral demography will be done both with and
without stratification on whether or not the subject re- were multiple solutions, all of which were statistically parsimonious. Hence, we sometimes had an SP set ceived antiviral drugs.
Sequencing of HIV-1envgenes:Nested PCR was used rather than a single, unique tree.
The initial SP haplotype tree or trees for each subject to amplify a 285-bp region of theenvelopegene,
includ-ing the V3 region of gp120 from peripheral blood is estimated under the assumption of no recombina-tion/gene conversion. This initial tree was used to test mononuclear cells (PBMC). Full details are given in
Markhamet al.(1998). A random sample of genes was for the presence of recombination/gene conversion (Crandall and Templeton 1999; Templeton et al.
sequenced from each subject visit, yielding a database
of 6–21 gp120 genomic sequences for 80 subject visits, 2000). This test is based on the property that programs for estimating haplotype trees will generate homoplasies with individual subjects being sampled over periods
ranging from 18 months to 5 years. The sequences ana- (multiple events at the same site) when recombination or gene conversion occurs. Such homoplasies could also lyzed for this study may be obtained through GenBank
(accession nos. AF01670–AF016825 and AF089109– be due to multiple mutational hits, but in that case the homoplasies should be scattered over the haplotype tree AF089708).
Determination of CD4 and CD8 cell counts and the and scattered over the sequenced molecule. When
ho-moplasies are created by such tree-building programs
presence of SI forms:CD4 and CD8 T-cell counts were
made on each subject at each visit. These counts were as an artifact of recombination or gene conversion, phys-ically close homoplasies are placed on the same branch converted into three categories for the statistical
analy-sis. The CD4 T-cell brackets used were (1)ⱖ650 cells/ of the tree. A runs test is then performed to see if the homoplasies are significantly clustered in the tree as an l, (2) between 200 and 650 cells/l, and (3) ⬍200
cells/l. These categories were consistent with those indicator of recombination and/or gene conversion, as detailed inTempletonet al.(2000). Whenever statisti-selected for previous analyses of this cohort (Markham
et al. 1998). The CD8 T-cell brackets used were (1) cally significant recombinants were identified, they and all their descendants were removed from the initial SP ⱖ1050 cells/l, (2) between 650 and 1050 cells/l,
and (3)⬍650 cells/l. These categories were chosen tree. Because the original recombinant haplotype can continue to evolve by mutational accumulation and di-because they result in roughly equal numbers of
ob-served mutations in all three categories. versification, branches removed from the SP tree but generated after recombination are classified in the stan-SI haplotypes were identified as those haplotypes
cod-ing for an arginine or a lysine at amino acid position dard manner, with the original recombinant being re-garded as the root of the postrecombination tree. For 306 in gp120 or a glycine at position 306 coupled with
an arginine or lysine at position 320 (De Jong et al. simplicity, we still refer to a “tree” being estimated for each subject, but some of these “trees” represent a set 1992). The viral population sampled at each visit was
tested directly for the presence of SI by examination of consisting of the SP tree with all detected recombination events removed plus any postrecombination evolution-the ability of virus to grow on MT-2 cells, which will
support only the growth of SI viruses. Cell-free viruses ary tree structure that accumulated in the descendants of the original recombinant. The numbers of nonsynon-recovered from infected PBMC were passed twice
through MT-2 cells to enrich for any SI variants that ymous and synonymous mutations on each branch were recorded for each subject. In subjects for whom there might be present. Virus replication was monitored by
the presence of p24 in the culture supernatants. Syncy- was no unique SP solution, we used the topology that gave the most conservative (least significant) results in tium formation was examined daily by use of a light
microscope. In all cases, the inferences made from the the logit and contingency analyses described below.
Statistical analysis of selection and demography:The
amino acid sequence were concordant with the
experi-mental determination of the presence of SI forms. tools used here for detecting selection and testing the hypothesis of neutrality and demographic stability are
Estimation of phylogenetic trees, recombinants, and
mutational counts:Trees were estimated separately for based on an extension of the contingency table
ap-proach developed byTempleton(1996), a logit analysis the sequences obtained from each of the 15 subjects
using the procedure given inTempletonet al.(1992) (Fienberg1977), and homogeneity tests of haplotype tree topology.
that is now commonly called statistical parsimony (SP;
Crandall 1994;Crandall and Templeton 1996) as The neutral theory assumes that mutations fall into two categories with respect to natural selection: deleteri-implemented with the computer program TCS
(avail-able at http://darwin.uvigo.es/). Statistical parsimony ous mutations and neutral mutations (Kimura and
Ohta1971). Under this theory, deleterious mutations utilizes the fact that multiple mutational hits at the same
do not contribute to DNA evolution. Neutral mutations of which may turn out to be evolutionary dead ends. The topological classes of tipvs. interior exist in both are not subject to natural selection, but can increase
in frequency and go to fixation due to the random intraspecific and combined intra-interspecific trees and therefore can be applied to studies on HIV-1 evolution evolutionary force of genetic drift. Hence, the neutral
theory predicts that only neutral mutations contribute within subjects.
Another criterion of evolutionary success is temporal to DNA evolution. Under neutrality, the rate of
evolu-tion equals the neutral mutaevolu-tion rate (Kimura and persistence. Our data consist of viral samples taken at multiple time points (visits) for each subject. Hence,
Ohta1971). The rate of neutral mutation is not
neces-sarily constant over all genes or over all types of muta- the branches of the intraspecific tree of gp120 genes can also be subdivided into two other topological classes: tional change within a gene because the probability of
a mutation being deleteriousvs.neutral is hypothesized intravisitvs.intervisit. Intravisit branches are those that interconnect haplotypes sampled at the same visit with-to vary across genes and across nucleotide positions
within a gene. For example, it is widely accepted that out connecting through a previously sampled haplotype or node in a previous intravisit tree. Intervisit branches synonymous changes, because they do not affect the
amino acid composition of the coded protein, are less are those that connect a haplotype or monophyletic clade of haplotypes observed in the sample at one visit likely to be deleterious and more likely to be neutral
than are nonsynonymous changes (McDonald and to haplotypes or nodes in the haplotype tree defined by haplotypes sampled in earlier visits. Note that an
Kreitman1991;Nielsen 2001). Although the neutral
mutation rate may vary between synonymous and non- intervisit branch will sometimes contain mutations that occurred during the same time period as some intravisit synonymous positions, the ratio in evolutionary
substitu-tion rates between these mutasubstitu-tional classes should be mutations, but the important feature is not the timeper se during which a particular mutation occurred, but the constant ratio of their underlying mutation rates
under the null hypothesis of selective neutrality. rather the qualitative feature that this branch marks a lineage that was able to persist over a longer period of The mutations that accumulate in a DNA region
with-out recombination also define a haplotype tree that time than an intravisit branch. Hence, mutations on the intervisit branches, regardless of the specific time period reflects the evolutionary origins of each haplotype. If
all accumulated mutations are neutral, all topological in which they arose, have demonstrated their evolution-ary success in persisting through time from at least one positions in the evolutionary tree should reflect the
same underlying constant neutral rates of mutational visit to the next, whereas mutations on intravisit branches have not demonstrated such temporal persistence. In-accumulation. Putting these two predictions together
leads to a simple test for neutrality: a contingency test tervisit and intravisit branches can also be subdivided into tips and interiors, but sample size considerations of homogeneity in which one dimension consists of
mutational categories and the other dimension consists led us to pool all intervisit branches together. We there-fore examine how synonymousvs.nonsynonymous mu-of distinct topological positions in the evolutionary tree
of mutational variation (Templeton1987;McDonald tations are distributed over three topological categories of branches in the gp120 gene trees: intravisit tip, intra-and Kreitman 1991). Under neutrality, homogeneity
is expected in such a contingency table even though visit interior, and intervisit.
Under neutrality, all contingency homogeneity tables the distinct mutational categories may have different
underlying neutral mutation rates. should be homogeneous across the
mutational/phylo-genetic classes. The null hypothesis of homogeneity The original topological positions were “fixed” (a
branch in the intra-interspecific tree that was a connec- could be tested with a standard contingency chi-square test for homogeneity (Templeton1996), but with three tion between two species) and “polymorphic” (branches
of the tree found within a single species; Templeton or more ordered tree topological categories, the Jonck-heere-Terpstra ( JT) test can be a more powerful alterna-1987;McDonaldandKreitman1991), but these
cate-gories are not applicable to the HIV-1 sequence data tive (Hettmansperger1984). The impact of selection should be strongest on the intervisit branches and weak-set. Another meaningful categorization of evolutionary
position is those mutations falling on “tip” branchesvs. est on the intravisit tip branches. The Jonckheere-Terp-stra test takes into account thisa prioriordination. How-“interior” branches (FuandLi1993;Templeton1996).
A tip haplotype is connected to only one other haplo- ever, we have noa prioriexpectation as to the relative numbers of nonsynonymousvs.synonymous mutations type or node in the tree. An interior haplotype is
con-nected to two or more other haplotypes or nodes in in each of these tree topology categories when selection is present. If selection were positive, we would expect the tree and hence represents an interior node in a
topological sense. Interior haplotypes tend to be older increasing deviations in favor of nonsynonymous muta-tions in going from tip to intervisit branches, but if than tip haplotypes, to be more frequent in the gene
pool, and to have left descendant haplotypes (Castel- selection were purifying, we would expect the opposite pattern. Therefore, a two-tailed Jonckheere-Terpstra
loeandTempleton1994). Hence, interior haplotypes
all tests were implemented as exact tests using the pro- the data well as judged by a nonsignificant (5% level) deviance statistic (the log-likelihood ratio test of the gram StatXact 5 (Cytel Software).
To increase power with sparse data sets, we sometimes specified modelvs.a saturated model that fits the data perfectly).
pooled the intravisit interior and intervisit classes
to-gether, as both represent branches with proven evolu- We used a chi-square test of homogeneity to investi-gate the relative fitnesses of NSI and SI strains and to tionary success. As there are only two topological
catego-ries in this case, the Jonckheere-Terpstra test is not explore potential demographic regimes under which viral subpopulations evolve. In the contingency and needed, so only a standard contingency test is used.
Because some cells had fewer than five observations, Jonckheere-Terpstra tests, mutations were classified into six mutational/tree classes (intravisit tip, intravisit inte-the significance levels of inte-these two-by-two tables were
evaluated with Fisher’s two-tailed exact test. rior, intervisit), which were then split into nonsynony-mous and synonynonsynony-mous. Under neutrality and demo-A cross-classified table can be extended to more than
two dimensions, and a useful method of analysis of graphic equilibrium, the proportion of mutations that fall into these six classes should be the same regardless higher-dimension contingency tables is a logit analysis.
A logit analysis requires a dichotomous response vari- of disease progression category, CD4 bracket, CD8 bracket, or NSI vs. SI forms. However, the topology able and categorical explanatory variables. The
re-sponse variable used to detect selection was the number and relative lengths of tip vs. interior branches can be altered by different selective and/or demographic of nonsynonymous vs. synonymous mutations. These
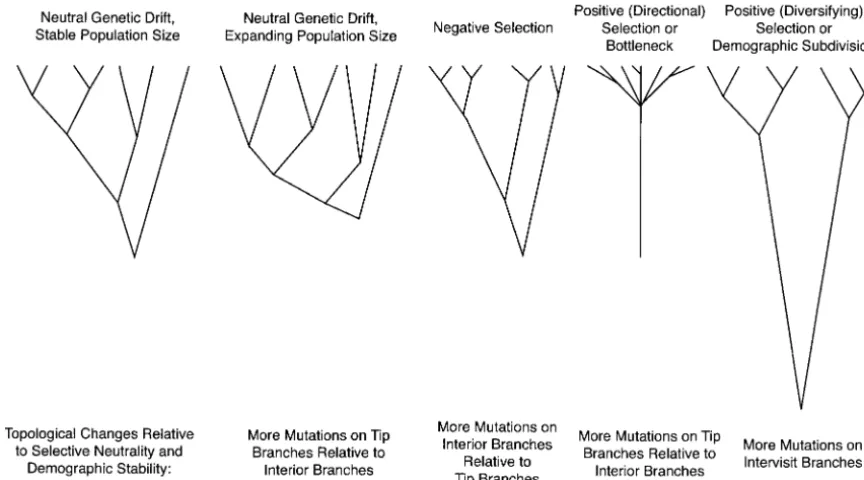
mutational counts were cross-classified with respect to regimes (Figure 4, redrawn from Page and Holmes
1998). For example, positive diversifying selection or five explanatory variables: (1) topological position in
the haplotype tree (tip, interior, intervisit); (2) disease demographic subdivision will cause the haplotype tree to have longer internal branches and more intervisit progression category (rapid, moderate, and
nonpro-gressors); (3) CD4 T-cell brackets based on the CD4 branches relative to tip branches when compared to neutral expectations with stable population sizes, T-cell counts associated with the particular subject visit
(or the root visit for intervisit branches); (4) CD8 whereas population growth or recent selective sweeps will cause a shift toward longer tip branches relative to T-cell brackets; and (5) branches in the haplotype trees
evolving within NSIvs.SI forms. Those branches transi- internal branches (Page and Holmes 1998). Hence, rejecting the null hypothesis that homogeneity for muta-tional between NSI and SI forms were used in a separate
analysis and are not included in either the contingency tional/tree classes across various categories is sensitive to heterogeneity in both selective forces and demo-or the logit analyses. The amount of data in any single
tree from one subject was insufficient for meaningful graphic attributes. We focused on demography by con-sidering only synonymous mutations that are a priori
statistical inference, so we pooled the cross-classified
data over all subjects. more likely to be selectively neutral.
We used the synonymous branch-length data in two A preliminary inspection of the data revealed that
the NSI and SI portions of the trees evolved extremely distinct, statistically independent fashions. First, we ex-amined the intravisit tip vs. intravisit interior synony-differently. Therefore, we performed separate logit
anal-yses on the NSI and SI portions of the data, with each mous branch lengths across different categories of HIV types or clinical conditions. This contrast tests the null analysis resulting in a five-dimensional table (the
re-sponse variable plus the remaining four explanatory hypothesis of homogeneity in relative growth rates (fit-ness). The second contrast pools all the intravisit synony-variables). The resulting five-dimensional tables had
many zero entries. Most of these were structural zeros mous branches together and contrasts them to the in-tervisit synonymous branch lengths. This test is (Fienberg1977); that is, these cells were empty by
defi-nition. For example, by definition a nonprogressor can- statistically independent of the first because the catego-ries tested for heterogeneity in the first test are pooled not have CD4 counts in the lower two categories. Many
other cells had sample zeros; that is, these cells were together in the second test, which is therefore mathe-matically invariant to the results of the first test. The empty in the sample but in theory observations could
have occurred within them. These were associated pri- relative mutational count on the intervisit to intravisit branches is an indicator of demographic subdivision marily with biologically unlikely but not impossible
com-binations, such as simultaneously having the lowest CD4 because with increasing subdivision there should be more intervisit branches.
category and the highest CD8 category in a rapid pro-gressor. Many nonzero cells had few observations for similar reasons. Accordingly, an exact logistic regression
RESULTS was implemented using the program LogXact 5 (Cytel
Software). As a result of structural and sample zeros, a SP haplotype trees or sets of SP trees were estimated for all 15 subjects under the assumption of no recombi-logit model that included all explanatory variables and
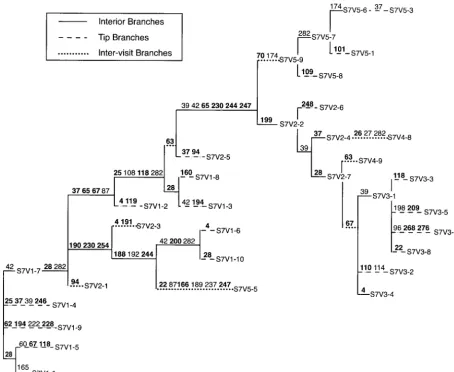
all possible interactions among them was greatly overde- nation or gene conversion. Figure 1 shows the SP haplo-type tree estimated for subject 7, which was chosen be-termined. We therefore tried many models to find the
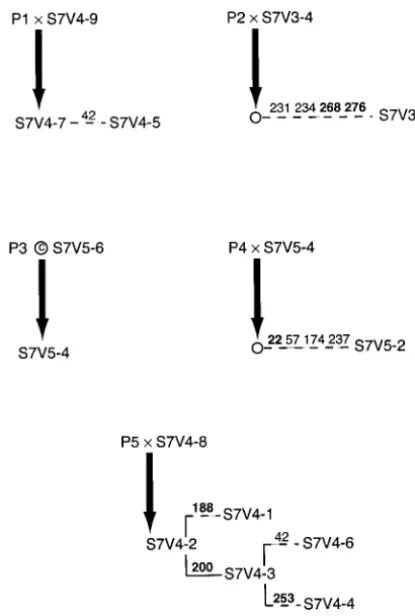
Figure 1.—The SP haplotype tree for subject 7 under the assumption of no recombination or gene conversion. Branches showing evolutionary change are given by horizontal lines. These lines are solid if the branch is an intravisit interior, dashed if an intravisit tip, and dotted if an intervisit branch. Vertical lines do not indicate any evolutionary change, but rather are used to show when multiple lineages diverge from a single ancestral haplotype or node in the tree. The numbers above the horizontal lines indicate the nucleotide positions that mutated on that branch. If the number is in boldface type, that mutation was nonsynonymous; otherwise, it was a synonymous mutation. Haplotypes are designated by the general format “S7Vx–y,” where S7 indicates that the haplotype is from subject 7, Vxindicates that the haplotype was observed at visit numberxof subject 7 (there were a total of five visits for this subject), andyis a number assigned to identify the distinct haplotypes observed at visitx. Nodes labeled Pz, wherezis an integer from 1 to 5, refer to putative parental types involved in recombination and/or gene conversion events (see Figure 2).
with respect to disease progression, mutational diversity, nant haplotype was created, including both the accumu-lation of additional mutational change and the produc-and amount of recombination. The estimated SP trees
or tree sets for the other 14 subjects are available on tion of new clades of haplotypes. The details of the other 28 recombination/gene conversion events are request to A. R. Templeton.
Following estimation of the SP trees under the as- available on request to A. R. Templeton. After inferring the recombination and gene conversion events, we elim-sumption of no recombination or gene conversion, we
tested for statistically significant recombination and/ inated the “branches” in the original SP haplotype tree that contained the homoplasies inferred to be due to or gene conversion events. A total of 33 events were
detected, ranging from 0 to 10 per subject. At least 1 recombination, resulting in a tree that no longer dis-plays connections to the inferred recombinants and recombination/gene conversion event was detected in
11 of the 15 subjects. Figure 2 presents the 5 statistically their descendants. Figure 3 shows the SP tree for subject 7 after the five recombination/gene conversion events significant recombination and gene conversion events
detected in subject 7. As Figure 2 illustrates, additional in Figure 2 have been removed from the original SP tree in Figure 1.
recombi-ses of the NSI and SI portions of the haplotype trees. Only the logit model with the fewest parameters that fits the data is given in Table 2. In both cases, eliminating any of the regression parameters shown in Table 2 re-sults in models that are rejected at least at the 5% level. The simplest logit model that fits the NSI data in-cludes only the topological categories of the branches. The simplest logit model that fits the SI data includes topological position in the tree, the interaction of topo-logical position with CD4 category, and the three-way interaction of topological position, CD4, and CD8 (Ta-ble 2). Because this model indicates that CD4 and CD8 levels interact in inducing heterogeneity across topolog-ical positions, the SI data are partitioned into all eight, nonzero combinations of CD4 and CD8 levels (the com-bination of CD4⬍200 and CD8⬎1050 had no observa-tions). Each combination is then analyzed with the Jonckheere-Terpstra test of nonsynonymous/synony-mous mutationsvs.tree topological categories and with the Fisher’s exact test by pooling the intravisit interior and intervisit branches to yield a two-by-two table. The only significant test was for the combination CD4⬎650 and CD8⬎1050, which yielded a Jonckheere-Terpstra test statistic of ⫺2.037 with a P-value of 0.0471 and Fisher’s exactP-value of 0.0010.
As discussed below, the above results indicated that
Figure2.—The statistically significant (Pⱕ0.05)
recombi-NSI forms are subject to positive selection in general, nation and/or gene conversion events inferred for subject 7.
whereas the SI forms are subject to strong positive selec-A total of five events were detected: four recombination events
tion when the immune system is healthy as indicated (⫻ between the two putative parental types) and one gene
conversion event (between the two putative parental types). by CD4 counts⬎650 and CD8 counts⬎1050. SI forms A thick, solid arrow points to the product of recombination are also subject to positive, albeit weaker, selection when and/or gene conversion, which can be either an observed the immune system is severely compromised, as indi-haplotype (designated as in Figure 1) or a indi-haplotype not
cated by CD4 counts ⬍200. We therefore performed directly observed in any sample but that left descendants
af-standard contingency chi-square tests on SIvs.NSI syn-fected by postrecombinational mutational change. Any
evolu-tionary change that occurred in the descendants of the origi- onymous branch-length counts under these two sets of nal recombinant is indicated as in Figure 1. clinical conditions, with respect to both intravisit tips vs.interiors and intravisitvs.intervisit branches (Table 3). A subpopulation growing more rapidly than a second After removing the homoplasies due to recombina- subpopulation should have proportionally longer tip tion, mutational counts were made on the remaining branches to interiors (Figure 4), so we measure the cladistic structure, with each individual mutation char- relative growth rates (fitnesses) of SI to NSI forms as acterized as synonymous or nonsynonymous and by (tip synonymous length/interior synonymous length)SI/ branch location (intravisit tip, intravisit interior, and (tip synonymous length/interior synonymous length)NSI. intervisit). For example, in subject 7 only those muta- These relative fitness estimates are also given in Table tions shown in Figures 2 and 3 are counted because the 3. Finally, we expect the ratio of intervisit synonymous additional “mutational” changes in Figure 1 are due to branch length to intravisit synonymous branch length statistically significant recombination events and not to to increase with increasing intensity of diversifying selec-new mutational events. Similar counts were performed tion and/or demographic subdivision. Therefore, we for the other 14 subjects. Also, the CD4 and CD8 counts measure the relative amount of subdivision/diversifica-for each visit were noted subdivision/diversifica-for the portion of the tree tion of SI to NSI forms as (intervisit synonymous length/ associated with that visit and for branches extending intravisit synonymous length)SI/(intervisit synonymous
from that visit to future visits. Table 1 shows the Jonck- length/intravisit synonymous length)NSI. These
estima-heere-Terpstra test of the pooled data for all subjects tors also appear in Table 3.
analy-Figure3.—The SP haplotype tree for subject 7 after the recombination and/or gene conversion events shown in Figure 2 have been peeled off the original SP tree (Figure 1).
it is not present during all visits (particularly early visits) observations in subjects with a compromised immune system (CD4⬍200) were in the presence of SI, so the in some of the subjects in which it evolves. Hence, many
of the entries in Table 3 for NSI come from subjects results given in Table 3 for a compromised immune system are unaltered. Neither of the tests in Table 3 for and visits in which no SI were present. We therefore did
a second analysis by limiting the NSI data to observations the healthy immune system was significant, and when inference was restricted to NSI forms in the presence made in the presence of SI to examine the comparative
demographics of NSI to SI when both coexist. All NSI of SI, both of the tests remained nonsignificant (P ⫽
TABLE 1
The Jonckheere-Terpstra test of the pooled data for all subjects of the mutational categories of nonsynonymous and synonymousvs.the tree topological positions of intravisit tip, intravisit interior, and intervisit branches
Phylogenetic position
Mutational type Intravisit tip Intravisit interior Intervisit
Nonsynonymous 552 290 219
Synonymous 247 75 61
Ratio nonsynonymous/synonymous 2.24 3.87 3.59
TABLE 2
The results of logit regression for NSI and SI forms of HIV
Minimum parameter model that Regression
HIV type fits data withP⬎0.05 coefficients Deviance d.f. P
NSI Constant ⫺0.8614a 0.2146 1 0.6432
Tree topology ⫺0.1895a
SI Constant ⫺0.7756a 16.8181 11 0.1134
Tree topology ⫺0.3882
Tree topology⫻CD4 ⫺0.0264
Tree topology⫻CD4⫻CD8 0.0172
d.f., degress of freedom;P, the probability under the hypothesis that the data are drawn from the estimated model.
aSignificantly different from zero at the 5% level.
0.2778 for the test of intravisit tipsvs.intravisit interiors, the overall demography of SI and NSI forms and thereby influence the tests results in Table 3 that are designed and P ⫽ 0.5453 for the test of intravisit vs. intervisit
branches). Hence, restricting the analysis to cases in to be sensitive to demographic conditions. The tests were therefore repeated by splitting each contingency which NSI coexists with SI alters none of the inferences
in Table 3. contrast in Table 3 into two separate contrasts: one for
observations made under antiviral drug therapy, and The other potential complication in making
demo-graphic inferences from Table 3 is the possibility of the other for observations made with no antiviral drug therapy (the numbers given in parentheses in Table 3). demographic heterogeneity induced by the use of
anti-viral drugs. Althoughenvis not the target of the antiviral All SI observations made in individuals with healthy immune systems occurred in subjects who did not re-drugs used, it is possible that such re-drugs could affect
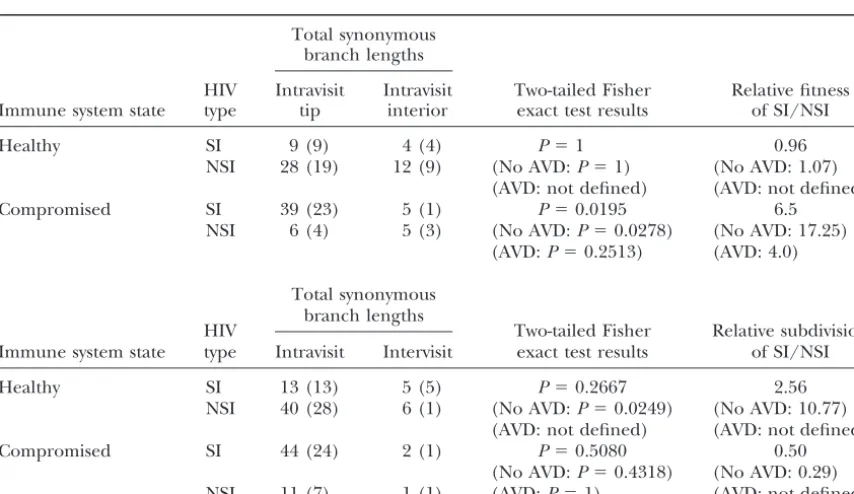
TABLE 3
Tests of homogeneity in demography in SI vs.NSI forms when the immune system is healthy (CD4⬎650, CD8⬎1050) and when the immune system is severely compromised (CD4⬍200)
Total synonymous branch lengths
HIV Intravisit Intravisit Two-tailed Fisher Relative fitness Immune system state type tip interior exact test results of SI/NSI
Healthy SI 9 (9) 4 (4) P⫽1 0.96
NSI 28 (19) 12 (9) (No AVD:P⫽1) (No AVD: 1.07) (AVD: not defined) (AVD: not defined)
Compromised SI 39 (23) 5 (1) P⫽0.0195 6.5
NSI 6 (4) 5 (3) (No AVD:P⫽0.0278) (No AVD: 17.25) (AVD:P⫽0.2513) (AVD: 4.0)
Total synonymous branch lengths
HIV Two-tailed Fisher Relative subdivision
Immune system state type Intravisit Intervisit exact test results of SI/NSI
Healthy SI 13 (13) 5 (5) P⫽0.2667 2.56
NSI 40 (28) 6 (1) (No AVD:P⫽0.0249) (No AVD: 10.77) (AVD: not defined) (AVD: not defined)
Compromised SI 44 (24) 2 (1) P⫽0.5080 0.50
(No AVD:P⫽0.4318) (No AVD: 0.29)
NSI 11 (7) 1 (1) (AVD:P⫽1) (AVD: not defined)
Figure4.—Expected haplotype tree topologies under various selective and demographic models (redrawn from Pageand
Holmes1998).
ceive antiviral drug therapy, so no tests of SIvs.NSI in of the null hypothesis of neutrality is due to excesses of nonsynonymous changes for intravisit interior and individuals with healthy immune systems were possible.
All test results and fitness and subdivision estimators for intervisit branches, the branches of proven evolutionary success. Under the assumption that synonymous muta-the analyses stratified by whemuta-ther or not antiviral drug
therapy was prescribed are given in parentheses in Ta- tions are more likely than nonsynonymous mutations to be neutral, this analysis indicates the presence of ble 3.
The data in Table 3 can be reorganized to test poten- overall positive selection that favors changing gp120 amino acid compositions in a diversifying and/or a di-tially different demographic regimes within SI and NSI
forms when the human immune system is healthy vs. rectional manner.
The logit analyses in Table 2 reveal that this overall compromised. These test results are given in Table 4, as
well as the estimators of relative fitness and subdivision pattern of positive selection contains underlying hetero-within SI and NSI forms under healthyvs.compromised geneity. One source of heterogeneity is the distinction immune system conditions. All the tests obtained by between NSI and SI forms. Both logit analyses reveal a confining the NSI inferences to those cases in which SI significant effect of tree topological position on the was present were not significant, so no alteration in the ratio of nonsynonymous to synonymous substitutions, inferences shown in Table 4 occurred. Table 4 also with the marginal logit-regression coefficient on tree shows the results of the analyses when stratified by topology being negative. The model was defined in whether or not antiviral drug therapy was prescribed. such a way that a negative tree topology coefficient All of the above analyses excluded those mutations indicates increasing proportions of nonsynonymous to found on the transitional branches between NSI and SI synonymous mutations from intravisit tips to intervisit forms. Table 5 presents the contingency analysis of the branches. Hence, the logit analyses indicate that positive branches containing amino acid replacement mutations selection occurs within both viral forms. However, the that alter the NSI/SI phenotype status vs. all other logit analyses also indicate that the context in which branches. Because the branches altering NSI/SI pheno- this selection occurs is different in NSI and SI forms. types must have one nonsynonymous mutation, the For NSI forms, only the tree topology regression coeffi-mutation altering the phenotype is removed from the cient is needed to fit the data well, and the logit analysis branches. Hence, the contingency analysis deals with reveals no significant effect on this positive selection by only replacement mutations other than the defining disease progression category, CD4 category, CD8
cate-ones at positions 306 or 320. gory, or their interactions. Hence, the NSI form is under
positive selection over a broad range of conditions. In contrast, logit analysis (Table 2) indicates that selection DISCUSSION
of SI forms is context dependent as a function of both CD4 and CD8 levels.
Table 1 shows strong evidence for selection when the
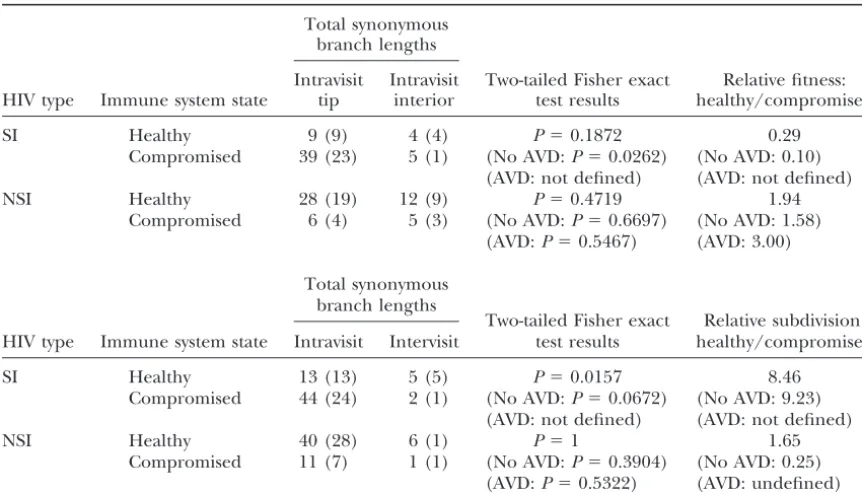
TABLE 4
Tests of homogeneity in demography within SI and NSI forms when the immune system is healthy (CD4⬎ 650, CD8⬎1050)vs.when the immune system is severely compromised (CD4⬍200)
Total synonymous branch lengths
Intravisit Intravisit Two-tailed Fisher exact Relative fitness: HIV type Immune system state tip interior test results healthy/compromised
SI Healthy 9 (9) 4 (4) P⫽0.1872 0.29
Compromised 39 (23) 5 (1) (No AVD:P⫽0.0262) (No AVD: 0.10) (AVD: not defined) (AVD: not defined)
NSI Healthy 28 (19) 12 (9) P⫽0.4719 1.94
Compromised 6 (4) 5 (3) (No AVD:P⫽0.6697) (No AVD: 1.58) (AVD:P⫽0.5467) (AVD: 3.00)
Total synonymous branch lengths
Two-tailed Fisher exact Relative subdivision: HIV type Immune system state Intravisit Intervisit test results healthy/compromised
SI Healthy 13 (13) 5 (5) P⫽0.0157 8.46
Compromised 44 (24) 2 (1) (No AVD:P⫽0.0672) (No AVD: 9.23) (AVD: not defined) (AVD: not defined)
NSI Healthy 40 (28) 6 (1) P⫽1 1.65
Compromised 11 (7) 1 (1) (No AVD:P⫽0.3904) (No AVD: 0.25) (AVD:P⫽0.5322) (AVD: undefined)
Because of small cell counts, all contingency tables are tested with the Fisher exact test. The counts for those subjects and visits receiving no prescription of antiviral drugs are shown in parentheses.
logit analysis of SI in Table 2. However, all three model turns when the immune system is severely compromised as indicated by CD4 counts⬍200.
parameters are needed together to fit the data;
drop-ping any one results in a significant deviance. The slight The results in Tables 3 and 4 give additional insight into the differences between NSI and SI forms in these negative regression coefficient associated with the tree
topology⫻CD4 parameter suggests that there is a ten- subjects. Table 3 shows that when the immune system is healthy, the fitnesses (relative growth rates) of the SI dency for positive selection to become stronger with
increasing levels of CD4. This result can be seen in the and NSI forms are not significantly different either for all subjects or for only those subjects not receiving antivi-fact that all but one of the JT statistics were negative
(data not shown), indicating positive selection. The ral drug therapy (no contrast between SI and NSI is possible in those subjects receiving such therapy as none strongest selection detected by the significant JT
statis-tic is associated with the highest CD4 levels, where the of them had any SI forms). However, when the immune fewest SI strains and smallest mutational sample sizes
were observed. The lack of marginal significance of the
TABLE 5 tree topology⫻CD4 parameter is not surprising in light
of the fact that intermediate levels of CD4 are associated Contingency analyses of the nonsynonymousvs.synonymous with levels of selection (an average JT of ⫺0.2997) mutations in NSI/SI transitional branchesvs.all other weaker than those at either low CD4 levels ⬍200 (an branches for all subjects
average JT of⫺1.2311) or high levels⬎650 (an average
Phylogenetic position JT of⫺1.4878). The positive regression coefficient
asso-ciated with the tree topology⫻CD4⫻CD8 parameter NSI/SI transitional All other
suggests a synergistic effect between CD4 and CD8 levels Mutational type branch branches
in inducing positive selection. The strength of selection
Nonsynonymous 38 1004
is greatly augmented by simultaneously having high
lev-Synonymous 6 377
els of both CD4 and CD8. Overall, Tables 2 and the JT
Contingency chi-square⫽4.05, d.f.⫽1, andP⫽0.0442. statistics indicate that SI forms are subjected to their
d.f., degrees of freedom;P, the probability of the null hypothe-strongest positive selection when the immune system is
sis being true given the data. Because all transitional branches healthy as indicated by high counts of both CD4 and
by definition have a nonsynonmous mutation at either posi-CD8. The SI forms are subject to little or weak selection tions 306 or 320, that mutation was removed from all counts in their V3 region when the immune system is at inter- of nonsynonymous mutations to eliminate the ascertainment
re-system is severely compromised, the SI form has a much terns of SI and NSI variants should consider the host immune system, the coreceptor environment at differ-higher and significantly different fitness than the NSI
form (Table 3), and the effect is particularly strong in ent times within the host, and the impact of the host environment on other factors in the virus life cycle. It subjects not receiving antiviral drug therapy (over a
17-fold difference). The relative fitness of SI to NSI is 4.0 is important to keep in mind that these explanations are not mutually exclusive and that components of all in those subjects receiving antiviral drug therapy, but
in this case the value is not significantly different from could be shaping the evolution of the V3 region. We first consider why SI viruses are under strong 1 as shown by Fisher’s exact test (Table 3). However,
there were very few observations for this contrast, so the positive selection when the immune system is intact. Since gp120, particularly the V3 loop, is an immune lack of significance may be due to small sample size.
Indeed, the relative fitnesses in recipients and nonrecip- system recognition site of HIV-1, selective pressure for “escape mutants” should affect this region (Leigh
ients of antiviral drug therapy are not significantly
differ-ent using an exact test, indicating that the SI form has Brown and Holmes 1994; May 1995; Nowak et al.
1995;Rowland-Joneset al.2001). In this regard, recent in general a growth advantage over the NSI form when
the immune system is severely compromised but not studies (Callawayet al.1999;Shiinoet al.2000) pro-vide epro-vidence for the hypothesis that the V3 loop of the when the immune system is healthy. Table 4 indicates
that this effect is due to a large 10-fold increase in the NSI form is more hidden from neutralizing antibody than is the SI V3 loop; that is, the amino acid changes growth rate of the SI form as the immune system goes
from a healthy to a compromised state in subjects not necessary for the SI form simultaneously make SI more apparent to the immune system than NSI. Greater im-receiving antiviral drug therapy (once again, the
ab-sence of SI in healthy individuals receiving antiviral mune apparency is consistent with our observations that the SI forms experience their strongest positive selec-drug therapy precludes testing the change in relative
SI growth rates in those subjects). In contrast, there is tion when the immune system is healthy. As the immune system becomes compromised and then collapses, selec-no significant change in the growth rates of the NSI
form, either overall or as a function of antiviral drug tion from this source should diminish and then disap-pear, and there should also be less of a growth inhibition therapy status, and the fitness values suggest that, if
anything, NSI does better when the immune system on SI forms relative to NSI (Callawayet al.1999; Shi-ino et al. 2000). The hypothesis of greater immune is healthy than when it is compromised—exactly the
opposite of the SI pattern. apparency of SI therefore could contribute to the large
increase in growth rates of SI as the immune system Table 3 also indicates that there is no significant
dif-ference in the amount of subdivision between SI and collapses and to the achievement of greater fitness of SI relative to NSI after the immune system is severely NSI in a compromised immune system state, but the SI
form shows significantly more demographic subdivision compromised (Tables 3 and 4). This hypothesis could also explain the patterns of increased demographic sub-than the NSI form under a healthy immune system when
no antiviral drug therapy is being given. Unfortunately, division in SI in individuals with healthy immune systems as the SI forms are driven to exist in those tissues and small sizes for SI precluded testing the relative degree
of subdivision in recipients of antiviral drug therapy compartments where there is little antibody penetra-tion. When the immune system collapses, the SI form with healthy immune systems. Table 4 indicates that the
changes in the relative degree of subdivision of SI to could emerge from these tissues, resulting in a decrease in the amount of subdivision, as was observed (Table NSI forms as the immune system changes from a healthy
to a compromised state are due to changes in the 4). This change in demographic and selective regimes with a collapsing immune system could contribute to amount of subdivision in the SI form. No significant
changes in subdivision are found for NSI, but the SI the switch in phenotypic dominance from NSI to SI over the course of the infection in rapid progressors form shows more subdivision when the immune system
is healthy than when it is compromised, with the change (Callaway et al.1999; Shiino et al.2000). However, immune apparency alone would not fully explain why being significant in the overall data and nearly
signifi-cant (0.0672) when restricted to subjects not receiving SI viruses become dominant when the immune system collapses, since both viral phenotypes would be under antiviral drug therapy (once again, we cannot test this
situation in the recipients of antiviral drug therapy be- less pressure from the immune system.
Another possible reason for the relative fitness of SI cause of missing classes). Thus, just as with the logit
model on selection, Tables 3 and 4 reveal little demo- forms to NSI forms increasing when the immune system collapses is suggested by the work ofXiaoet al.(2000), graphic context dependency for NSI but significant
con-text dependency for SI. which indicates that NSI forms can suppress replication
of SI forms when NSI are abundant. The transition from The patterns discussed above indicate that both NSI
and SI forms are subject to positive selection in the V3 NSI to SI is marked by the evolution of coreceptor use, with the NSI form primarily using the human CCR5 region, but in different contexts. Efforts to understand
form using both CCR5 and CXCR4 coreceptors (van forms (Horikoshiet al.2001). The fact that expression of this activation marker increases as disease progresses
Rijet al.2000). Indeed, the amino acid motif in the V3
region that we used to define SI is strongly associated (Kestens et al.1994) indicates an increased substrate for replication of CXCR4 virus replication, perhaps re-with CXCR4 usage (Shankarappaet al. 1999; Briggs
et al.2000).Xiaoet al.(2000) report that the HIV-1 Tat flecting the increasing relative abundance of CD8⫹ to CD4⫹cells as the disease progresses. This in turn would protein, which is secreted from virus-infected cells, is a
CXCR4-specific antagonist that can selectively inhibit facilitate the increased growth of SI relative to NSI forms as the disease progresses. As this favored target popula-the entry and replication of SI, but not NSI, forms in
peripheral blood mononuclear cells, thereby restricting tion of cells increases in abundance with disease progres-sion, selective forces could favor increased specialization the target cell substrate preferentially for the SI form.
Because SI forms also secrete Tat, there may be some in SI viruses to use CXCR4. Indeed, the ability of SI forms to use CCR5 declines and is lost over time (van
degree of self-inhibition, but under this model the
inhi-bition of SI is more severe when the NSI forms dominate Rijet al.2000). These observations are consistent with the hypothesis that SI is selected to become more and in abundance over SI and create a level of inhibition far
greater than SI self-inhibition. NSI forms predominate more of a CXCR4-using specialist as the disease pro-gresses. This in turn could also lead to less and less when the immune system is healthy. As the immune
system declines, NSI is no longer as abundant, so the demographic subdivision as the SI forms become more homogeneous in the types of cells they target.
replication suppression on SI should decrease to the SI
self-inhibition levels, leading to increased relative fitness These studies collectively identify multiple sources of potential selection within and between the NSI and SI of SI to NSI when the immune system is severely
compro-mised. However, a recent analysis of the relationship forms. None of the hypotheses outlined above can by themselves explain all our observations. However, these between CCR5-expressing and CXCR4-expressing cells
and viral phenotype has suggested that a restricted tar- hypotheses are not mutually exclusive, and therefore multiple selective forces could be operating either to-get cell substrate for viral replication is not a limiting
factor in virus selection and therefore may not be a gether or in a shifting temporal dynamic. Indeed, shifts in temporal dynamics are inevitable for these selective driving force in the shift from NSI to SI dominance
(van Rij et al. 2003). However, even if this inhibitory components, given the collapse of the immune system as the disease progresses, the shift in relative abundance effect does not dominate the demographic shifts in NSI
and SI, it could still induce selection on the V3 region of NSI to SI forms, the changes in abundance of CD8⫹ T cells, and the increasing abundance of CD38-activated and thereby contribute to the selective patterns that we
observed. target cells. Moreover, other selective forces that we
have failed to identify may be operating. Regardless, the The logit analysis (Table 2) indicates that CD8 plays
an important role in defining the selective and demo- results of this article show that the positive selection observed in the V3 region of HIV-1 is not one-dimensional graphic context for SI. This pattern may be a
conse-quence of the evolution of coreceptor usage mentioned or due to some uniform selective pressure. Rather, the patterns of positive selection are complex and tempo-above. The CD4⫹T cells are attacked by the NSI form
through subversion of the CCR5 chemokine signaling rally dynamic.
In addition to the varying selective and demographic pathway (Rowland-Joneset al.2001). However, CD8⫹
T-cell survival is not significantly reduced by the initial patterns observed within the SI and NSI portions of the haplotype trees, Table 5 indicates that positive selection HIV-1 infection, and CD8⫹T-cell production is initially
modestly increased (Rowland-Joneset al.2001). How- occurs on the branches that are transitional between the NSI and SI forms. The NSI/SI transitional branches ever, CD8⫹T-cell viability is affected by CXCR4-using
viruses (Blanco et al. 2001), and as the disease pro- have more than twice the rate of nonsynonymous substi-tutions as all other branches, even when the replace-gresses the absolute number of CD8⫹ T lymphocytes
is decreased in peripheral blood and their turnover rate ment mutations responsible for the NSI/SI transition are excluded. This result is even more biologically sig-is increased (Herbeinet al.1998).Herbeinet al.(1998)
report results that indicate that the increased cell death nificant when the overall positive selection (Table 1) is taken into account; that is, the intensity of positive of CD8⫹ T cells in HIV-infected subjects is mediated
by the HIV envelope protein through the CXCR4 che- selection in the NSI to SI transition significantly exceeds that of the background positive selection and not just mokine receptor. All these results suggest that SI strains
interact more with CD8⫹ T cells than do NSI strains, neutrality. Hence, the transition from the NSI to the SI phenotype (or its reverse in a few instances) is associated which is compatible with our observation in the logit
analysis that the CD8⫹T-cell counts are predictive of with strong positive selection on other amino acid sites, a result consistent with previous studies that indicate the selective and demographic attributes of SI but not
of NSI. that although the switch from NSI to SI can be
accom-plished by a single amino acid substitution (Dittmar
Expression of the activation marker CD38 has also
phenotype: analysis by single amino-acid substitution. J. Virol.
elsewhere also influence the SI phenotype (
Seillier-66:6777–6780.
Moiseiwitsch et al. 1994). Our results indicate that Dittmar, M. T., A. McKnight, G. Simmons, P. R. Clapham, R. A.
Weisset al., 1997 HIV-1 tropism and co-receptor use. Nature
once the SI-defining mutations occur, intense positive
385:495–496.
selection is induced on other amino acid sites, resulting
Endo, T., K. Ikeo andT. Gojobori, 1996 Large-scale search for
in a burst of evolutionary change. genes on which positive selection may operate. Mol. Biol. Evol. 13:685–690.
Overall, our results show that the V3 region is indeed
Fienberg, S. E., 1977 The Analysis of Cross-Classified Categorical Data.
subject to selection, but this selection cannot be
mean-The MIT Press, Cambridge, MA.
ingfully summarized in a marginal fashion or with re- Fu, Y. X., andW. H. Li, 1993 Statistical tests of neutrality of
muta-tions. Genetics133:693–709.
spect to a single variable, such as disease progression
Ganeshan, S., R. E. Dickover, B. T. M. Korber, Y. J. Brysonand
or CD4 counts. Given our results, studies could observe
S. M. Wolinsky, 1997 Human immunodeficiency virus type 1
very diverse patterns of V3 region evolution depending genetic evolution in children with different rates of development
of disease. J. Virol.71:663–677.
on whether they looked only at rapid or nonprogressors,
Goudsmit, J., 1997 Viral Sex: The Nature of AIDS. Oxford University
whether they examined only subjects with NSI forms or
Press, New York.
subjects with SI forms, and whether they examined the Herbein, G., U. Mahlknecht, F. Batliwalla, P. Gregersen, T.
Pappaset al., 1998 Apoptosis of CD8⫹T cells is mediated by
disease early after seroconversion or only much later.
macrophages through interaction of HIV gp120 with chemokine
Selection on the V3 region is intense, but highly context
receptor CXCR4. Nature395:189–194.
dependent. An understanding of this context depen- Hettmansperger, T. P., 1984 Statistical Inference Based on Ranks.
John Wiley & Sons, New York.
dency can yield greater insight into the evolutionary
Horikoshi, H., M. Kinomoto, F. Sasao, T. Mukai, R. B. Luftiget biology of this region of the HIV-1 genome. al., 2001 Differential susceptibility of resting CD4(⫹) T
lympho-cytes to a T-tropic and a macrophage (M)-tropic human immuno-We thank two anonymous reviewers for their excellent suggestions
deficiency virus type 1 is associated with their surface expression that have strengthened this article. This work was supported by the
of CD38 molecules. Virus Res.73:1–16. National Institute on Drug Abuse grants DA 09973, 04334, and 09541
Kelly, J. K., 1994 An application of population genetic theory to and National Institutes of Health grant R01 GM60730.
synonymous gene sequence evolution in the human immunode-ficiency virus (HIV). Genet. Res.64:1–9.
Kestens, L., G. Vanham, C. Vereecken, M. Vandenbruaene, G. Vercauterenet al., 1994 Selective increase of activation
anti-LITERATURE CITED gens HLA-DR and CD38 on CD4⫹CD45RO⫹T lymphocytes during HIV-1 infection. Clin. Exp. Immunol.95:436–441.
Blanco, J. B., J. Barretina, C. Cabrera, A. GutierrezandB. Clo- Kimura, M., andT. Ohta, 1971 Protein polymorphism as a phase tet, 2001 CD4⫹and CD8⫹T cell death during human immu- of molecular evolution. Nature229:467–469.
nodeficiency virus infection in vitro. Virology285:356–365. Leigh Brown, A. J., andE. C. Holmes, 1994 Evolutionary biology
Bonhoeffer, S., andM. A. Nowak, 1994 Mutation and the evolution of human immunodeficiency virus. Annu. Rev. Ecol. Syst.25: of virulence. Proc. R. Soc. Lond. Ser. B258:133–140. 127–165.
Bonhoeffer, S., E. C. HolmesandM. A. Nowak, 1995 Causes of Liu, S. L., T. Schacker, L. Musey, D. Shriner, M. J. McElrathet al., HIV diversity. Nature376:125. 1997 Divergent patterns of progression to AIDS after infection
Briggs, D. R., D. L. Tuffle, J. W. SleasmanandM. M. Goodenow, from the same source: human immunodeficiency virus type 1 2000 Envelope V3 amino acid sequence predicts HIV-1 pheno- evolution and antiviral responses. J. Virol.71:4284–4295. type (co-receptor usage and tropism for macrophages). AIDS14: Markham, R. B., W. Wang, A. E. Weisstein, Z. Wang, A. Munozet
2937–2939. al., 1998 Patterns of HIV-1 evolution in individuals with
dif-Callaway, D. S., R. M. Ribeiro and M. A. Nowak, 1999 Virus fering rates of CD4 T cell decline. Proc. Natl. Acad. Sci. USA95: phenotype switching and disease progression in HIV-1 infection. 12568–12573.
Proc. R. Soc. Lond. Ser. B266:2523–2530. May, R. M., 1995 The co-evolutionary dynamics of viruses and their
Carrieri, M. P., M. A.Chesney, B.Spire, A.Loundou, A.Sobelet hosts, pp. 553–585 inMolecular Basis of Virus Evolution, edited by al., 2003 Failure to maintain adherence to HAART in a cohort F.Garcı´a-Arenal. Cambridge University Press, Cambridge, UK. of French HIV-positive injecting drug users. Int. J. Behav. Med. McDonald, J. H., andM. Kreitman, 1991 Adaptive protein
evolu-10:1–14. tion at theAdhlocus inDrosophila.Nature351:652–654.
Castelloe, J., andA. R. Templeton, 1994 Root probabilities for McDonald, R. A., D. L. Mayers, R. C.-Y. Chung, K. F. Wagner, S. intraspecific gene trees under neutral coalescent theory. Mol. Ratto-Kimet al., 1997 Evolution of human immunodeficiency Phylogenet. Evol.3:102–113. virus type 1envsequence variation in patients with diverse rates
Coffin, J. M., 1995 HIV population dynamics in vivo: implications of disease progression and T-cell function. J. Virol.71:1871–1879. for genetic variation, pathogenesis, and therapy. Science267: Nielsen, R., 2001 Statistical tests of selective neutrality in the age
483–489. of genomics. Heredity86:641–647.
Coffin, J. M., 1999 Molecular biology of HIV, pp. 3–40 inThe Evolu- Nowak, M. A., R. M. May, R. E. Phillips, S. Rowland-Jones, D. G.
tion of HIV, edited by K. A.Crandall. The Johns Hopkins Univer- Lallooet al., 1995 Antigenic oscillations and shifting immuno-sity Press, Baltimore. dominance in HIV-1 infections. Nature375:606–611.
Crandall, K. A., 1994 Intraspecific cladogram estimation: accuracy Page, R. D. M., andE. C. Holmes, 1998 Molecular Evolution: A
Phyloge-at higher levels of divergence. Syst. Biol.43:222–235. netic Approach. Blackwell Science, Oxford.
Crandall, K. A., andA. R. Templeton, 1996 Applications of intra- Palepu, A., M.Tyndall, B.Yip, M. V.O’Shaughnessy, R. S.Hogg
specific phylogenetics, pp. 81–99 inNew Uses for New Phylogenies, et al., 2003 Impaired virologic response to highly active antiret-edited by P.Harvey, A. J. L.Brown, J. M.Smithand S.Nee. roviral therapy associated with ongoing injection drug use. J. Oxford University Press, Oxford. Acquir. Immune Defic. Syndr.32:522–526.
Crandall, K. A., andA. R. Templeton, 1999 Statistical approaches Perelson, A. S., A. U. Neumann, M. Markowitz, J. M. Leonardand to detecting recombination, pp. 153–176 inThe Evolution of HIV, D. D. Ho, 1996 HIV-1 dynamics in vivo: virion clearance rate, edited by K. A.Crandall. The Johns Hopkins University Press, infected cell life-span, and viral generation time. Science271:
Baltimore. 1582–1586.
De Jong, J. J., A.Deronde, W.Keulen, M.Tersmetteand J.Goud- Rowland-Jones, S., S. PinheiroandR. Kaul, 2001 New insights
smit, 1992 Minimal requirements for the human-immunodefi- into host factors in HIV-1 pathogenesis. Cell104:473–476.
1995 Natural selection on thegag, pol, andenvgenes of human spots within the human lipoprotein lipase gene. Am. J. Hum. Genet.66:69–83.
immunodeficiency virus 1 (HIV-1). Mol. Biol. Evol.12:803–813.
van Rij, R. P., H. Blaak, J. A. Visser, M. Brouwer, R. Rientsmaet al.,
Seillier-Moiseiwitsch, F., B. H. Margolin and R. Swanstrom,
2000 Differential coreceptor expression allows for independent 1994 Genetic variability of the human immunodeficiency virus:
evolution of non-syncytium-inducing and syncytium-inducing statistical and biological issues. Annu. Rev. Genet.28:559–596.
HIV-1. J. Clin. Invest.106:1039–1052.
Shankarappa, R., P. Gupta, G. H. Learn, A. G. Rodrigo, J. C. R.
van Rij, R. P., M. Hazenberg, B. van Benthem, S. Otto, M. Prins Rinaldo et al., 1998 Evolution of human immunodeficiency
et al., 2003 Early viral load and CD4⫹T cell count, but not virus type 1 envelope sequences in infected individuals with
dif-percentage of CCR5⫹or CXCR4⫹CD4⫹T cells, are associated fering disease progression profiles. Virology241:251–259.
with R5-to-X4 HIV type 1 virus evolution. AIDS Res. Hum.
Retrovi-Shankarappa, R., J. B. Margolick, S. J. Gange, A. G. Rodrigo, D.
ruses19:389–398.
Upchurch et al., 1999 Consistent viral evolutionary changes
Wei, X. P., S. K. Ghosh, M. E. Taylor, V. A. Johnson, E. A. Emini
associated with the progression of human immunodeficiency
vi-et al., 1995 Viral dynamics in human-immunodeficiency-virus rus type 1 infection. J. Virol.73:10489–10502.
type-1 infection. Nature373:117–122.
Shiino, T., K. Kato, N. Kodaka, T. Miyakuni, Y. Takebeet al., 2000
Wolinsky, S. M., B. T. M. Korber, A. U. Neumann, M. Daniels, K. J.
A group of V3 sequences from human immunodeficiency virus
Kunstmanet al., 1996 Adaptive evolution of human immunode-type 1 subimmunode-type E non-syncytium-inducing, CCR5-using variants
ficiency virus-type 1 during the natural course of infection. Sci-are resistant to positive selection pressure. J. Virol.74:1069–1078.
ence272:537–542.
Templeton, A. R., 1987 Genetic systems and evolutionary rates, pp.
Wood, E., J. S. G.Montaner, B.Yip, M. W.Tyndall, M. T.Schechter
218–234 inRates of Evolution, edited by K. S. W.Campbelland
et al., 2003 Adherence and plasma HIV RNA responses to highly M. F.Day. Allen & Unwin, London.
active antiretroviral therapy among HIV-1 infected injection drug
Templeton, A. R., 1996 Contingency tests of neutrality using
intra-users. Can. Med. Assoc. J.169:656–661. interspecific gene trees: the rejection of neutrality for the
evolu-Xiao, H., C. Neuveut, H. L. Tiffany, M. Benkirane, E. A. Richet
tion of the mitochondrial cytochrome oxidase II gene in the al., 2000 Selective CXCR4 antagonism by Tat: implications for hominoid primates. Genetics144:1263–1270. in vivo expansion of coreceptor use by HIV-1. Proc. Natl. Acad.
Templeton, A. R., K. A. CrandallandC. F. Sing, 1992 A cladistic Sci. USA97:11466–11471.
analysis of phenotypic associations with haplotypes inferred from Yamaguchi, Y., andT. Gojobori, 1997 Evolutionary mechanisms restriction endonuclease mapping and DNA sequence data. III. and population dynamics of the third variable envelope region of Cladogram estimation. Genetics132:619–633. HIV within single hosts. Proc. Natl. Acad. Sci. USA94:1264–1269.
Templeton, A. R., A. G. Clark, K. M. Weiss, D. A. Nickerson, J.