DOI: 10.1534/genetics.106.064642
Controlling the False-Positive Rate in Multilocus Genome Scans
for Selection
Kevin R. Thornton
1and Jeffrey D. Jensen
Department of Molecular Biology and Genetics, Cornell University, Ithaca, New York 14853
Manuscript received August 9, 2006 Accepted for publication October 18, 2006
ABSTRACT
Rapid typing of genetic variation at many regions of the genome is an efficient way to survey variability in natural populations in an effort to identify segments of the genome that have experienced recent natural selection. Following such a genome scan, individual regions may be chosen for further sequencing and a more detailed analysis of patterns of variability, often to perform a parametric test for selection and to estimate the strength of a recent selective sweep. We show here that not accounting for the ascertainment of loci in such analyses leads to false inference of natural selection when the true model is selective neutrality, because the procedure of choosing unusual loci (in comparison to the rest of the genome-scan data) selects regions of the genome with genealogies similar to those expected under models of recent directional selection. We describe a simple and efficient correction for this ascertainment bias, which restores the false-positive rate to near-nominal levels. For the parameters considered here, we find that obtaining a test with the expected distribution ofP-values depends on accurately accounting both for ascertainment of regions and for demography. Finally, we use simulations to explore the utility of relying on outlier loci to detect recent selective sweeps. We find that measures of diversity and of population differentiation are more effective than summaries of the site-frequency spectrum and that sequencing larger regions (2.5 kbp) in genome-scan studies leads to more power to detect recent selective sweeps.
A
major goal of population genetics is to use patterns of variability in a natural population to identify regions of the genome where allele frequencies have been recently affected by the action of natural selection. Historically, studies of naturally occurring molecular variation were conducted at single loci, and uncertain-ties about the demographic history of natural popula-tions frequently complicated inferences about selection. Current empirical work focuses on using either multi-locus data sets (e.g., Glinka et al. 2003; Tenaillon et al.2004; Haddrillet al.2005b; Omettoet al.2005; Williamsonet al.2005; Wrightet al.2005) or whole-genome polymorphism data (e.g., Carlsonet al.2005; Nielsen et al.2005; Kelleyet al.2006) to discern the locus-specific effects of selection from the genome-wide effects of nonequilibrium demographic history. In gen-eral, this approach has been dubbed a ‘‘genome scan’’ for selection.Where whole-genome variation data are unavailable, investigators will sample levels of variability from mul-tiple regions of the genome using markers that are both relatively rapid and relatively inexpensive to type, such as microsatellites (e.g., Harret al.2002; Kaueret al. 2003; Bauer-DuMont and Aquadro 2005), or short fragments of nucleotide sequence to identify
single-nucleotide polymorphisms (SNPs) (e.g., Glinka et al. 2003; Tenaillonet al.2004; Omettoet al.2005; Wright et al.2005). From such studies, a subset of these regions may then be selected for additional sequencing, and the parameters of a model of recent positive, directional selection acting on new mutations will be estimated from the data. How such regions are chosen for additional sequencing varies from study to study, but most strate-gies include a comparison of individual loci to the empirical distribution of some feature of the data re-sulting from a genome scan. For example, genome-scan data consisting of short reads of DNA sequence may be summarized by the number of mutations in each frag-ment, with invariant fragments being used to identify regions for further sequencing (e.g., Glinkaet al.2003; Schlenke and Begun2004; Beisswangeret al.2006). Similarly, a region may be identified because variability and/or allele frequencies of microsatellite markers are extremely skewed in some regions of the genome rela-tive to the data set as a whole (e.g., Harr et al. 2002; Bauer-DuMontand Aquadro2005; Poolet al.2006). The rationale for the follow-up experiment is that the statistics used to identify outlier regions (e.g., Tajima 1989; Voightet al.2006) are not formal tests for selec-tion, as they do not specifically reject a neutral model in favor of a model including selection. Thus, empirical distributions from genome scans are often used as a way to quickly identify regions of the genome in which to estimate the strength and target of recent positive 1Corresponding author:Department of Ecology and Evolutionary
Biol-ogy, University of California, Irvine, CA 92697. E-mail: [email protected]
selection. Currently, such estimates are usually obtained using the approach of Kim and Stephan (2002) and related approaches (Kimand Nielsen2004).
The rationale for choosing such extreme loci for more detailed investigation is that models of selective sweeps (Maynard-Smithand Haigh1974) predict both strong reductions in diversity and skews in the site-frequency spectrum, at neutral sites linked to a recent sweep (Bravermanet al.1995; Kimand Stephan2002). How-ever, such a procedure gives rise to at least three con-cerns. First, when a genome-scan study surveys a large number of (approximately) independent regions of the genome, choosing the most extreme loci imposes a mul-tiple testing problem for subsequent analysis. Second, any empirical distribution has observations in the tails, regardless of the model that generated the data. Third, it is unclear in models of selective sweeps occurring in non-equilibrium populations the extent to which selected loci are expected to be enriched in the tails of an em-pirical distribution. A recent simulation study (Teshima et al.2006) suggests that the efficacy of this approach depends on which summary statistics are used to identify outliers, as well as on the details of the underlying dem-ographic model and the model of adaptation assumed (for example, complete sweepsvs.sweeps from standing variation).
In this article, we use simulations to investigate the effect that choosing outlier loci has on parametric in-ferences of selection, when the true model is one of neutral mutations in a bottlenecked population. We study a bottleneck model to explore the properties of genome scans using parameters that may be relevant for
Drosophila melanogasterand also because population bot-tlenecks severely confound the inference of selection (e.g., Jensenet al.2005). We apply what is currently the state-of-the art method for ‘‘subgenomic’’ scans (i.e., less than whole-genome SNP data)—the composite-likeli-hood method of Kim and Stephan (2002) and the goodness-of-fit (GOF) test of Jensenet al.(2005). The former method estimates both the strength and target of selection, assuming the demographic null model of a large, panmictic population, and gives a composite likelihood-ratio test (CLRT) comparing the selective sweep model to the standard neutral model. Jensenet al. (2005) proposed a GOF statistic intended to be applied to data sets that reject neutrality following the proce-dure of Kimand Stephan(2002). They showed that the GOF procedure substantially reduces the false-positive rate under nonequilibrium demographic models and also results in a test statistic with a uniform distribution of P-values when the true model is a single selective sweep occurring in a large, constant-size, panmictic pop-ulation (the model assumed by the CLRT). In Jensen et al.(2005), the calculation of the GOF test was applied to simulated data assuming that loci are random draws from a population model. In practice, however, both the method of Kimand Stephan(2002) and the GOF tests
are often applied to loci that are preselected by an in-vestigator because some feature of the region is an out-lier in a multilocus genome scan (e.g., Harret al.2002; Bauer-DuMontand Aquadro2005; Beisswangeret al. 2006; Poolet al.2006).
Here, we show that the CLRT and the GOF are very sensitive to choosing outlier loci from the tails of empirical distributions, leading to false inference of selection when the true model has no selection occur-ring (.50% of the time for the parameters investi-gated). We describe a correction procedure that both is efficient and restores the false-positive rate to near nominal levels. In addition, we use a novel simulation of selective sweeps to explore the efficiency of outlier detection at identifying selected loci in models of demography-plus-selection. We find that using levels of diversity, or of population differentiation, performs better than summaries of the site-frequency spectrum, as recently found by Teshimaet al.(2006). Additionally, we find that the size of the region surveyed in a genome scan (i.e., the length of each fragment sequenced) affects the efficiency of outlier detection, with a clear advantage to scanning longer fragments.
METHODS
Simulating genome-scan data:We simulated genome-scan data consisting of 100 independent loci, from a population that has undergone a recent, severe re-duction in population size. Our goal here is to mimic the experimental designs that have been applied to
D. melanogaster(e.g., Glinka et al.2003; Omettoet al. 2005; Beisswanger et al. 2006). Such genome scans consist of two phases. First, short fragments of DNA are sequenced at a large number of regions of the genome (Glinkaet al.2003; Omettoet al.2005). Second, if a fragment from the first step is identified as interesting, further sequencing will be performed in the region containing the fragment, and additional, linked frag-ments will be sequenced (e.g., Beisswangeret al.2006), and a parametric test of selection will be applied, such as that of Kimand Stephan(2002). To simulate this ex-perimental design, we simulate genealogies from 10.5-kb regions, according to the scheme shown in Figure 1. This scheme consists of five, 500-bp fragments evenly spaced over the 10.5 kb. The third, central, fragment represents the initial fragment surveyed in a genome-scan experiment. Should this fragment be chosen for further study, the simulated data from the four other linked fragments are added to the central fragment, and a parametric test of selection is performed. A ge-nome scan data set of 100 regions is thus generated by simulating 100 of the 10.5-kb regions shown in Figure 1, and we simulated 1000 such data sets (a total of 105 10.5-kb regions).
model in Figure 2. This model has five parameters: the population mutation rate (u ¼ 4N0m, whereN0 is the effective size of the ancestral population), the popula-tion recombinapopula-tion rate (r¼4N0r), the time at which the derived population recovered from the bottleneck (tr), the duration of the bottleneck (d), and the severity of the bottleneck (f, 0,f#1). In this study, we useu¼
0.01/site,r¼0.1/site,tr¼0.004,d¼0.015, andf¼0.03, as these bottleneck parameters are compatible with data from European samples ofD. melanogaster(Thornton and Andolfatto2006). To perform these simulations, a program was written using the coalescent simulation functions in libsequence (Thornton2003).
Modeling selective sweeps:We consider a contiguous fragment ofMnucleotides. A beneficial mutation has swept to fixation at positionX, 1#X#M. We consider a coalescent process for a Wright–Fisher model with intragenic recombination (Hudson1983) and measur-ing time,t, in units of 4Ngenerations (t ¼g=4N, where
g is the number of generations). In this model, the selective sweep ends (i.e., the beneficial mutation fixes in the population) at time t $ 0. We model the trajectory of the selected allele using the deterministic approximation given in Stephanet al.(1992), with the frequency of the beneficial allele at timetof the sweep given by
xðtÞ ¼ j
j1ð1jÞe2aðttLÞ; 0#t#tL; ð1Þ where a ¼2Nsand tL¼ ðlogj=aÞ, the length of the sweep in units of 4Ngenerations. Here, we usej¼1=2N. The simulation has two phases—a neutral phase and a selective phase (Bravermanet al.1995). The neutral phase is the standard coalescent model with recombi-nation (Hudson 1983). At time t in the past, the simulation enters the selective phase, which is modeled as a structured coalescent process (e.g., Kaplanet al. 1988; Bravermanet al.1995), and time is incremented in small units,dt, until the frequency of the beneficial allele first reaches x(t) , j, at which point the sim-ulation continues in a neutral phase until the most re-cent common ancestor of the sample is reached. Events at time t during the sweep occur with the following probabilities. First, there are the probabilities of co-alescence in the favored and unfavored classes,
l1ðtÞdt ¼
kBðkB1Þ
xðtÞ dt ð2Þ
l2ðtÞdt ¼
kbðkb1Þ
1xðtÞdt: ð3Þ
In the above, at time t during the sweep, there areB
lineages in the favored class andbin the unfavored. The probabilities of recombination within the same two classes are
l3ðtÞdt ¼xðtÞr X
B
i¼1
Li;favored
!
dt ð4Þ
l4ðtÞdt ¼ ð1xðtÞÞr
Xb
i¼1
Li;unfavored
!
dt; ð5Þ
wherer¼4Nr, the population recombination rate per site, andPji¼1Li;krefers to the total number of positions
at which recombination events may occur in the kth class. During the sweep, if theith chromosome in class
kbegins at positionIand ends at positionJ(1#I,M, 1,J#M, andI,J), thenLi,k¼max(X,J)min(X,I).
Finally, there are the probabilities of recombination from the favored class to the unfavored,
l5ðtÞdt ¼ ð1xðtÞÞr
XB
i¼1
Li;favored
!
dt; ð6Þ
Figure 1.—Simulation scheme for genome-scan data. A data set consists of five linked, 500-bp fragments, with 2 kb between fragments. The central fragment (solid box) repre-sents data obtained in a genome-scan study. The other four fragments (hatched boxes) represent the follow-up sequenc-ing that is done if the middle fragment is chosen for further investigation of variability in the region.
Figure2.—Bottleneck model in a derived population. The model considers a derived population that experiences a bot-tleneck upon splitting from an ancestral population. In this model, time is scaled in units of 4N0generations, whereN0
is the present size of the ancestral population. Moving back-ward in time, the derived population recovers from the bot-tleneck at time tr. The bottleneck reduced the population
size of the derived population from N0 tofN0 for duration d. At timetr1din the past, the two populations split from
a common ancestor of size (1 1f)N0. For recombining
and recombination from the unfavored to the favored,
l6ðtÞdt ¼xðtÞr X
b
i¼1
Li;unfavored
!
dt: ð7Þ
For example, in Equation 6, a chromosome from the favored class is selected, and the position of the re-combination event is chosen uniformly along the length of the chromosome. After the recombination event, the chromosome fragment thatdoes notcontain the selected site is placed in the unfavored class. (Recall that time is moving backward, and therefore the fragment not con-taining the selected site had its ancestor in the unfavored class.) A similar argument is made for Equation 7.
Our implementation of the selective phase applies the rejection algorithm of Bravermanet al.(1995) to choose among the various possible events. We tested the accuracy of our simulation in two ways, using code pro-vided by Yuseob Kim and described in Kimand Stephan (2002). First, for a given set of parameters, the distribu-tion of several summary statistics was compared between the two implementations of the sweep process, and results were in excellent agreement (data not shown). Second, the inference machinery described in Kimand Stephan(2002), which estimatesXandaon the basis of the spatial distribution of variability, was applied to the output of both programs. We checked that the distribu-tions ofX^ and ˆawere similar when obtained from the output of both simulations, as a check that the patterns of variability surrounding the selected site were simu-lated accurately in our code.
Sweeps in two-population models: We extended the above model of a selective sweep to a two-population model in which one population undergoes a stepwise bottleneck (Figure 2), and no migration occurs between populations. Sweeps in the bottlenecked population occur during the period whenNis reduced, constrained so that a selective sweep event does not cross a change in population size (tr,t,tr1dandtr,t1tL,tr1d). In this article, we do not consider the case of sweeps in the ancestral population.
We calculate the trajectory of the favored allele using
j¼1=2fN0anda¼2fN0sin Equation 1. This calculation results intL, the length of the sweep, being in units of 4fN0generations;i.e.,t ¼g=4fN0, wheregis the length of the sweep in generations. However, we measure time in the simulation in units of 4N0generations, and there-fore events during the selective phase occur on different timescales in the two populations, which is accounted for as described below.
During the selective phase of a two-population model, there are three demes that must be considered: the fa-vored class, the unfafa-vored class, and the population not undergoing a sweep. Events in the derived population occur according to Equations 2–7, withdt¼1=4fN0, and we simulate along the trajectory of the beneficial allele
from 11=2fN0#xðtÞ#1=2fN0. Events in the unswept deme occur with probabilities
l7ðtÞdt2¼kCðkC1Þdt2 ð8Þ
l8ðtÞdt2 ¼r
XC
i¼1
Li;unswept
!
dt2: ð9Þ
In the above, there areClineages in the population not experiencing a sweep, anddt2 ¼fdt ¼1=4N0, rep-resenting that scaled time moves f-fold slower in the larger, ancestral population. Note thatLi,unswept¼JI because the position of the selected site is not relevant for the population not undergoing the sweep (for the case of no migration between populations considered here). Ifjgenerations pass between events, the time in the simulation is incremented from t to t 1 jdt2, en-suring that the total time on the genealogy is in units of 4N0generations.
We simulated genealogies for an equilibrium, ances-tral population and for a derived population under demography-and-selection, as described in methods and Figure 2. For each population the sample size was
n¼24 chromosomes, using the model parameters de-scribed above. We chose selection parameters to max-imize the effect of a sweep on the genealogy. We simulated 10.5-kb regions, and X, the position of the selected site, was assigned uniformly from 1#X#10, 500 for each replicate. We considered two different sampling schemes, sampling either 500 bp in the center of the 10.5 kb or 2500 bp. The beneficial mutation fixed in the recent past at t ¼0.0041 or 0.015, and we ex-amined two strengths of selection—a¼2fN0s¼100 or
a¼1500. We assumeN0¼2.4 million (Thorntonand Andolfatto2006), and therefore our values ofa cor-respond tos73104and0.01, respectively. We are therefore studying the effect of a recent and relatively strong (2fN0s?1) sweep occurring at all loci in the history of the derived population.
From these simulations, we explore three summary statistics. First,RH ¼uˆp;der=uˆp;anc, where ˆupis Tajima’s
(1983) estimator ofuin the derived and ancestral pop-ulations, respectively. A natural-log transformation of these distributions would be analagous to the ln RH
statistic for microsatellite data (Kauer et al. 2002). Second, we explore the FST-statistic of Hudson et al. (1992). Finally, we study the distribution ofH ¼ˆupuˆh,
whereuh¼Pn 1
i¼1 iki=ðn1Þ, which is a sum over theki
occurrences of derived mutations at frequency i in a sample of sizen( J. Shapiroand C.-I Wu, personal com-munication; see also Thornton and Andolfatto 2006).
a null distribution, which is simulated under a neutral model for the former method and under a model of selection for the latter. For the CLRT, all null distributions consist of 104simulated samples, and for the GOF test, we used 103simulations to generate null distributions.
Following previous work, null distributions of the CLRTwere simulated using the observed ˆuW(Watterson 1975) as the mutation rate (Kim and Stephan 2002; Jensenet al.2005), and the null distributions for the GOF test were simulated using S, the observed number of mutations in the data ( Jensenet al.2005), as simulating with ˆuW does not result in a uniform distribution of
P-values when the true null model is a recent selective sweep ( J. Jensen, unpublished results).
RESULTS
The ‘‘goodness-of-fit’’ test applied to neutral ge-nome-scan data:We simulated 1000 100-locus genome-scan data sets that mimic the sample sizes and locus lengths of the largest studies to date inD. melanogaster
(Glinkaet al.2003; Omettoet al.2005; seemethods), using the model from Figure 2 (see methods for parameters).
We apply two methods to choose outlier loci for follow-up studies in the derived population. First, we choose a locus if the fragment surveyed is invariant in the derived population. Second, we choose a locus if the value of Tajima’s (1989) Dstatistic in the derived population is less than or equal to the value ofDat the lower 2.5th percentile of the empirical distribution (D#
D0.025). These two ascertainment schemes identify non-overlapping sets of loci for further analysis, as D is undefined for invariant regions.
From the 1000 100-locus, neutral data sets, we ob-tained 10,827 regions chosen on the basis of having no variation and 3300 on the basis ofD# D0.025. Note
thatDis a discrete statistic, and therefore the value ofD
may be identical at different percentiles of the empirical distribution, which is why we obtained more than the expected 2500 outliers.
We then applied the CLRT of Kim and Stephan (2002) and, for those loci rejecting neutrality at P ,
0.05, calculated P-values for the GOF method as pre-viously described ( Jensenet al.2005). For the GOF test, there is a range ofP-values (P#0.05–0.2) where it is unclear if selection can be distinguished from demog-raphy ( Jensenet al.2005). For our purposes, we apply a strict cutoff atP¼0.05, such thatP#0.05 implies that a recent selective sweep with the parameters estimated from the composite-likelihood method is not the best fit to the data. Likewise,P.0.05 implies that the rejection of neutrality by the CLRT is more likely due to a sweep than due to demography alone.
When regions were chosen because the scanned fragment was invariant, 7048 (65%) of the simulated data sets rejected neutrality according to the CLRT, and 6822 (96.7%) of those had GOF P-values .0.05, in-dicating that the selection model fit the data better than a demographic scenario (despite the data being simu-lated under a strictly neutral model). If outliers are chosen on the basis of D# D0.025, 2931 (88.8%) reject neutrality using the CLRT, and 2614 (89.1%) of those had GOFP-values.0.05. If the false-positive rate were properly controlled, the empirical cumulative density function (ECDF) of P-values for the GOF test would have a cumulative density of 0.95 at P ¼ 0.05 when applied to neutral data. This is not the case when regions are ascertained from a genome scan—very little of the cumulative density is ,0.05, indicating false acceptance of the selection model for the majority of data sets (Figure 3). This leads to total type I errors of 63 and 79.2% when choosing regions because they are invariant or have an unusual Tajima’sD, respectively. We Figure3.—Empirical cumulative density func-tions of GOFP-values when applied to outliers in genome scans. One thousand 100-locus data sets were simulated under a bottleneck model with no selection (Figure 2, see methods for parame-ters), using the sampling scheme from Figure 1, and outlier loci were chosen for follow-up se-quencing and application of the CLRT (Kim and Stephan 2002) and GOF (Jensen et al. 2005) methods (seemethods). The vertical line atP¼0.05 is the significance threshold for the GOF test. P# 0.05 leads to the inference that the selection model is rejected in favor of a demo-graphic explanation, whileP.0.05 is taken to mean that selection is inferred to be a better ex-planation than demography. In this case, any
P.0.05 is therefore a false positive. If the false-positive rate were nominal (i.e., 5%), then the cu-mulative density ofP-values should reach 0.95 by
should note, however, that this is a substantial improve-ment over relying solely on the tails of the empirical distribution. If we had simply assumed that our outliers were subject to selection, our type I error would have been 100%, but applying the GOF method reduces the error rate by 20–40%.
Controlling the false-positive rate:In this section, we explore controlling the false-positive rate when loci are not randomly sampled from the genome. In practice, follow-ups to genome-scan experiments have to deal with the issue of nonequilibrium demography and of how loci are selected for further analysis, and it is not clear which issue has a greater impact on downstream analysis. For example, is it necessary to correct for both demography and ascertainment, or is it sufficient to correct for either demography or ascertainment? From a statistical point of view, the appropriate quantity to keep track of is the distribution ofP-values for each of these procedures and then to choose the procedure that results in a uniform distribution ofP-values when the null model is correct. Although we discuss the problem in terms of genome scans that survey single-nucleotide polymorphisms and follow up with the CLRT/GOF tests, the statistical issues addressed here are quite gen-eral. All statistical tests of neutrality that we are aware of assume a null distribution where loci are random draws from the model, but the ascertainment of a region and its use in a subsequent hypothesis test samples from a different null distribution. The general issue here is how to sample from the correct null distribution, illustrated with specific examples using the Kim and Stephan (2002) framework. Further, as the GOF test is applied only to regions that reject the null model with the CLRT, it is sufficient to control the false-positive rate of the CLRT. In other words, if a null distribution for the CLRT gives a 5% false-positive rate, then the total false-positive rate of the entire procedure (the CLRT1GOF tests) is necessarily #5%, and therefore we can identify the maximum false-positive rate.
For the results described above, there are two factors that contribute to a high false-positive rate. First, in practice, one obtainsP-values for the CLRT by simulat-ing a null distribution under the standard neutral model (Harr et al. 2002; Kim and Stephan 2002; Bauer-DuMont and Aquadro 2005; Beisswanger et al.2006; Poolet al.2006), which is problematic when the demographic assumptions of that model are vio-lated ( Jensenet al.2005). Second, the CLRT (and the subsequent GOF) are not applied to randomly chosen loci in practice, but to outlier loci identified by a ge-nome scan (e.g., Harret al.2002; Bauer-DuMontand Aquadro 2005; Beisswanger et al. 2006; Pool et al. 2006). Such ascertainment procedures choose loci with very unusual underlying genealogies, resulting in a pattern of spatial variability that may mimic that of a recent selective sweep, such as an excess of high-frequency, derived mutations surrounding a region of
reduced diversity (Figure 4). This pattern is observed because lineages in the invariant region reach common ancestors in the relatively recent past during the bottleneck, whereas lineages in the flanking regions have different genealogies due to recombination and reach common ancestors further back in the past (either later during the bottleneck or they coalesce at a time more ancient than the bottleneck). This effect is also predicted by Barton (1998), who showed that many of the properties of genealogies are very similar between bottlenecks and selective sweeps. In this section, we show that the false-positive rate of genome scans can be controlled if the demographic model is known and the ascertainment procedure accounted for when simulating the null distribution. We explore the case of ascertaining a region of the genome on the basis of the original scanned fragment having no variation, but the principles apply to any ascertainment scheme.
The statistic of interest isl, the composite likelihood-ratio statistic from the CLRT of Kim and Stephan (2002). We wish to obtain a null distribution oflthat is both generated from the correct demographic model and conditional on the ascertainment scheme (asc). In other words, for a specified demographic model, we wish to sample l from the conditional distribution Pr(ljasc)¼Pr(l\asc)/Pr(asc). An estimate of Pr(asc) is used as a weight on the observed statistic lobs, and
P-values are estimated using n draws from the condi-tional null distribution as
Figure4.—The expected spatial pattern of variability for a 10.5-kb region is plotted, given that the region has been ascer-tained because it contains a small invariant fragment. Esti-mates of the expectation of three estimators of u ¼ 4Nem
are plotted for nonoverlapping 500-bp windows—ˆup (solid
line, Tajima 1983), ˆu
W (dashed line, Watterson 1975),
and ˆuh(dotted/dashed line, Equation 1 of Thorntonand Andolfatto 2006). These data were simulated under the bottleneck model in Figure 2 with parametersu¼0.01/site,
r¼0.1/site,tr¼0.004,d¼0.015, andf¼0.03. The
Pn
i¼1Iðli$PrbðascÞlobsÞ
n ; ð10Þ
whereI(x)¼1 if the conditionxis true and 0 otherwise. These correctedP-values can be calculated using a rejec-tion algorithm (described below) and available software (e.g., Hudson2002). In practice, one can simply run a simulation until n replicates satisfying the ascertain-ment scheme are recorded, keeping track of thektrials required, allowing Pr(asc) to be estimated asn/k. The steps of this algorithm are detailed in theappendix.
To mimic the ascertainment scheme, we accept only simulation runs where the middle of the five fragments is invariant. In practice, the null distribution of the CLRT is obtained using ˆuW (Watterson1975) as the mutation rate in the simulations. This poses a practical problem when simulating under demographic models that reduce diversity—if fragments of a region are sam-pled, the probability that all fragments are invariant can be relatively high for small ˆuW. We therefore accept simulation runs only if the middle fragment is invariant and there is at least one segregating site in the data. Therefore, Pr(asc)¼Pr(middle region invariant\S.
0). Conditioning on the data set being variable is also appropriate as an investigator would not perform the CLRT on a region completely devoid of variation.
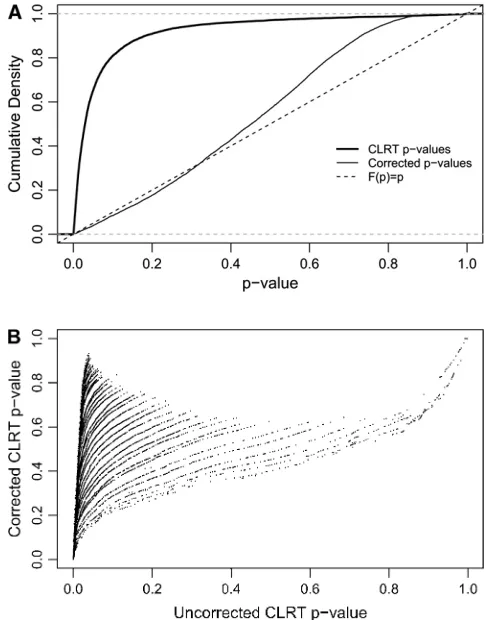
We applied this procedure to the 10,827 data sets that were ascertained from our simulated neutral data on the basis of having an invariant region in the scanned frag-ment. As described above, 65% of these data sets falsely reject the equilibrium neutral model in favor of selec-tion. When the correct demographic null model is used (a stepwise bottleneck withtr¼0.004,d¼0.015, andf¼ 0.03), and ascertainment is accounted for, 3.8% of loci reject neutrality, making the test slightly conservative. The ECDFs ofP-values for these two cases are shown in Figure 5A. If theP-values are truly drawn from the null distribution, then the cumulative density function (CDF) of P-values should be a linear function F(P)¼ P. When ascertainment and demography are not ac-counted for, 65% of P-values are ,0.05 (thick solid line in Figure 5A). Accounting for demography and as-certainment leads to an ECDF that grows approximately as expected (thin line in Figure 5A). Further, account-ing for ascertainment and demography affects the rank order ofP-values (Figure 5B). The change in rank order shows that the standard CLRT P-values are not an appropriate metric to compare the evidence in favor of selection at different loci, when loci are ascertained from a genome-scan experiment. For each value of ˆuW, the null distribution consisted of 50,000 replicates matching the ascertainment criteria under the bottle-neck model. Results were nearly identical using only 1000 replicates (data not shown). The acceptance rates in the simulations [i.e., PrbðascÞ] ranged from 0.12 to 0.52, depending on the value of ˆuW. This procedure is therefore efficient enough to be performed using
available software to simulate from the neutral coales-cent (e.g., Hudson2002).
discovered in Glinka et al.(2003). In this section, we explore the effects that ascertainment and demography have on theP-value of the CLRT applied to the Nether-lands data from this region. Specifically, we estimate the CLRTP-value under four scenarios:
1. Using the standard neutral model as the null model and not accounting for ascertainment: This is the standard application of the CLRT.
2. Using the standard neutral model as the null, but accounting for ascertainment.
3. Using the point estimates for a bottleneck model for the Netherlands population (Thornton and Andolfatto2006) as the demographic null model and not accounting for ascertainment. We use point estimates here, rather than simulate from the full posterior distribution on the parameter space, to keep the procedure as practical as possible using available tools, such as ms (Hudson2002).
4. Using the point estimates for a bottleneck model for the Netherlands population (Thornton and Andolfatto2006) as the demographic null model and accounting for ascertainment.
To improve simulation efficiency when generating a null distribution for an ascertained region under the standard neutral model, we applied a slightly different scheme from that described in the previous section. For each simulated replicate, we calculated T, the total length of the genealogy in the ascertained fragment (the invariant fragment identified in Glinkaet al.2003), and placed no mutations on that fragment. For the
ith replicate, PrðasciÞ ¼Prðascertained region invariantj
uLTiÞ ¼ ððuLTiÞk=k!ÞeuLTi, whereuis the mutation rate
per site,Lis the length of the fragment, andk¼0. The
P-values are then estimated as
Pn
i¼1Iðli$PrbðasciÞlobsÞ
n : ð11Þ
This approach is appropriate for sparsely sampled frag-ments (Figure 1) and has the advantage that all sim-ulation replicates can be used, rather than relying on rejection sampling, which would be inefficient as the probability of an invariant fragment is low under the standard neutral model.
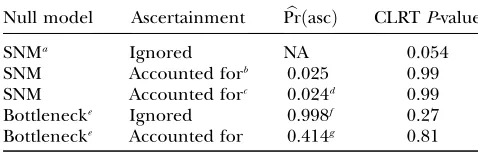
The CLRT P-values estimated under these four schemes are shown in Table 1. In all calculations, we used estimates of u and r from Beisswanger et al. (2006) and an input file for the CLRT kindly provided by Steffen Beisswanger. When the standard CLRT is applied to the data, the P-value is nearly significant (0.054). When either ascertainment or demography is accounted for individually, the P-value is much larger (0.99 in both cases). Finally, when both demography and ascertainment are accounted for in the null distribution, P ¼ 0.81. Clearly, the impacts both of demography and of how regions are selected for analysis may have a large influence on the strength of evidence
in favor of selection. Although correcting either for ascertainment alone or for demography resulted in a nonsignificant CLRT for this example, it is not guaran-teed that either procedure adequately controls the false-positive rate. We explore these issues below.
Correcting for ascertainment under the standard neutral model: The results in Table 1 suggest that ac-counting for ascertainment of regions alone, and as-suming the standard neutral model, may have a strong effect on CLRT P-values. Given that there is consider-able uncertainty concerning the appropriate demogra-phic model to use for the null distribution, we explore here the effect of accounting for ascertainment, but as-suming the standard neutral model as the demographic null model.
We generated null distributions for the CLRT for 10,827 data sets ascertained from our genome-scan simulations based on having an invariant region. The simulation scheme is as described above for the Beisswanger et al. (2006) data, calculating P-values according to Equation 11 from 1000 simulated data sets. Accounting for ascertainment alone resulted in an overly conservative distribution ofP-values (100% of the data sets had P $ 0.422). The reason that this procedure is so conservative is due to the demographic assumptions. In an equilibrium population, the proba-bility of ascertaining an invariant, 500-bp region is high for small ˆuW, in which case there is little information in the data and therefore little power to reject the null model. At the other extreme, it is very unlikely to ascertain a 500-bp invariant region for high ˆuW, and therefore the weight placed on the observed l is very
TABLE 1
The effect of different null distributions on CLRTP-values, applied to the Netherlands data in BEISSWANGERet al.(2006)
Null model Ascertainment PrbðascÞ CLRTP-value
SNMa Ignored NA 0.054
SNM Accounted forb 0.025 0.99
SNM Accounted forc 0.024d 0.99
Bottlenecke Ignored 0.998f 0.27
Bottlenecke Accounted for 0.414g 0.81
aSNM, standard neutral model. When ascertainment of
re-gions is ignored, this is the standard CLRT (Kimand Stephan 2002), andPrbðascÞis not relevant.
bCalculated using rejection sampling and Equation 10. cCalculated using Equation 11, see text for details. dCalculated as the mean ofððuLT
iÞ k
=k!ÞeuLTi, from 105 sim-ulated replicates.
e
Using the parameters from Thorntonand Andolfatto (2006), tr ¼ 0.004,d¼ 0.015, f¼ 0.03 (see Figure 2), and
the mutation and recombination rates used in Beisswanger et al.(2006).
f
Calculated using Equation 10, withPrbðascÞ ¼PrbðS.0Þ.
g
small, such that Prðl $PrbðascÞlobsÞ is high when esti-mated using the standard neutral model as the null.
Correcting only for demographic effects: In the analysis of the Beisswangeret al.(2006) data, correct-ing for demographic effects alone resulted in a non-significant CLRT. We explore here whether or not correcting for demography, while ignoring ascertain-ment of regions, is sufficient to control the false-positive rate. To do this, we generated a null distribution for the same 10,827 data sets under the correct demographic model, but ignoring ascertainment. Because there is a nonzero probability that all five segments will be in-variant for smallufor this model, we condition on the regions being variable and estimate Pr(asc)¼Pr(S.0) by rejection sampling as described above. The distribu-tion of P-values for the CLRT in this case had a substantial excess of smallP-values, with 49.8% of data sets having P # 0.05. In other words, correcting for demography, but ignoring how loci are selected for testing, improves the false-positive rate by23% (from 65% for the standard CLRT to 49.8%) when the CLRT is applied to regions ascertained from a bottlenecked population due to the observation of an invariant fragment. In other words, for the demographic model considered here, correcting for demographic effects alone results in an overly liberal test, whereas account-ing for ascertainment, but not for demography, results in an overly conservative test. The intuitive explanation for this is that the procedure of identifying regions on the basis of small, invariant fragments specifically scans for regions with spatial patterns of variability that look like a recent sweep (i.e., qualitatively similar to Figure 4). While such spatial patterns are quite rare under the standard neutral model (i.e., there is a low probability of discovering such regions), they are enriched for under diversity-reducing neutral models compared to the standard neutral model. Thus while correcting for demography alone may result in a nonsignificant CLRT for individual examples (Table 1), this is not true in general (and holds only50% of the time for the model studied here).
Figure6.—Reduction in diversity in nonequilibrium pop-ulations. The distribution of diversity (ˆup) in the derived
pop-ulation, relative to ˆup in the ancestral population is plotted
for models of a bottleneck, as well as those of a bottleneck-plus-selection. For the cases including selection, a 10.5-kb re-gion was simulated, and the position of the selected site was randomly placed (from a uniform distribution) in the region. The bottleneck parameters are given in methods. In each plot, the case of no selection is plotted as a reference and compared to two selection coefficients, a ¼ 2fN0s ¼ 100
and 1500. In addition, a vertical line is placed at the 5th per-centile of the empirical distribution without selection. In A– D, different values oft, the time of fixation of the beneficial allele, as well as different lengths of regions (500 or 2500 bp sampled from the middle of the 10.5 kb), are considered: (A)
t¼0.0041, 500-bp region; (B)t¼0.0041, 2500-bp region; (C)
The utility of empirical distributions:In the previous sections, we demonstrated that choosing loci from the tails of the empirical distribution of a summary statistic imposes an ascertainment bias that must be accounted for in subsequent analyses (e.g., Figures 3 and 5A). Of particular importance is how such loci are chosen from the tails in the first place. In practice, the choice is not made using the results of the CLRT/GOF (due to computational impracticability), but rather on the basis of a summary of the data (e.g., Harret al. 2002; Glinkaet al.2003; Bauer-DuMontand Aquadro 2005; Beisswangeret al.2006; Poolet al.2006).
Teshima et al. (2006) have recently found that choosing outlier loci on the basis of low levels of diver-sity is more powerful than choosing on the basis of summaries of the site-frequency spectrum. They sim-ulated genome-scan experiments consisting of 10-kb regions, with mutation rates appropriate for humans or maize. Diversity levels in maize are similar to those inD. melanogasterand are10 times lower in humans. Thus, the economic efficiency of genome scans, in terms of SNPs discovered per dollar, depends on the organism. Further, the largest genome scans in flies have relied on500-bp fragments (Glinkaet al.2003; Orengoand Aguade 2004; Ometto et al. 2005). Here, we explore the effect of region length on the power of genome scans, finding that longer regions have considerably more power. We have developed a novel simulation program that allows us to simulate a sweep in a derived, bottlenecked population in addition to the genealogy of the ancestral population. Our simulation allows us to explore the effect of sweeps on population differentia-tion, which was not considered in Teshimaet al.(2006), but has been considered as a statistic in genome scans (e.g., Akeyet al.2004; Storzet al.2004) because selec-tive sweeps in structured populations are expected to increase population differentiation (Santiago and Caballero2005).
From our simulations, we estimated the distributions of three summary statistics—RH, FST, and H (Figures 6–8; seemethodsfor descriptions of the statistics). In Figures 6–8, a vertical line is placed at the 5th quantile (95th forFST) of the distribution of the statistic under the bottleneck. Therefore, the density to the left (right for FST) of this line represents the amount by which
Figure7.—Differentiation between ancestral and derived populations in models of selection-and-demography. The same data analyzed in Figure 6 are analyzed here, calculating the distributions ofFST(Hudsonet al.1992) between the an-cestral and the derived population. As the position of the se-lected site is random a fixed difference between populations was added to the data at the position of the beneficial muta-tion before calculatingFST. A vertical line is placed at the 95th
percentile of the distribution without selection. (A) t ¼
0.0041, 500-bp region; (B)t¼ 0.0041, 2500-bp region; (C)
selection in a bottlenecked population enriches the tail of an empirical distribution for selected loci.
In general, when selection is both recent (t¼0.0041) and strong (a¼1500), the tails of empirical distribu-tions will be enriched for selected loci. However, the power to detect this pattern depends both on the sta-tistic used and on the design of the genome-scan ex-periment. If one looks atRH, the reduction in diversity in the derived population, strong recent selection can-not be identified in the tails of a genome-scan experi-ment when 500-bp regions are surveyed, for the mutation and recombination rates considered here (Figure 6A). The reason for this is that, under this bottleneck model, a 500-bp region has an10% chance of being invariant, and a selective sweep obviously cannot reduce diversity any further. However, if 2500-bp regions are surveyed in the genome scan, values ofRH¼0 are unlikely under the demographic model, and strong selection can be detected, even relatively far back into the past (Figure 6, B and D). Interestingly, there is no apparent effect of sequence length onFST(Figure 7). There is a dramatic improvement in the efficiency ofHto detect selection if longer regions are surveyed (compare Figure 8A to 8B), but the power vanishes rapidly with increasingt(Figure 8, C and D).
DISCUSSION
We have studied the effect that the ascertainment of regions from genome-scan studies has on inferences of selection in subsequent analysis. When the true model is a nonequilibrium, neutral model, ascertainment of ‘‘unusual’’ regions for further analysis can lead to the false inference of selection (Figure 3) because the as-certainment procedure itself identifies regions with spa-tial patterns of variability mimicking what is expected from a selective sweep (Figure 4). For the parametric tests of selection considered here (Kim and Stephan 2002; Jensenet al.2005), the false-positive rate can be controlled if both ascertainment and demography are accounted for when generating the null distribution for the tests (Figure 5A).
Uncertainty about demographic model: While ascer-tainment is easily accounted for, the true demographic model for most populations of interest is unknown. In our analysis of the Beisswangeret al.(2006) data, we used bottleneck parameters inferred from the genome
scan that identified thewaplregion (Glinkaet al.2003; Thornton and Andolfatto 2006) and used those parameters as the demographic null model to analyze the new data. Although these parameter estimates are based on the simplifying assumptions thatr/u is con-stant across loci on theD. melanogasterX and that the African population is at demographic equilibrium (dis-cussed in Thorntonand Andolfatto2006), our ana-lysis suggests that correcting for the ascertainment of thewaplregion in The Netherlands, and not attempting to account for demography, greatly weakens the evi-dence for a recent selective sweep (Table 1).
When correcting for demographic effects, our ap-proach made use only of point estimates of demographic parameters and failed to account for uncertainty in the estimates. However, Equations 10 and 11 are easily extended to simulating from the full, joint poste-rior distribution of parameters. Further, the approach can be extended to multiple demographic models. For example, Pritchard et al. (1999) implemented a summary-statistic Bayesian method with equal prior weight on different demographic scenarios, and the acceptance rate from each model was proportional to the posterior probability that the data were drawn from that model. In principle, a similar approach could be used to generate null distributions for the CLRT that take into account uncertainty about demography. The power of any of these approaches, and their computa-tional feasibility, however, remains an open question.
Empirical distributions: Although we have shown how ascertainment from the tails of empirical distribu-tions can be accounted for, power of the outlier de-tection approach to identify selected loci depends on the design of the genome-scan experiment. In the simulations we conducted, we find that summaries of diversity (Figure 6) or population differentiation (Fig-ure 7) are likely to be of more use in reliably identifying outlier loci that are under selection than summaries of the site-frequency spectrum (Figure 8). Teshimaet al. (2006) have recently reached similar conclusions in a simulation study focusing on demographic models believed to be plausible for humans and maize.
Of particular interest is the effect that the size of the regions surveyed has in a genome scan. For the models explored here, we find that there is a substantial prac-tical benefit to surveying longer regions (Figures 6–8). To date, the largest genome-scan data sets in D. mela-nogaster have consisted of fragments that are short enough to sequence across in a single pass (Glinka et al.2003; Omettoet al.2005). However, such regions may be too short, such that selected loci are not more extreme than neutral loci, as measured by levels of diver-sity (Figure 6), although such an effect is not observed when looking at FST (Figure 7). The advantage of sequencing larger fragments is also important in post-genome-scan analyses, since sequencing small, dis-persed fragments leads to poor estimates of selection
parameters ( J. D. Jensen, K. R. Thorntonand C. F. Aquadro, unpublished results).
Important caveats:In our simulations of selection, we have assumed a specific model where adaptation occurs from new mutations sweeping to fixation (Maynard -Smithand Haigh1974). Przeworskiet al.(2005) have recently used simulations to show that selection on standing variation (i.e., a previously neutral mutation that becomes beneficial) results in selective sweeps with less pronounced effects on variability at linked, neutral sites. Further, selection on standing variability does not enrich the tails of empirical distributions to the same extent as positive selection acting on new mutations (Teshimaet al. 2006). Thus, while genome scans will identify interesting candidate loci, the false-positive and false-negative rates depend on details both of the demographic history of the populations in question and of the nature of beneficial mutations (Teshimaet al. 2006).
In this study, we have considered only the case of ascertainment bias imposed by studying a region be-cause of prior knowledge of levels of polymorphism. Our simulations assumed that the polymorphic markers themselves are randomly sampled from the population. While this is appropriate for the large SNP data sets that currently exist for Drosophila (Glinka et al. 2003; Ometto et al.2005), they do not mimic the sampling schemes that are currently being applied to the largest data sets for humans, where SNPs are first identified in a small discovery panel and then later genotyped in larger samples (Hinds et al. 2005; International HapMap Consortium 2005). Ascertainment of markers is straightforward to account for in simple cases (Nielsen et al.2004), and accurate inferences of levels of diversity and population structure depend on applying such corrections (Clark et al. 2005). Attempts to identify recent directional selection in the human genome by outlier analysis therefore have two types of ascertain-ment to account for, that of markers and that of outlier regions (e.g., Carlsonet al.2005; Kelleyet al.2006).
diversity may be the most promising approach to identify selected loci, variation in mutation rates is a particular concern, as regions of low variability will contain both selected loci and loci with low mutation rates. In principle, examining statistics likeRHand ln
RH should control for variation in mutation rates (Schlotterer2002; Kaueret al.2003), but the issue of power remains.
The authors thank Peter Andolfatto, Celine Becquet, and members of the Clark lab for fruitful discussions and Steffen Beisswanger for sharing data. We are grateful to Andrew Clark, Chip Aquadro, and two anonymous reviewers for comments on the manuscript and to Molly Przeworski for sharing the Teshimaet al.(2006) manuscript ahead of publication. K.R.T. is supported by National Institutes of Health (NIH) grant GM065509 to A. G. Clark, and J.D.J. is supported by NIH grant GM36431 to C. F. Aquadro. and National Science Foundation grant DMS-0201037 to R. Durrett, C. F. Aquadro, and R. Nielsen.
LITERATURE CITED
Akashi, H., 1995 Inferring weak selection from patterns of polymor-phism and divergence at ‘‘silent’’ sites in Drosophila. Genetics
139:1067–1076.
Akey, J. M., M. A. Eberle, M. J. Rieder, C. S. Carlson, M. D. Shriver et al., 2004 Population history and natural selection shape patterns of genetic variation in 132 genes. PloS Biol. 2(10): 1591–1599.
Andolfatto, P., 2005 Adaptive evolution of non-coding DNA in Drosohila. Nature437:1149–1152.
Barton, N., 1998 The effect of hitch-hiking on neutral genealogies. Genet. Res.72:123–133.
Bauer-DuMont, V., and C. F. Aquadro, 2005 Multiple signatures of positive selection downstream ofNotchon the tip X chromosome inDrosophila melanogaster. Genetics171:639–653.
Beisswanger, S., W. Stephanand D. DeLorenzo, 2006 Evidence for a selective sweep in thewaplregion ofDrosophila melanogaster. Genetics172:265–274.
Braverman, J. M., R. R. Hudson, N. L. Kaplan, C. H. Langleyand W. Stephan, 1995 The hitchhiking effect on the site frequency-spectrum of DNA polymorphisms. Genetics140:783–796. Carlson, C. S., D. J. Thomans, M. A. Eberle, J. E. Swanson,
R. J. Livingstonet al., 2005 Genomic regions exhibiting posi-tive selection identified from dense genotype data. Genome Res.
15:1553–1565.
Clark, A. G., M. J. Hubisz, C. D. Bustamante, S. H. Williamsonand R. Nielsen, 2005 Ascertainment bias in studies of human genome-wide polymorphism. Genome Res.15:1496–1502. Excoffier, L., J. Novembreand S. Schneider, 2000 A general
coalescent program for the simulation of molecular data in inter-connected populations with arbitrary demography. J. Hered.91:
506–510.
Glinka, S., L. Ometto, S. Mousset, W. Stephanand D. DeLorenzo, 2003 Demography and natural selection have shaped genetic var-iation inDrosophila melanogaster: a multilocus approach. Genetics
165:1269–1278.
Haddrill, P., B. Charlesworth, D. Halliganand P. Andolfatto, 2005a Patterns of intron sequence evolution inDrosophilaare dependent upon length and GC content. Genome Biol.6:R67. Haddrill, P., K. Thornton, P. Andolfattoand B. Charlesworth, 2005b Multilocus patterns of nucleotide variability and the demographic and selection history of Drosophila melanogaster populations. Genome Res.15:790–799.
Halligan, D. L., A. Eyre-Walker, P. Andolfatto and P. D. Keightley, 2004 Patterns of evolutionary constraints in in-tronic and intergenic DNA ofDrosophila. Genome Res.14:273– 279.
Harr, B., M. Kauer and C. Schlotterer, 2002 Hitchhiking mapping: a population-based fine-mapping strategy for adaptive mutations inDrosophila melanogaster. Proc. Natl. Acad. Sci. USA
99(20): 12949–12954.
Hinds, D. A., L. L. Stuve, G. B. Nilson, E. Halperin, E. Eskinet al., 2005 Whole-genome patterns of common DNA variation in three human populations. Science307:1072–1079.
Hudson, R. R., 1983 Properties of a neutral allele model with intra-genic recombination. Theor. Popul. Biol.23:183–201. Hudson, R. R., 2002 Generating samples under a Wright-Fisher
neutral model of genetic variation. Bioinformatics18:337–338. Hudson, R. R., M. Slatkinand W. P. Maddison, 1992 Estimation of levels of gene flow from DNA-sequence data. Genetics132:583–589. InternationalHapMapConsortium, 2005 A haplotype map of
the human genome. Nature437:1299–1320.
Jensen, J., Y. Kim, V. B. DuMont, C. Aquadroand C. Bustamante, 2005 Distinguishing between selective sweeps and demography using DNA polymorphism data. Genetics170:1401–1410. Kaplan, N. L., T. Dardenand R. R. Hudson, 1988 The coalescent
process in models with selection. Genetics120:819–829. Kauer, M. O., B. Zangerl, D. Dieringer and C. Schlotterer,
2002 Chromosomal patterns of microsatellite variability con-trast sharply in African and non-African populations ofDrosophila melanogaster. Genetics160:247–256.
Kauer, M. O., D. Dieringerand C. Schlotterer, 2003 A micro-satellite variability screen for positive selection associated with the ‘‘Out of Africa’’ habitat expansion ofDrosophila melanogaster. Genetics165:1137–1148.
Kelley, J. L., J. Madeoy, J. C. Calhoun, W. Swansonand J. M. Akey, 2006 Genomic signatures of positive selection in humans and the limits of outlier approaches. Genome Res.16:980–989. Kim, Y., and R. Nielsen, 2004 Linkage disequilibrium as a signature
of selective sweeps. Genetics167:1513–1524.
Kim, Y., and W. Stephan, 2002 Detecting a local signature of genetic hitchhiking along a recombining chromosome. Genetics 160:
765–777.
Laval, G., and L. Excoffier, 2004 SIMCOAL 2.0: a program to sim-ulate genomic diversity over large recombining regions in a sub-divided population with a complex history. Bioinformatics20:
2485–2487.
Maynard-Smith, J., and J. Haigh, 1974 The hitch-hiking effect of a favorable gene. Genet. Res.23:23–35.
Nielsen, R., M. J. Hubiszand A. G. Clark, 2004 Reconstituting the frequency spectrum of ascertained single-nucleotide polymor-phism data. Genetics168:2373–2382.
Nielsen, R., S. Williamson, Y. Kim, M. J. Hubisz, A. G. Clark et al., 2005 Genomic scans for selective sweeps using SNP data. Genome Res.15:1566–1575.
Ometto, L., S. Glinka, D. DeLorenzo and W. Stephan, 2005 Inferring the effects of demography and selection on Drosophila melanogaster populations from a chromosome-wide scan of DNA variation. Mol. Biol. Evol.22:2119–2130. Orengo, D., and M. Aguade, 2004 Detecting the footprint of
pos-itive selection in a European population ofDrosophila melanogaster: multilocus pattern of variation and distance to coding regions. Genetics167:1759–1766.
Pool, J. E., V. Bauer-DuMont, J. L. Muellerand C. F. Aquadro, 2006 A scan of molecular variation leads to the narrow localiza-tion of a selective sweep affecting both Afrotropical and cosmo-politan populations of Drosophila melanogaster. Genetics 172:
1093–1105.
Pritchard, J. K., M. T. Seielstad, A. Perez-Lezaun and M. W. Feldman, 1999 Population growth of human Y chromosomes: a study of Y chromosome microsatellites. Mol. Biol. Evol. 16:
1791–1798.
Przeworski, M., G. Coopand J. D. Wall, 2005 Signature of positive selection on standing variation. Evolution59:2312–2323. Santiago, E., and A. Caballero, 2005 Variation after a selective
sweep in a subdivided population. Genetics169:475–483. Schlenke, T., and D. J. Begun, 2004 Strong selective sweep
associ-ated with a transposon insertion inDrosophila simulans. Proc. Natl. Acad. Sci. USA101:1626–1631.
Schlotterer, C., 2002 A microsatellite-based multilocus screen for the identification of local selective sweeps. Genetics 160:
753–763.
Storz, J. F., B. A. Payseur and M. W. Nachman, 2004 Genome scans of DNA variability in humans reveal evidence for selective sweeps outside of Africa. Mol. Biol. Evol.21:1800–1811. Tajima, F., 1983 Evolutionary relationship of DNA sequences in
finite populations. Genetics105:437–460.
Tajima, F., 1989 Statistical-method for testing the neutral mutation hypothesis by DNA polymorphism. Genetics123:585–595. Tenaillon, M. I., J. U’Ren, O. Tenaillonand B. S. Gaut, 2004
Se-lection versus demography: a multilocus investigation of the domestication process in maize. Mol. Biol. Evol. 21(7): 1214– 1225.
Teshima, K. M., G. Coopand M. Przeworski, 2006 How reliable are empirical genome scans for selective sweeps? Genome Res.16:
702–712.
Thornton, K., 2003 libsequence: a C11class library for evolution-ary genetic analysis. Bioinformatics19:2325–2327.
Thornton, K., and P. Andolfatto, 2006 Approximate Bayesian inference reveals evidence for a recent, severe bottleneck in a Netherlands population of Drosophila melanogaster. Genetics
172:1607–1619.
Voight, B. F., S. Kudaravalli, X. Wenand J. K. Pritchard, 2006 A map of recent positive selection in the human genome. PloS Biol.
4:e72.
Watterson, G. A., 1975 On the number of segregating sites in genetic models without recombination. Theor. Popul. Biol. 7:
256–276.
Williamson, S. H., R. Hernandez, A. Fledel-Alon, L. Zhu, R. Nielsenet al., 2005 Simultaneous inference of selection and population growth from patterns of variation in the human genome. Proc. Natl. Acad. Sci. USA102:7882–7887.
Wright, S. I., I. V. Bi, S. G. Schroeder, M. Yamasaki, J. F. Doebley et al., 2005 The effects of artificial selection on the maize ge-nome. Science308:1310–1314.
Communicating editor: J. Wakeley
APPENDIX: SIMULATING THE NULL DISTRIBUTION UNDER ASCERTAINMENT
We describe here an algorithm to simulate a null dis-tribution of samples from a model where loci are not randomly sampled. The algorithm is general and re-quires the following ingredients:
1. The parameters of a demographic model: For exam-ple, one may use point estimates obtained from fitting a demographic model to the initial genome-scan data (e.g., Omettoet al.2005; Thorntonand Andolfatto2006).
2. A means of generating coalescent samples from the demographic model: If the initial genome scan was done by surveying single-nucleotide polymorphisms, a perl script to run ms (Hudson 2002) would be sufficient. In this article, we wrote the simulations directly, using libsequence (Thornton2003). If the genome scan were performed using microsatellites,
and unusual regions then followed up on by survey-ing SNPs (e.g., Bauer-DuMontand Aquadro2005; Poolet al.2006), a program like simcoal (Excoffier et al. 2000; Laval and Excoffier 2004) could be used, which is capable of simulating linked SNP and microsatellite data.
3. A function that checks if a simulated sample is compatible with the ascertainment criteria: We label this function ascertain(data) and assume it returns 1 (true) if the ascertainment criteria are met and 0 (false) otherwise. For example, the function may return 1 if the middle 500 bp of a region are invariant or if Tajima’s D , 1.5 (if the 5th quantile of the empirical distribution ofDin the genome scan were
1.5). If the empirical data are sampled sparsely over large regions (e.g., Beisswanger et al. 2006), then care must be taken to analyze only the portions of the simulated sample corresponding to the regions sampled in the data.
Given the above ingredients, the algorithm to gener-atensamples from the null distribution under ascertain-ment is:
setk¼0 setm¼0
whilem,ndo
setk¼k11
Generate a single coalescent sample, data, from the demographic model
if(ascertain(data)¼ ¼1)then
setm¼m11 save data to a file
end if
end while
returnPrbðascÞ ¼m=k.