ABSTRACT
HARRIS, MEREDITH LOUISE. Nano-Interchange vs. the All-Directional Four-Level: A Comparison of Geometrics, Construction Costs, and Right of Way Requirements. (Under the direction of Dr. Joseph E. Hummer, P.E.).
This thesis introduces the nano-interchange, an innovative concept in freeway-to-freeway
interchange design, originating with Dr. Joseph Hummer, P.E., of North Carolina State
University. Created with the intentions of minimizing the amount of right of way (or the
“footprint”) needed for an urban interchange, the nano-interchange may be an alternative
design for densely populated and developed urban areas. The main objectives of this
thesis were to establish design criteria and typical sections, develop the horizontal and
vertical alignments, and estimate right of way requirements and construction costs for the
nano-interchanges and comparison interchanges. While reviewing the feasibility of the
interchange concept, two design variations emerged, named the “reverse
nano-interchange” and the “parallel nano-nano-interchange” for their distinct geometric features.
This document presents each of these interchange concepts at three different ramp design
speeds (35, 45, and 55 miles per hour), for a total of six nano-interchange designs. As a
comparison, we evaluated all six nano-interchanges against the all-directional four-level
interchange (at the same three ramp design speeds).
Overall, the reverse nano-interchange with a ramp design speed of 35 miles per hour
would need the least amount of right of way but is the most expensive interchange. The
all-directional four-level interchanges would require the most right of way but cost less
the reverse nano-interchange, parallel nano-interchange, and all-directional four-level
interchange range from approximately 39 to 68 acres, 49 to 70 acres, and 54 and 101
acres, respectively. Costs for the reverse nano-interchange, parallel nano-interchange,
and all-directional four-level interchange range from $266M to $289M, $110M to
$179M, and $83M to $150M, respectively. Construction cost estimates and right of way
requirements do not increase linearly as the ramp design speeds increase in increments of
ten miles per hour. Finally, this study concludes by recommending several geometric
modifications to the designs, considerations of the advantages and disadvantages of the
NANO-INTERCHANGE VS. THE ALL-DIRECTIONAL FOUR-LEVEL: A COMPARISON OF GEOMETRICS, CONSTRUCTION COSTS,
AND RIGHT OF WAY REQUIREMENTS
by
Meredith L. Harris, E.I.
A thesis submitted to the Graduate Faculty of North Carolina State University in partial fulfillments of the requirements
for the Degree of Master of Science
CIVIL ENGINEERING
Raleigh, North Carolina
2007
APPROVED BY:
______________________________ ______________________________ Dr. Billy M. Williams Dr. John R. Stone
BIOGRAPHY
Harris, Meredith Louise
The author is from Rocky Mount, North Carolina. She graduated in May 2004 with her
Bachelor of Science Degree in Civil Engineering from North Carolina State University.
Upon completing her undergraduate degree, the author began her Master of Science
Degree Program in Civil Engineering at NC State, concentrating in transportation/traffic
engineering.
As an undergraduate, the author worked as an intern and co-op student for two years with
the North Carolina Department of Transportation in the Project Development and
Environmental Analysis Branch. As a graduate student, she held an internship for two
years with Kimley-Horn & Associates, Inc., in the Transportation Planning and Traffic
Operations division, before starting full-time as an Engineering Analyst in July 2006.
She also worked at various times for the Department of Civil, Construction, and
Environmental Engineering at NC State as a part-time research and teaching assistant.
Upon finishing her graduate work, the author will continue to work with Kimley-Horn &
Associates, Inc., in Raleigh.
The author is an alumna of Alpha Omega Epsilon, Gamma Chapter, and served as a
Membership Education Director during her active years. She was also a member of the
NC State student chapter of the Institute of Transportation Engineers and served as the
ACKNOWLEDGMENTS
I am truly grateful to the professors of my thesis advisory committee, Dr. Joe Hummer,
Dr. Billy Williams, and Dr. John Stone. Thank you for your guidance and
encouragement during undergraduate and graduate classes and throughout the course of
this thesis research. I would also like to thank JP Moon, with whom I enjoyed working
and sharing a joint interest in nano-interchange research.
I would also like to thank those who provided me with valuable data and interchange
information, including Doug Lane and Jon Weathersbee, of the North Carolina
Department of Transportation, and Dr. David Noyce, P.E., Dr. Steven Parker, and Todd
Szymkowski, P.E., of the Department of Civil and Environmental Engineering at the
University of Wisconsin – Madison.
Since May 2004 I have enjoyed working with the engineers and planners of Kimley-Horn
and Associates’ Raleigh TPTO, who are a talented, caring, and fun group. Thank you for
affording me the chance to work with you during my years of graduate school, and I look
forward to the years to come.
I owe the deepest debt of gratitude to my parents, my family, Jason Van Duyn, the Van
Duyn family, and friends who have unconditionally loved and supported me throughout
my time at NC State. There are no words to explain how special you are to me, how
much I appreciate you, or how proud I am to call you mine. The Lord has surely blessed
TABLE OF CONTENTS
LIST OF TABLES... v
LIST OF FIGURES...vi
1 INTRODUCTION...1
Background ...1
Purpose and Objectives...7
Scope...8
2 LITERATURE REVIEW... 11
Other Nano-Interchange Work... 11
Similar Interchanges ... 14
Comparison Interchanges... 16
Left-Hand Entrances and Exits... 25
Adjacent Interchanges... 27
Summary ... 31
3 DESIGN AND ESTIMATES... 32
Design Standards ... 32
Typical Sections ... 35
Two-Dimensional Designs... 35
Cost Estimate Methodology... 49
Right of Way Estimate Methodology ... 51
Summary ... 53
4 RESULTS... 55
Comparison of Cost Estimates ... 59
Comparison of Right of Way Estimates ... 77
Effects of Possible Design Modifications... 78
Summary ... 79
5 CONCLUSIONS... 81
Recommendations for Future Research ... 82
6 REFERENCES... 86
APPENDICES APPENDIX A – All-Directional Four-Level Interchanges Across the United States... 88
APPENDIX B – Stadium Interchange Data ... 91
APPENDIX C – Interchange Calculations ... 104
LIST OF TABLES
Table 1 – Nano-Interchange Ramp Configurations ...5
Table 2 – A Partial List of All-Directional Four-Level Interchanges in the United States... 18
Table 3 – Proximity to the Nearest Interchange (Measured Center-to-Center)... 29
Table 4 – Proximity to the Nearest Interchange (Measured Gore-to-Gore)... 30
Table 5 – Design Standards for Typical Section Selection ... 32
Table 6 – Design Standards for Vertical Alignment ... 33
Table 7 – Design Standards for Horizontal Alignment ... 33
Table 8 – Cost Estimate Analysis Results ... 50
Table 9 – Construction Cost Estimates ... 55
Table 10 – Right of Way Estimates ... 55
Table 11 – Construction Cost Estimate for the Reverse Nano-Interchange, 35 mph Ramp Design Speed ... 60
Table 12 – Construction Cost Estimate for the Reverse Nano-Interchange, 45 mph Ramp Design Speed ... 62
Table 13 – Construction Cost Estimate for the Reverse Nano-Interchange, 55 mph Ramp Design Speed ... 64
Table 14 – Construction Cost Estimate for the Parallel Nano-Interchange, 35 mph Ramp Design Speed ... 66
Table 15 – Construction Cost Estimate for the Parallel Nano-Interchange, 45 mph Ramp Design Speed ... 68
Table 16 – Construction Cost Estimate for the Parallel Nano-Interchange, 55 mph Ramp Design Speed ... 70
Table 17 – Construction Cost Estimate for the All-Directional Four-Level, 35 mph Ramp Design Speed ... 72
Table 18 – Construction Cost Estimate for the All-Directional Four-Level, 45 mph Ramp Design Speed ... 73
Table 19 – Construction Cost Estimate for the All-Directional Four-Level, 55 mph Ramp Design Speed ... 74
Table 20 – Summary – All-Directional Four-Level Interchanges ... 89
Table 21 – Freeway Design Standards and Guidelines for the SEWRPC ... 92
Table 22 – Stadium Interchange Crash Data ... 101
Table 23 – Zoo Interchange Crash Data... 102
Table 24 – Roadway Calculations – 35 mph Ramp Design Speed... 105
Table 25 – Roadway Calculations – 45 mph Ramp Design Speed... 106
Table 26 – Roadway Calculations – 55 mph Ramp Design Speed... 107
Table 27 – Cut/Fill Analysis for 100% Fill ... 111
Table 28 – Cut/Fill Analysis for 80% Fill ... 112
Table 29 – Cut/Fill Analysis for 60% Fill ... 113
Table 30 – Cut/Fill Analysis for 40% Fill ... 114
LIST OF FIGURES
Figure 1 – Interchange with Helical Ramps in Osaka, Japan ...2
Figure 2 – Interchange between Elevated Freeways in Osaka, Japan...2
Figure 3 – Two-Dimensional View of the Nano-Interchange ...4
Figure 4 – Nano-Interchange Ramp Configurations ...5
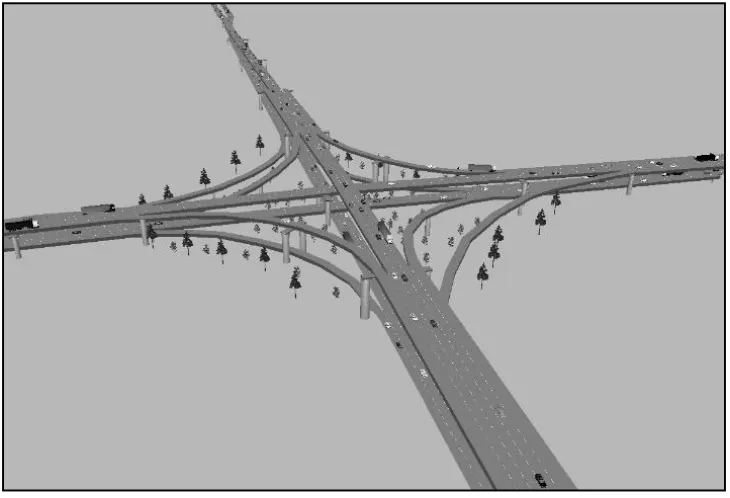
Figure 5 – VISSIM Visualization of the Nano-Interchange...6
Figure 6 – Type C Weaving Diagram (from the HCM 2000, EXH 13-10) ...7
Figure 7 – Thesis/Dissertation Objectives for the Nano-Interchange ...8
Figure 8 – I-94/WI-341 (Stadium Interchange), Milwaukee, Wisconsin ... 15
Figure 9 – Pinwheel Interchange – I-90/I-94 (Kennedy/Dan Ryan Expressways) and I-290 (Eisenhower Expressway) in Chicago, Illinois ... 19
Figure 10 – W-interchange Schematic, Designed by Thompson et al, North Carolina State University, 2002 ... 21
Figure 11 – Bird’s Eye/ British-Flip Interchange: I-95/I-695, Baltimore, Maryland ... 22
Figure 12 – Bird’s Eye/ British-Flip Interchange: I-20/I-59/I-65, Birmingham, Alabama ... 22
Figure 13 – I-94/MI-10, Detroit, Michigan ... 23
Figure 14 – I-10/Beltway 8, Houston, Texas ... 24
Figure 15 – I-95 and I-395/FL-836 (Dolphin Expressway), Miami, Florida ... 25
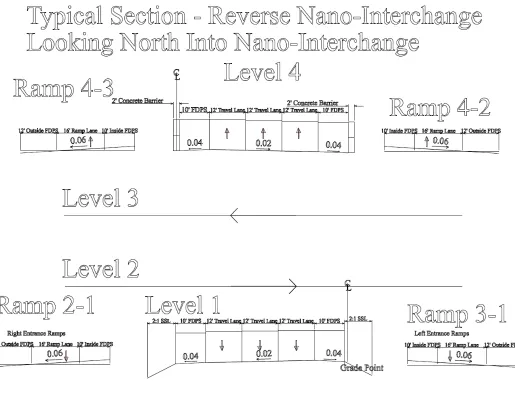
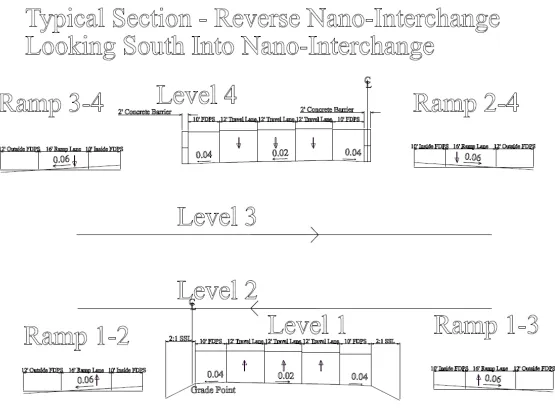
Figure 16 – Freeway Mainline Typical Section... 36
Figure 17 – Parallel Nano-Interchange, Looking North into the Interchange ... 37
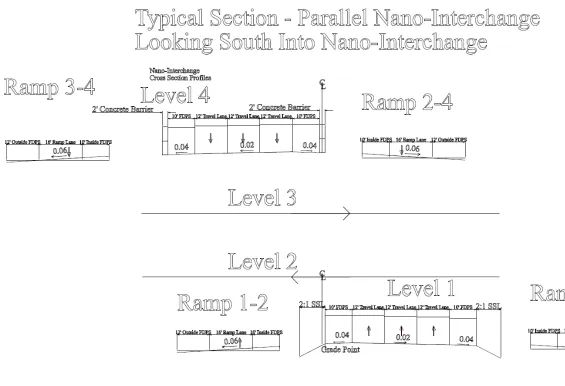
Figure 18 – Parallel Nano-Interchange, Looking South into the Interchange ... 38
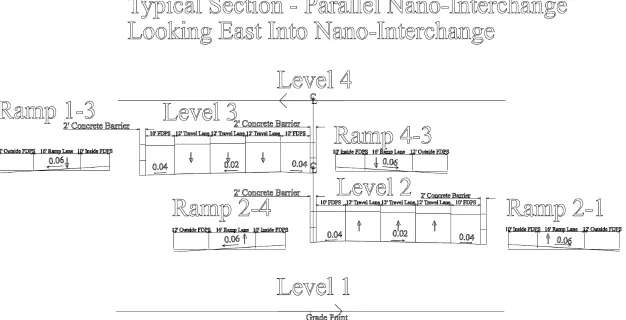
Figure 19 – Parallel Nano-Interchange, Looking East into the Interchange ... 39
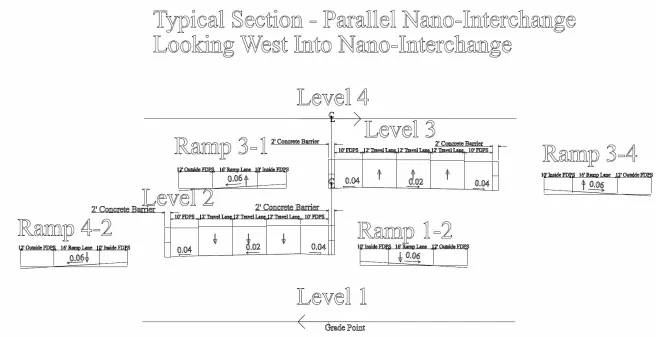
Figure 20 – Parallel Nano-Interchange, Looking West into the Interchange ... 40
Figure 21 – Reverse Nano-Interchange, Looking North into the Interchange ... 41
Figure 22 – Reverse Nano-Interchange, Looking South into the Interchange ... 42
Figure 23 – Reverse Nano-Interchange, Looking East into the Interchange... 43
Figure 24 – Reverse Nano-Interchange, Looking West into the Interchange ... 44
Figure 25 – All-Directional Four-Level with Lateral Clearance Between Structures Highlighted ... 48
Figure 26 – Fill/Structure Costs... 50
Figure 27 – Right of Way Sections for the Nano-Interchanges... 52
Figure 28 – Right of Way Sections for the All-Directional Four-Level Interchanges... 53
Figure 29 – Comparison of Construction Cost Estimates ... 56
Figure 30 – Comparison of Right of Way Estimates ... 57
Figure 31 – Interchange Comparisons – 35 mph Ramp Design Speed... 58
Figure 32 – Interchange Comparisons – 45 mph Ramp Design Speed... 58
Figure 33 – Interchange Comparisons – 55 mph Ramp Design Speed... 58
Figure 34 – Comparison of Designed and Operational All-Directional Four-Level Interchanges ... 77
Figure 35 – Nano-Interchange with Right-Hand Ramps... 83
Figure 36 – Stadium Interchange (SEWRPC) ... 93
1 INTRODUCTION
BACKGROUND
As cities around the world experience population growth and struggle to curb urban
sprawl, developable land tends to become increasingly scarce. In the face of booming
development, real estate values often skyrocket, and the expansion of critical
transportation infrastructure may be limited by periphery development. Urban road
widening and projects on new location can be difficult and expensive to design and
construct. However, maintaining and continually improving a city’s transportation
system to keep up with growth are essential to its economic and overall vitality.
Since many cities are built around freeways, expanding an interchange in the middle of a
central business district, for example, may be complicated. When an urban interchange
needs a boost in capacity, but the surrounding area provides very little room for acquiring
extra right of way, building up instead of out is a possibility. For example, in Osaka,
Japan, where the land development pattern is very dense and right of way is limited,
freeways are often elevated, and interchange ramps may involve the use of a helical ramp
or direct flyovers, as shown in Figures 1 and 2.
The nano-interchange is a new concept in freeway-to-freeway interchange design; the
idea originated with Dr. Joseph Hummer, P.E., of North Carolina State University.
Created with intentions of minimizing the amount of right of way (or the “footprint”)
needed for an urban interchange, the nano-interchange may be an alternative design for
Figure 2
-Interchange between Elevated Freeways in Osaka, Japan,
Figure 1
nano-interchange, discussed in detail in Chapter 3, include direct connections for all
movements, combinations of left- and right-hand entrances and exits, and four levels of
freeway and ramp structures.
During the course of this effort, two variations of the nano-interchange emerged – one
proposed by Dr. Hummer and another by the author. This document presents and
analyzes both. In the author’s version, pairs of freeway directions (north/south and
east/west) remain parallel and horizontally separate throughout. In Dr. Hummer’s
version, shown in Figure 3, pairs of freeway directions travel in the same right of way via
elevated structures.
Diagrams of the nano-interchange in this document are based on a numbering scheme for
identifying freeway mainlines and ramps. Mainline 1 is on the lowest level, mainline 2 is
on the next lowest level, and so on. Ramp 1-3 connects level 1 to level 3, ramp 1-2
connects level 1 to level 2, and so on. Figures 3 and 4 show two-dimensional drawings
of the basic interchange configuration (second version of the nano-interchange) and
numbering system, while Figure 5 shows a three-dimensional VISSIM (a
Figure 4 – Nano-Interchange Ramp Configurations
Table 1: Nano-Interchange Ramp Configurations
From To
Ascend (A) or Descend
(D)
Spans # Levels
Level 1 Level 2 A 1
Level 1 Level 3 A 2
Level 2 Level 4 A 2
Level 3 Level 4 A 1
Level 2 Level 1 D 1
Level 3 Level 1 D 2
Level 4 Level 2 D 2
It is readily apparent that the nano-interchange design has advantages and disadvantages.
Since direct connections provide the shortest path between movements and allow for
smaller footprints, the nano-interchange minimizes right of way requirements compared
to other alternatives. However, disadvantages include possible driver confusion and the
questionable safety record of left-hand entrances and exits.
There are no weaving sections within the nano-interchange itself; however, if used in
combination with traditional interchanges with only right-hand ramps, a dangerous and
inefficient weaving pattern may be created. TheHighway Capacity Manual 2000(HCM
2000) characterizes this weaving segment as a Type C configuration in that “one weaving
movement may be made without making a lane change, and the other weaving movement
requires two or more lane changes.” Figure 6 (Exhibit 13-10 from the HCM 2000) shows
the Type C weaving movement that may be created by a nano-interchange. Suggestions
for avoiding a Type C weaving pattern are introduced and discussed in Chapter 5.
The nano-interchange concept will likely be most appropriate for metropolitan areas
where purchasing right of way for an urban interchange is more difficult or more
expensive than building vertical freeway structures. However, decision-makers must
weigh the advantages and disadvantages of the nano-interchange, evaluate its placement
into an existing transportation system, and determine on a situation-by-situation basis if
its construction is appropriate.
PURPOSE AND OBJECTIVES
The purpose of this research is to introduce the concept of the nano-interchange and
compare the geometric design, right of way requirements, and approximate construction
costs to the traditional level stack interchange, also called the “all-directional
four-leg” interchange in the American Association of State and Highway Transportation
Officials’ (AASHTO)A Policy on Geometric Design of Highways and Streets(2004)
(hereafter referred to as theGreenbook). The objectives of this study include establishing
design criteria and typical sections, developing the horizontal and vertical alignments,
and estimating right of way requirements and construction costs for the nano-interchange
and comparison interchanges.
SCOPE
As Figure 7 shows, the concepts and designs presented in this study are directly related to
the research of Jae-Pil (JP) Moon, a doctoral student in Civil Engineering at North
Carolina State University, also under the instruction of Dr. Hummer. Moon’s work
incorporates the design elements and construction and right of way estimates from this
document to analyze traffic operations, model safety, and extend the cost estimate to
investigate possibilities of the global application of the nano-interchange. The scope and
tasks within his doctoral work are discussed further in Chapter 2, and Moon expects to
publish his research in 2007.
This thesis includes a conceptual (functional) design of the all-directional four-leg and
the two versions of the nano-interchange described above, each at three design speeds for
does not include final construction drawings and, as such, does not consider signage,
constructability, drainage, pavement design, structure design, and other elements critical
to complete plan sheets. It also does not consider driver expectancy and education issues,
traffic operations, or analysis of environmental features such as air quality. All
interchanges presented here are designed to Greenbook and North Carolina Department
of Transportation (NCDOT)Roadway Design Manual(2002) standards.
This study considers the all-directional four-leg interchange design as the best
comparison to the nano-interchange. Both are system interchanges, geometrically similar
in vertical height and footprint shapes, and move traffic volumes at low to high ramp
speeds with continuous movements. Furthermore, the all-directional four-leg is a widely
accepted design in the United States, and suitable sites for comparison to the
nano-interchange were found nationwide. A discussion of rejected comparison nano-interchanges is
included in Chapter 2.
A review of thirty-three all-directional four-leg interchanges across the United States
(included in Appendix A) showed that over two-thirds of the interchanges in the sample
contain a combination of one- and two-lane ramps. Ten of the thirty-three interchanges
cited contain only single-lane ramps, while only two of the thirty-three contain only
two-lane ramps. While traffic volumes and turning movements determine roadway design in
reality, all ramps in each interchange design in this document have a single lane for the
purpose of using equal and fair design standards for both the nano-interchange and the
Although it is likely that the appropriate urban setting for the nano-interchange may have
closely spaced, or adjacent interchanges (located less than a mile apart), the
nano-interchange as designed and estimated in this document is considered isolated. However,
there are many interchanges and ramp configurations that could be used in combination
with a nano-interchange. Chapter 5 lists potential treatments for conflicts from
2 LITERATURE
REVIEW
This project introduces the nano-interchange design concept and compares right of way
and construction estimates to the all-directional four-level interchange. There are several
issues to consider when evaluating the feasibility of the nano-interchange. Although this
study does not investigate each of these topics in detail, understanding previous research
on the subjects may give insight into the chosen design criteria and estimation
methodologies. Furthermore, several of the following topics have an impact on the
traffic operations and safety of system interchanges.
OTHER NANO-INTERCHANGE WORK
Two students in the Civil Engineering department at North Carolina State University
(NCSU), Jianhua Guo and Jae-Pil Moon, have also studied the nano-interchange, both
under the direction of Dr. Joseph Hummer. In November 2004, Jianhua Guo submitted a
document in response to a preliminary Ph.D. exam question for Dr. Hummer. Moon,
mentioned previously in Chapter 1, began his nano-interchange research in 2005. Moon
submitted his Ph.D. dissertation proposal in October 2005 and expects to complete his
research in 2007. The following paragraphs summarize these two nano-interchange
studies and their relationship to this document.
In his report, Guo presented a conceptual geometric design of the nano-interchange, right
of way computation, brief literature review of left-hand (entrance and exit) ramps, and an
his design on the Greenbook, he chose different design criteria than those presented in
Chapter 3 of this document, including the use of spiral curves, different vertical
clearances and structure depths, lane widths for ramps, number of freeway lanes, and
right of way distances required. However, several design criteria in Guo’s document are
identical to those used in this study, such as the maximum grade allowed (four percent),
angle of freeway intersection (90 degrees), and the choice of parallel-type entrances and
exits. Guo’s report served as a basis for the development of the geometric designs of the
nano-interchange presented in this document.
The scope of Guo’s report was constrained to one version of the nano-interchange with a
ramp design speed of 50 miles per hour (mph). Guo compared his right-of-way
calculations for the nano-interchange to the “standard (all-directional four-level)
interchange.” He assumed that both the nano- and all-directional four-level interchanges
were symmetrical and subsequently only compared the acreage of one quadrant of each.
He concluded, from AutoCAD measurements, that the nano-interchange required
approximately 57 acres (from the centerline of the interchange to 70 feet from the
centerline of the ramps), while the comparison (all-directional four-level) interchange
required approximately 99 acres. While the right of way requirements presented in this
document using MicroStation (v8) are not identical to Guo’s, a similar methodology of
measurement applies.
Guo’s literature review investigated seven publications on the topic of left-hand ramp
from these sources that left-hand ramps are less safe in general than right-hand ramps.
He noted that the major studies mentioned in his report originate from the 1960’s in the
United States, when the interstate system was still a relatively new concept.
The safety analysis outlined in Guo’s document is directly related to Moon’s dissertation
research. Both proposed to model and predict the safety of left-hand ramps via similar
methodology, including collecting historic crash data from NCDOT and using
pre-selected geometric and conditional criteria to choose left-hand ramp sample sites. For
example, Moon’s independent variables include geometric design features (such as the
freeway and ramp speed limits), traffic volumes, and others (such as the opening year of
the interchange). Moon chose a negative binomial regression model for his safety
analysis.
Moon’s research also consists of operational analyses of the nano-interchange,
conventional interchange, and possibly the W-interchange (an interchange concept also
originating with Dr. Hummer). He chose VISSIM, a microscopic simulation program,
for each analysis, and total travel time as the main measure of effectiveness (MOE) for
comparison between the three alternatives. Once each geometric design file is imported
into VISSIM and simulations run, Moon will compare the MOEs for all three with a
general linear model.
Moon’s research also involves investigating the global applicability of the
document, he will extend the cost estimates to major cities worldwide using construction
cost-indices and published real estate values. These estimates will provide the basis for
evaluating which cities worldwide might benefit from the construction of a
nano-interchange versus an all-directional four-level nano-interchange.
SIMILAR INTERCHANGES
Before designing the nano-interchange, extensive searches were conducted for similar
interchanges throughout the United States and in major urban areas worldwide, beginning
in August 2005, using Google Earth (Digital Globe maps,Ó 2006). In June 2006, the
I-94/WI-341 (Miller Park Way) interchange, also known as the (Milwaukee Brewers)
Stadium Interchange, in Milwaukee, Wisconsin, was identified as being very similar to
one of the interchange versions presented in this document. Otherwise, the
nano-interchange is not known to exist in any other published document within the United
States or to have been constructed.
Milwaukee’s Stadium Interchange, shown in Figure 8, connects I-94 (known locally as
the East-West Freeway) and Wisconsin State Route 341 (Miller Park Way, formerly
Stadium Freeway). In 1996, the southern section of Miller Park Way was closed to
traffic and rerouted to the east to accommodate the construction of Miller Park, home of
Major League Baseball’s Milwaukee Brewers. Miller Park Way and all ramps of
Stadium Interchange were re-opened in 1998. The posted speed limit on Miller Park
Way changed to 45 mph, though it remained under full access control. Geometric design
from the same direction of travel, continuous flow and direct connections for all
movements, and no loops or weaving segments. Like the parallel nano-interchange,
mainlines of the north-south freeways are grade-separated to over/underpass the east-west
freeways. However, the parallel nano-interchanges presented in this document are more
compact.
According to a May 2003 report by the Southeastern Wisconsin Regional Planning
Commission (SEWRPC), one or more segments of Stadium Interchange do not meet the
minimum criteria for vertical curvature, horizontal curvature, vertical alignment (grade),
lane balance and route continuity, and vertical clearance, according to AASHTO and
Wisconsin Department of Transportation standards. Appendix B contains a copy of the
design standards table from the SEWRPC report.
Figure 8 - I-94/WI-341 (Stadium Interchange), Milwaukee, Wisconsin.
Dr. David Noyce, P.E., Dr. Steven Parker, and Todd Szymkowski, P.E., all of the
University of Wisconsin – Madison, provided the author access to crash data and traffic
volumes for the Stadium Interchange through the Department of Civil and Environmental
Engineering’s Traffic Operations and Safety (TOPS) Laboratory. During the time period
from January 2003 to December 2005, there were approximately forty crashes at Stadium
Interchange, about sixty percent of which occurred on a ramp. Comparatively, the Zoo
Interchange (I-94/I-894 at US 45), a freeway-to-freeway birds’ eye (British Flip)
interchange located to the west of Stadium Interchange in Milwaukee, experienced
approximately seventy crashes during the same period, of which forty percent occurred
on a ramp.
Both interchanges are found along I-94 and have a similar annual average daily traffic
volume (AADT). In 2005, the AADT along I-94 (both directions) ranged from 143,000
vehicles west of the Zoo Interchange to 160,000 vehicles east of the Stadium Interchange
(towards downtown Milwaukee). Overall, this data provides an interesting comparison
of two urban interchanges but does not necessarily substantiate any conclusions about the
traffic operations or safety of the Stadium Interchange. Crash data obtained from
searching the TOPS database and an AADT map from the Wisconsin DOT for these
interchanges are located in Appendix B.
COMPARISON INTERCHANGES
There are several types of interchanges presented in this chapter that were initially
four-level interchange was chosen. Like the nano-interchange, it is an urban system
interchange with similar geometrics, including four levels, continuous traffic flow
without loops or weaving, and full turning movements. It can be designed to
accommodate all design speeds chosen for the ramps (35, 45, and 55 mph). The
all-directional four-level is defined in the Greenbook as having direct connections (“one-way
roadways that do not deviate greatly from the intended direction(s) of travel”) and is
presented in Exhibits 10-1H, 10-33B, 10-36, and 10-54. Its design is widely accepted
across the United States, and Table 2 shows a partial list (expanded in detail in
Appendix A) of all-directional four-level interchanges located in the United States.
The characteristics of these sites were helpful during this design work. For instance,
twenty-one of the thirty-three interchanges in Table 2 have a combination of both
one-and two-lane ramps. Ten of the total have only one-lane ramps, one-and two interchanges in
the table have only two-lane ramps. This indicates that traffic volumes dictate the
numbers of lanes per ramp and vary by site. In this study, to apply fair design criteria to
each interchange, all nano-interchanges and comparisons were designed with one-lane
ramps.
Other interchanges initially considered as possibilities for comparison include the
pinwheel/turbine, W-interchange, Bird’s Eye/British Flip, and variations of the
Table 2 - A Partial List of All-Directional Four-Level Interchanges in the United States
City State Freeway Freeway
1 Birmingham AL I-20 I-459 2 Birmingham AL I-65 I-459 3 Shreveport LA LA 3132 (Inner Loop Expressway) I-49 4 Baton Rouge LA US 61/190 (Airline Highway) I-110
5 Dallas TX President George Bush Turnpike Dallas North Tollway
6 Dallas TX I-45/US 75 I-30/US 67 (R. L. Thornton Freeway) 7 Houston TX I-610 (near Sylvester Road) US 75 (North Freeway)
8 Houston TX I-610 US 59 (Southwest Freeway) 9 Houston TX I-610 TX 288 (South Freeway) 10 Houston TX I-610 I-10/US 90/TX 73 (East Freeway) 11 Houston TX I-610 I-10/US 90 (Katy Freeway) 12 San Antonio TX I-410/US 281 I-37/US 181
13 San Antonio TX I-10/US 90/US 87 I-35/US 81 (Panam Expressway) 14 San Antonio TX I-10/US 90/US 87 I-37/US 281
15 Denver CO CO 470 I-25/US 87 (near Park Meadows)
16 Seattle WA I-90 I-405
17 Phoenix AZ I-10 (Maricopa Freeway) AZ 202 (Santan Freeway)
18 Phoenix AZ I-17 (Arizona Veterans Mem. Highway) AZ 101 (Agua Fria Fwy, Pima Freeway) 19 San Diego CA I-8 (Mission Valley Freeway) I-805 (Jacob Dekema Freeway) 20 Ontario CA I-15 (Ontario Freeway) I-10 (San Bernadino Freeway) 21 Pomona CA CA 57 (Orange Freeway) I-10 (San Bernadino Freeway) 22 Los Angeles CA US 101 (Hollywood Freeway) CA 110 (Pasadena Freeway) 23 Detroit MI I-75 (Chrysler Freeway) I-696 (Walter P. Reuther Freeway) 24 Detroit MI I-96 (Jeffries Freeway) MI-39 (Southfield Freeway) 25 Cleveland OH I-90/I-490 I-90/I-71 (near Lincoln Park) 26 Cleveland OH I-490 I-77 (at Broadway Avenue) 27 Independence OH I-77 I-480 (Outerbelt South Freeway) 28 Baltimore MD I-695 (Baltimore Beltway Outer) I-70
29 Nashville TN I-440 I-65 30 Albany NY I-90 (Patroon Island Bridge) I-787
31 Albany NY I-90 US 9
32 Queens, NY NY I-295 (Clearview Expressway) Grand Central Parkway
Pinwheel/Turbine
The pinwheel, or turbine, interchange (such as the intersection of I-90/I-94
(Kennedy/Dan Ryan Expressways) and I-290 (Eisenhower Expressway) in Chicago,
Illinois, shown as Figure 9) is referenced in the Greenbook as Exhibit 10-33A. While it
is a multi-level, system interchange (like the nano-interchange), the pinwheel has
semi-direct connections that usually have low design speeds and is not as widely used as the
all-directional four-level.
Figure 9 - Pinwheel Interchange – I-90/I-94 (Kennedy/Dan Ryan Expressways) and I-290
W-Interchange
The concept of the W-interchange originated with Dr. Hummer and was previously
investigated by North Carolina State University graduate students Cipriana Thompson,
Roger Kluckman, and Natasha Rodevick. In 2002, Thompson submitted her thesis,
Comparison of Operation Characteristics of the W-Interchange and Conventional
Interchanges Using Microscopic Simulation, and Kluckman completed his Master’s
project titledW-Interchange Design and Cost Analysis. These two documents introduced
the W-interchange design (one version of which is shown in the schematic diagram in
Figure 10), reported traffic operations using microsimulation software, and estimated the
right-of-way requirements and costs.
Thompson’s and Kluckman’s work served as the basis for Rodevick’s Master’s project in
2004,Comparing the Operations of the Freeway-to-Freeway W-Interchange Designs to
Other Freeway-to-Freeway Conventional Designs. Since the W-interchange involves
semi-direct connections and weaving sections (in one version of the design), it is not
considered as a comparison interchange in this study. However, Moon may compare
traffic operations and safety characteristics of the W-interchange, nano-interchange, and
all-directional four-level interchange in his dissertation. It is important to mention the
W-interchange here, since the premise of its design is the minimization of right-of-way, like
W-Interchange (By Dr. Hummer)
Bird’s Eye/British Flip
The bird’s eye interchange is a variation of the all-directional four-level. It is also known
as the “British-flip” interchange, since the freeway mainlines are grade-separated for a
short distance with their directions “flipped” (also called “braided”), as in the British
style of driving on the left side of the road. This allows direct connections using a
combination of left-hand and right-hand ramps. Examples of this interchange, shown in
Figures 11 and 12, include the I-95 (JFK Memorial Highway) and I-695 (Beltway Loop)
interchange in Baltimore, Maryland, and the I-20/I-59 and I-65 interchange in
Birmingham, Alabama. However, the bird’s eye or British-flip interchange is rare and as
such, is not considered as a comparison interchange in this study. In fact, as part of a
larger project along the JFK Memorial Highway, the Maryland Transportation Authority
is planning to convert the interchange of I-95/I-695 in Baltimore to a “four-level stack,”
Figure 11 - Bird’s Eye/ British-Flip Interchange. I-95/I-695, Baltimore, Maryland. Ó
2006 Google – ImageryÓ 2006 Sanborn, MapÓ 2006 NAVTEQÔ
Figure 12 - Bird’s Eye/ British-Flip Interchange. I-20/I-59/I-65, Birmingham, Alabama.
or an all-directional four-level, by 2011, to eliminate left-hand entrances and exits and
accommodate toll lanes.
Look-Alikes
Several interchanges around the United States appear to be of the nano-interchange
variety, but they lack important characteristics to qualify. For example, the I-94 (Edsel
Ford Freeway) and M-10 (John C. Lodge Freeway) interchange in Detroit, Michigan, and
the I-10 (Katy Freeway) and Sam Houston Tollway (Beltway 8) interchange in Houston,
Texas, both have a footprint similar to the nano-interchange, have direct connections, etc.
However, in these interchanges the freeway mainlines are not arranged in
nano-interchange fashion, where mainlines 1 and 4 vertically surround (under/overpass)
mainlines 2 and 3. While the Ford/Lodge interchange in Detroit includes left-hand
entrances and exits, the I-10/Beltway 8 interchange in Houston actually only has
right-hand ramps. These two interchanges are shown in Figures 13 and 14.
Figure 13 - I-94/MI-10, Detroit, Michigan.
Another look-alike is the I-95/I-395/FL-836 (Dolphin Expressway) interchange in Miami,
Florida, shown in Figure 15. At this site, freeway mainlines do not follow the
nano-interchange pattern. Instead, north/south mainlines are on levels 1 and 3, and the
east/west mainlines are on levels 2 and 4. This creates an extreme descent for the ramp
carrying westbound traffic turning south, which drops from the highest level to the
lowest. Furthermore, this interchange has left-hand and hand exits, but only
right-hand entrances.
Figure 14 - I-10/Beltway 8, Houston, Texas.
LEFT ENTRANCES AND EXITS
The nano-interchange contains both left-hand and right-hand entrances and exits.
Research on the safety of left-hand ramps in the United States began in the 1960’s with
construction of the national interstate system, initiated by the Federal Highway Act of
1956. Guo’s literature review first cites the Automotive Safety Foundation and the
United States Bureau of Public Road’s “Traffic Control and Roadway Elements: Their
Relationship to Highway Safety.” This report concluded that since drivers were more
unfamiliar with left-hand ramps, driver confusion led to more frequent collisions than on
right-hand ramps.
Figure 15 - I-95 and I-395/FL-836 (Dolphin Expressway), Miami, Florida.
Other studies in Guo’s research that discourage the use of left-hand ramps include Lundy
(1967), AASHTO (1974), Twomey et al (1993), Leisch (1993) and Garber et al (1999).
Lundy’s (1967) results concluded that left-hand off-ramps had the highest crash rates of
ten types of freeway ramps over a three-year period. AASHTO’s (1974)Highway
Design and Operational Practices Related to Highway Safety stated that left-hand ramps
“have poorer operational and safety records than right-hand exits and should not be used
on new construction.” Twomey et al (1993) reviewed past safety research associating
crashes with interchange features such as geometric layout (including ramp types) and
interchange spacing. This study concluded that, from previous research, cloverleaf
ramps, scissor ramps, and left-hand ramps should be avoided in interchange design.
Scissor ramps involve vehicles exiting the freeway onto a two-way frontage road, where
vehicles already on the frontage road must stop and wait for a sufficient gap in vehicles
exiting the freeway before continuing on the frontage road. Wisconsin’s I-94/County K
interchange in the Kenosha-Racine area is one example of an interchange with scissor
ramps. Leisch’s (1993) study suggested that right-hand exits and entrances, with lower
crash rates, were preferable to left-hand ramps on freeways. Research by Garber and
Fontaine (1999) discouraged using left-hand ramps in interchange design, citing results
from Fisher (1961).
Moon’s literature review (2005) identified mixed results among left-hand ramp studies.
Two studies at Northwestern University by Worrall et al. (1970) and Berry et al. (1971)
analyzed the operations of both left-hand and right-hand ramps in the Chicago area. Both
sites that at right-hand ramp locations, and the left-hand ramp sites did not produce
adverse effects on freeway traffic compared to the right-hand ramps in the sample.
However, Hanks et al. (1992) analyzed the operational and safety impacts of
freeway-to-freeway interchanges under various volume scenarios with several geometric
considerations, including left-hand ramps. The authors performed a case study in which
they selected an interchange containing a left-hand ramp to “convert” to a right-hand
ramp and evaluate the operational effects with a computer model. Though there were
contributing congestion, weaving, and ramp spacing problems at the site, the authors
concluded that the left-hand exit ramp was “associated with a substantial number of
accidents occurring along this section of the freeway.” The study recommended that
replacing the left-hand exit with a right-hand ramp would “eliminate weaving problems,
improve driver expectancy, and simplify the signing layout prior to the mainline section.”
ADJACENT INTERCHANGES
Interchanges are major economic investments and provide access to important roadways
and industrial, commercial, retail, and recreational centers within a city. Appropriate
interchange spacing, often a function of traffic demand, weaving volumes, topography,
economics, and frequency and spacing of major roadways, is necessary to achieve desired
levels of service on freeways and cross-streets. When interchanges are spaced closely
together, drivers must make decisions quickly and navigate possible weaving sections in
a shorter distance. Interchanges spaced too far apart with less access to major roadways
operations. The Greenbook notes that “a general rule of thumb for minimum interchange
spacing is one mile in urban areas and two miles in rural areas. In urban areas, spacing of
less than one mile may be developed by grade-separated ramps or by adding
collector-distributor roads.”
A 2004 National Cooperative Highway Research Program (NCHRP) report
(Synthesis 332) found that minimum access spacing standards vary by state departments
of transportation, including points of reference for measurements (i.e. gore, end of taper,
end of radius, etc.). State agencies also use different criteria, such as interchange
“importance,” to determine interchange spacing. For example, freeway-to-arterial (or
service) interchanges usually need less access spacing than system interchanges, due to
vehicle deceleration onto urban roadways, and have fewer weaving sections.
Of the thirty-three all-directional four-level interchanges identified in the United States,
mentioned previously, the approximate spacing (center-to-center) was measured between
each approach and the nearest interchanges to the north, south, east, and west. A
summary of these distances is included in Table 3. Overall, interchanges “adjacent” to
these all-directional four-level interchanges are located an average of 5,600 feet away.
Approximate distances between adjacent interchange gores were also measured and are
reported in Table 4. The average gore-to-gore spacing is approximately 2,600 feet. The
HCM 2000 states that weaving sections longer than 2,500 feet should be treated as
isolated merge and diverge areas using the procedures of Chapter 25, “Ramps and Ramp
Table 3 - Proximity to the Nearest Interchange (Measured Center-to-Center) Center-Center Approx Distance (ft) to:
City State Freeway Freeway North South East West
1 Birmingham AL I-20 I-459 10,000 10,000 15,000 5,000
2 Birmingham AL I-65 I-459 10,000 14,000 10,000 7,000
3 Shreveport LA LA 3132 (Inner Loop Expressway) I-49 8,000 7,000 4,000 4,000
4 Baton Rouge LA US 61/190 (Airline Highway) I-110 4,500 3,000 3,000 4,000
5 Dallas TX President George Bush Turnpike Dallas North Tollway 4,000 4,000 10,000 4,000
6 Dallas TX I-45/US 75 I-30/US 67 (R. L. Thornton Freeway) 2,000 5,000 3,500 2,000
7 Houston TX I-610 (near Sylvester Road) US 75 (North Freeway) 5,000 3,500 7,000 3,500
8 Houston TX I-610 US 59 (Southwest Freeway) 4,500 4,000 4,000 5,000
9 Houston TX I-610 TX 288 (South Freeway) 7,000 4,500 4,000 4,000
10 Houston TX I-610 I-10/US 90/TX 73 (East Freeway) 5,000 13,000 5,500 6,000
11 Houston TX I-610 I-10/US 90 (Katy Freeway) 5,000 5,000 7,000 5,000
12 San Antonio TX I-410/US 281 I-37/US 181 9,000 9,000 10,000 4,000
13 San Antonio TX I-10/US 90/US 87 I-35/US 81 (Panam Expressway) 3,000 3,000 4,000 3,000
14 San Antonio TX I-10/US 90/US 87 I-37/US 281 4,000 5,000 4,500 6,000
15 Denver CO CO 470 I-25/US 87 (near Park Meadows) 4,000 7,000 9,000 9,000
16 Seattle* WA I-90 I-405 8,000 5,000 8,500 3,500
17 Phoenix AZ I-10 (Maricopa Freeway) AZ 202 (Santan Freeway) 3,000 17,000 8,000 8,000
18 Phoenix AZ I-17 (Arizona Veterans Mem. Highway) AZ 101 (Agua Fria Fwy, Pima Fwy) 6,000 4,500 2,500 2,500 19 San Diego CA I-8 (Mission Valley Freeway) I-805 (Jacob Dekema Freeway) 6,000 6,000 6,500 2,500 20 Ontario CA I-15 (Ontario Freeway) I-10 (San Bernadino Freeway) 3,500 7,000 6,000 4,000 21 Pomona CA CA 57 (Orange Freeway) I-10 (San Bernadino Freeway) 5,000 8,000 6,000 10,000 22 Los Angeles CA US 101 (Hollywood Freeway) CA 110 (Pasadena Freeway) 4,000 3,000 1,500 4,500 23 Detroit MI I-75 (Chrysler Freeway) I-696 (Walter P. Reuther Freeway) 5,000 3,000 5,500 5,000 24 Detroit MI I-96 (Jeffries Freeway) MI-39 (Southfield Freeway) 3,000 2,500 5,000 6,000
25 Cleveland OH I-90/I-490 I-90/I-71 (near Lincoln Park) 4,000 4,000 3,500 1,500
26 Cleveland OH I-490 I-77 (at Broadway Avenue) 4,500 3,000 3,000 5,000
27 Independence OH I-77 I-480 (Outerbelt South Freeway) 6,000 4,000 8,000 10,000
28 Baltimore MD I-695 (Baltimore Beltway Outer) I-70 2,000 7,000 9,000 23,000
29 Nashville TN I-440 I-65 6,000 6,000 7,000 10,000
30 Albany NY I-90 (Patroon Island Bridge) I-787 6,500 6,000 4,000 4,000
31 Albany NY I-90 US 9 2,500 3,000 4,000 7,500
32 Queens, NY NY I-295 (Clearview Expressway) Grand Central Parkway 3,000 1,000 6,000 2,500 33 Atlanta GA I-85/State 403 (Northeast Expy) GA 407 (James Billy McKinney Hwy) 3,000 6,000 3,000 6,000
Table 4 - Proximity to the Nearest Interchange (Measured Gore-to-Gore) Gore— Gore Approx Distance to the:
City State Freeway Freeway North South East West
1 Birmingham AL I-20 I-459 6,000 6,000 12,000 1,100
2 Birmingham AL I-65 I-459 6,000 10,000 6,000 3,000
3 Shreveport LA LA 3132 (Inner Loop Expressway) I-49 5,000 2,000 650 650
4 Baton Rouge LA US 61/190 (Airline Highway) I-110 2,000 3,000 2,000 1,400
5 Dallas TX President George Bush Turnpike Dallas North Tollway 600 2,000 6,000 600
6 Dallas TX I-45/US 75 I-30/US 67 (R. L. Thornton Freeway) 1,000 1,000 1,600 3,000
7 Houston TX I-610 (near Sylvester Road) US 75 (North Freeway) 1,700 1,500 2,000 2,000
8 Houston TX I-610 US 59 (Southwest Freeway) 2,000 1,100 2,000 2,000
9 Houston TX I-610 TX 288 (South Freeway) 2,000 1,200 1,000 1,200
10 Houston TX I-610 I-10/US 90/TX 73 (East Freeway) 1,500 3,500 1,400 2,000
11 Houston TX I-610 I-10/US 90 (Katy Freeway) 4,000 2,000 4,000 2,000
12 San Antonio TX I-410/US 281 I-37/US 181 6,000 5,500 6,600 800
13 San Antonio TX I-10/US 90/US 87 I-35/US 81 (Panam Expressway) 3,000 600 1,400 1,800
14 San Antonio TX I-10/US 90/US 87 I-37/US 281 1,500 2,000 800 3,500
15 Denver CO CO 470 I-25/US 87 (near Park Meadows) 2,700 2,500 3,000 3,500
16 Seattle* WA I-90 I-405 5,400 2,500 3,500 700
17 Phoenix AZ I-10 (Maricopa Freeway) AZ 202 (Santan Freeway) 1,200 1,700 3,000 4,800
18 Phoenix AZ I-17 (Arizona Veterans Mem. Highway) AZ 101 (Agua Fria Fwy, Pima Fwy) 600 4,600 2,200 4,000 19 San Diego CA I-8 (Mission Valley Freeway) I-805 (Jacob Dekema Freeway) 2,400 1,500 3,600 1,000
20 Ontario CA I-15 (Ontario Freeway) I-10 (San Bernadino Freeway) 800 2,500 2,000 500
21 Pomona CA CA 57 (Orange Freeway) I-10 (San Bernadino Freeway) 2,500 3,000 2,000 6,000
22 Los Angeles CA US 101 (Hollywood Freeway) CA 110 (Pasadena Freeway) 700 800 700 2,000 23 Detroit MI I-75 (Chrysler Freeway) I-696 (Walter P. Reuther Freeway) 2,000 2,800 1,600 1,700
24 Detroit MI I-96 (Jeffries Freeway) MI-39 (Southfield Freeway) 2,000 2,000 1,500 3,000
25 Cleveland OH I-90/I-490 I-90/I-71 (near Lincoln Park) 2,000 1,000 2,000 1,000
26 Cleveland OH I-490 I-77 (at Broadway Avenue) 1,800 2,500 1,000 2,200
27 Independence OH I-77 I-480 (Outerbelt South Freeway) 3,000 4,000 4,500 5,500
28 Baltimore MD I-695 (Baltimore Beltway Outer) I-70 2,000 4,000 4,000 16,000
29 Nashville TN I-440 I-65 4,000 2,500 4,000 6,000
30 Albany NY I-90 (Patroon Island Bridge) I-787 3,000 2,500 1,500 1,800
31 Albany NY I-90 US 9 500 800 1,800 3,600
SUMMARY
This chapter shows that the all-directional four-level interchange is the best comparison
to the nano-interchange. Both are operationally and geometrically similar, and the
all-directional four-level is frequently used and widely accepted in the United States. The
following chapters consider only the all-directional four-level interchange as a
comparison to the nano-interchange designs. This chapter also shows that previous
research on the safety of left-hand ramps is conflicting. While most research concludes
that right-hand ramps are preferable to left-hand ramps, other research suggests that
collisions occur on left-hand ramps no more frequently than on right-hand ramps.
However, researchers, designers, AASHTO, and NCDOT agree that the creation of
dangerous weaving segments by using a combination of left- and right-hand ramps is
undesirable. Finally, this chapter shows that of the thirty-three all-directional four-level
interchanges cited, some can be considered isolated (more than one mile away from other
interchanges) even though they are in an urban setting. The nano-interchange designs
presented in the following chapters incorporate left-hand ramps but are considered
isolated. The nano-interchange is intended for use in an urban setting, where other
3 DESIGN AND ESTIMATES
The following chapter addresses issues encountered during typical cross section selection
and interchange design. As mentioned earlier, all interchanges presented meet
Greenbook and NCDOT Roadway Design Manual (RDM) (2002) recommendations and
standards. They are designed to decrease the overall right-of-way required, often using
minimum values. However, while reducing right of way may lower potential impacts
and costs, using minimum values may negatively affect roadway safety, compared to
more generous values.
DESIGN STANDARDS
Tables 5 through 7 describe the design standards chosen for this study, based on the listed
references. Calculations resulting from these design standards for ramp curvatures (for
all three design speeds) can be found in Appendix C. The formulas used are well known
and are presented in many transportation engineering texts.
Table 5: Design Standards for Typical Section Selection
Mainline Ramps
ROADWAY
(Levels 1, 2, 3, 4) Reference and Remarks
Classification FWY - NCDOT 1-1A
Terrain Type LEVEL - NCDOT 1-1D
Design Speed (mph) 70 35, 45, 55 NCDOT 1-1B, AASHTO pg 504
Typical Section Type SHOULDER SHOULDER NCDOT 1-2A, F-1
Lane Width 12 ft 16 ft AASHTO pg 504
Median Width 22 ft - AASHTO pg 513
Left Shoulder Width 10 ft 10' + 10' + RIGID 2' BARRIER =22' MEDIAN, AASHTO pg 505
Right Shoulder Width 10 ft
Inside* = 10 ft
Outside* = 12 ft AASHTO pg 505, NCDOT 8-2
Through Lanes 3 1
Table 6: Design Standards for Vertical Alignment
Mainline Ramps
VERTICAL ALIGNMENT
VARIABLE (Levels 1, 2, 3, 4) Reference and Remarks
K Values
Crest 247 35 mph - 2945 mph - 61
55 mph - 114 AASHTO pg 272 EXH 3-72
Sag 181 35 mph - 4945 mph - 79
55 mph – 115 AASHTO pg 277 EXH 3-75
Maximum Grade (%) 4 AASHTO pg 506 EXH 8-1
Vertical Clearance 16.5 ft AASHTO pg 763
Table 7: Design Standards for Horizontal Alignment
Mainline Ramps
HORIZONTAL ALIGNMENT
VARIABLE (Levels 1, 2, 3, 4) Reference and Remarks
Maximum Superelevation Rate 0.06 0.06 AASHTO pg 505, NCDOT 1-15
Spiral Curves NONE NONE NCDOT 1-11
Minimum Radii 2040 ft 35 mph - 340 ft45 mph - 643 ft 55 mph - 1060 ft
AASHTO pg 147, EXH 3-15
Minimum Deceleration Lane - 36 mph - 490 ft45 mph - 390 ft 55 mph - 340 ft
AASHTO EXH 10-70
Minimum Acceleration Lane - 37 mph - 1230 ft45 mph - 820 ft 55 mph - 580 ft
AASHTO EXH 10-73
There are four basic kinds of roadway design plans in the NCDOT planning/design
process: conceptual, functional, preliminary, and final construction plans. Conceptual
designs simply show the project corridor(s) for determining the scope of work, study
area, potential environmental issues, etc. Following the identification of one or more
alternatives, functional designs are overlaid onto ground-controlled aerial photography
stations and curve data), edge of pavement lines, property information, the development
of horizontal and vertical alignments, a preliminary (rough) earthwork estimate, and
right-of-way lines. Preliminary roadway designs are a continuation of functional designs,
with refined horizontal and vertical alignments of L-lines and Y-lines, detailed
intersection designs, markings for lane lines, construction limits, guardrail location(s),
curb and gutter placement, retaining wall lengths and locations, proposed easements,
traffic phasing diagrams and detour routing (if necessary), more precise earthwork and
construction estimates, etc. Lastly, construction drawings expand further upon
preliminary plans with more detailed stationing, superelevation annotations, etc., for
roadway construction to begin.
The designs of this document are not complete NCDOT functional or preliminary
designs. All of the nano-interchange designs presented here began as conceptual designs,
to determine the feasibility of the idea, and then became designs with features combining
some of the requirements for both functional and preliminary plans. For example, the
NCDOT requirement to plot property information on functional designs does not apply to
this project. Also, L-lines and Y-lines (for intersecting streets) required on preliminary
plans do not apply and are not included in these designs. In summary, these plan sheets
do not meet the exact specifications for either functional or preliminary designs as
required by NCDOT. They include only the necessary amount of design effort for
estimating earthwork quantities and construction costs and for input into VISSIM for
TYPICAL SECTIONS
This study produced and evaluated two different design styles for the nano-interchange.
Normal crown and slopes on the freeway mainline remain constant in all designs, as
shown in Figure 16. One of the designs, named the “parallel nano-interchange,” features
mainline freeways in separate footprints, running parallel. The I-94/WI-341 interchange
(Stadium Interchange) in Milwaukee, Wisconsin (previously discussed and shown in
Figure 8) displays this concept. Figures 17-20 show the typical sections for the parallel
nano-interchange. The second type of typical section selected for study was referred to
as the “reverse nano-interchange” for the reverse curves used to stack freeways traveling
in the same direction. Figures 21-24 show the typical sections for the reverse
interchange. The author modified Dr. Hummer’s original idea (the reverse
nano-interchange) to achieve the parallel nano-interchange in an attempt to minimize costs.
TWO-DIMENSIONAL DESIGNS
Plan sheets for the three interchanges (all-directional four-level, parallel
nano-interchange, and reverse nano-interchange) at each of the three design speeds chosen for
the ramps (35, 45, and 55 mph) are saved on a CD in Dr. Hummer’s possession. The
nano-interchange design is versatile and lends itself easily to various forms. Though only
two are presented here, others certainly are possible, such as imposing a sag curve on the
lowest level to follow the topographic contours of a valley, for example. Another
variation may include tunneling, or additional structures to avoid natural or man-made
environmental features. In all of the designs in this study, freeway mainlines 2, 3, and 4
The author chose ramp design speeds of 35, 45, and 55 mph based on an initial
hypothesis that as design speeds (and thus minimum radii requirements) increased
linearly (here, in increments of 10 mph), the right of way requirements and construction
cost estimates might also increase linearly. Low, mid- and upper-range ramp design
speed values were found in the Greenbook (Exhibit 3-15).
There are several benefits to the configuration of the reverse and parallel
nano-interchanges (remember that mainlines 1, 2, 3, and 4 travel south, east, west, and north,
respectively):
· While entering the reverse nano-interchange, vehicles on all approaches climb on
a maximum grade of four (4) percent. This vertical climb does not occur
simultaneously with the reverse curve in the horizontal alignment of the mainline.
Since horizontal and vertical curves do not overlap in either the reverse or parallel
nano-interchange designs, sight distance is not limited by geometric design.
· There is only one set of reverse curves per each direction of the mainline in the
design for the reverse nano-interchange. For example, mainline 1 does not curve
inward to meet the horizontal alignment with mainline 4 only to curve outward
again beyond the interchange. Instead, mainline 4 curves apart from mainline 1 to
achieve a separate footprint.
· Designing each (reverse nano-interchange) mainline to curve right and then left
on all approaches emphasizes driver consistency.
· For both the reverse and parallel nano-interchanges, the ramp configuration
No vehicles must travel from the lowest to the highest mainlines, or vice versa, as
in some interchanges.
· Ramp gores can be staggered apart from each other on the freeway mainline, so
that two ramps do not terminate at the same station along the mainline. Two
ramps converging on a mainline at one point exists in only a limited number of
interchanges in the United States and is not recommended in the Greenbook.
· There is an opportunity for the design of a nano-interchange with all right-hand
entrances and exits that is different from the all-directional four-level. Chapter 5
includes a basic diagram of this interchange.
Several issues presented challenges during design work. One issue involved the need to
add extra vertical clearance (a total of 36.5 feet) between freeway mainlines 2 and 3 in
the reverse nano-interchange designs. This additional clearance allows 13.5 feet for
signage, since these two levels are stacked, plus 6.5 feet for structure depth and 16.5 feet
for clearance. The additional 13.5 feet clearance is a conservative, or worst-case,
estimate based on the construction project to rebuild I-77 near I-85 in Charlotte, North
Carolina. According to MUTCD highway signage requirements, this clearance allows
for the sign plus a structure and lighting apparatus.
An issue that arose with the reverse nano-interchange designs involved providing
sufficient lateral (horizontal) clearance between ramp structures in the quadrants
containing ramps 3-1 and 4-2 and ramps 1-3 and 2-4. The vertical alignments of these
therefore cannot carry the same horizontal alignment. Based on NCDOT
recommendations and clearances used for existing structures, this design provides at least
ten feet of lateral clearance between the two ramps. The resulting offsets are shown in
the plan sheets appended by reference.
A final issue with the reverse nano-interchange involved the design of the reverse curves
on the mainlines. Though not commonly used in North Carolina, NCDOT allows reverse
curves on freeways and recommends using minimum radii as outlined in the Greenbook.
NCDOT also suggests omitting tangents between curves. Since this study sets the
design speed for mainlines as 70 mph, a minimum radius of 2040 feet applies for the
reverse curves in reverse nano-interchange designs.
Several issues in designing the all-directional four-level interchange also presented
challenges. Fortunately, this interchange exists in many cities around the United States
(referenced in Table 2, Chapter 2), and samples provided guidance for the three versions
presented in this study. For example, of the thirty-three all-directional four-levels
sampled in the United States, twelve interchanges carry ramps on the highest levels while
mainlines are on the two lowest levels. Another twelve interchanges carry ramps on the
middle levels and split mainlines on the lowest and highest levels. The remaining
interchanges in the sample contain different combinations of level schemes for mainlines
and ramps. In this study, all ramps in the all-directional four-level interchange designs
minimize costs. A mainline structure has a wider typical section than a one-lane ramp
structure. Given the same height and distance, the one-lane ramp structure costs less.
Providing sufficient lateral spacing (shown between the dashed arrows in Figure 25)
between ramp structures on the same level in the all-directional four-level interchanges
was also an issue during design. Based on existing structures, several options made sense
for providing different lateral clearances in each of the three designs. The all-directional
four-level designs presented here include lateral clearances of 10 feet, 80 feet, and 350
feet for the 35 mph, 45 mph, and 55 mph ramp design speeds, respectively. Examples of
existing operational interchanges that share these lateral clearances between ramps are
the Airline Highway (US 61/190) / I-110 interchange in Baton Rouge, Louisiana (which
has a lateral clearance between ramps of 10 feet), the Outerbelt South Freeway (I-480) /
I-77 interchange in Independence, Ohio (80 feet), and the Mission Valley Freeway (I-8) /
Jacob Dekema Freeway (I-305) interchange in San Diego, California (350 feet).
Figure 25 - All-directional four-level with lateral clearance between structures highlighted.
COST ESTIMATE METHODOLOGY
To begin estimating the cost of construction for each of the nine interchanges in this
study, an initial meeting was held with Doug Lane, P.E. and Jon Weathersbee, P.E., of
NCDOT. They provided a blank NCDOT spreadsheet to calculate costs by line item
(with 2006 materials prices) and the cost estimate spreadsheet for Alternate F1 of the
I-26/I-40/I-240 interchange reconstruction project (Transportation Improvement Program
(TIP) Project No. I-2513C) in Asheville, North Carolina, which is an upcoming
interchange project where a nano-interchange concept could plausibly be considered.
Before estimating earthwork quantities it was necessary to decide where to stop
(earthwork) fill and begin a structure based on cost-effectiveness. A hypothetical
one-lane ramp, climbing from the height of mainline 1 to mainline 3 (without horizontal
curves) at a 4 percent grade was estimated under five different earthwork scenarios:
100% fill without a structure, 80% fill with the top 20% of the roadway on structure, 60%
fill with the top 40% of the roadway on structure, 40% fill with the top 60% of the
roadway on structure, and 20% fill with the top 80% of the roadway on structure.
NCDOT cost estimates for structures range from $120 to $200 per square foot, depending
on height. In this study, bridges of heights less than or equal to 23 feet (Level 2) are
assumed to cost $120 per square foot, bridges between 23 and 60 feet (Level 3) are
assumed to cost $160 per square foot, and bridges at or taller than 60 feet cost $200 per
square foot. Earthwork (for cut/fill) costs $6.00 per cubic yard in this analysis, based on
data from TIP Project No. I-2513C. Total cost as calculated in Table 6 equals roadway
percent of the sum of roadway and structure costs. Table 8 and Figure 26 show the
results of this analysis, and spreadsheets are included in Appendix D.
Table 8 - Cost Estimate Analysis Results
Fill % Roadway Cost Structure Cost E + C Fees (15%) Total Cost
100 $863,000 $0 $129,000 $992,000
80 $529,000 $1,071,000 $240,000 $1,840,000
60 $317,000 $2,106,000 $363,000 $2,786,000
40 $170,000 $3,141,000 $497,000 $3,808,000
20 $88,000 $4,176,000 $640,000 $4,904,000
Figure 26 - Fill/Structure Costs
$0 $1,000,000 $2,000,000 $3,000,000 $4,000,000 $5,000,000 $6,000,000
100 80 60 40 20
Percent Roadway Fill
Cost
(USD)
Roadway Cost Structure Cost Engineering-Contingency Fee (15%)
As shown in Table 8, since earthwork (fill) is a much lower cost than using a structure for
these fairly typical conditions, the designs for interchanges in this study primarily use fill
rather than structure, in an attempt to minimize cost. In particular, any point on level 3 or
below not directly over another roadway was placed on fill. However, there is also a
tradeoff between cost and right-of-way when using earthwork since fill requires
sideslopes, and bridges do not. Bridging roadways decreases their footprint but greatly
certain situations (for example, to avoid environmental features) despite the higher cost.
Ideal conditions (for example, no environmental impacts) are assumed in this study,
though rarely experienced in actual design and construction, to simplify and equalize
conditions for all nine interchanges. Chapter 4 includes a summary of the cost estimates
for each of the reverse and parallel nano-interchanges and the all-directional four-level
interchanges, plus a discussion of the major differences in costs.
RIGHT OF WAY ESTIMATE METHODOLOGY
The right of way limit in these designs is considered to be the line at which the 2:1
slopestake gradient reaches level ground (an elevation of zero feet). Departments of
Transportation or other governing authorities may consider the right of way line to extend
past the slopestake line to account for utilities, sidewalks, or other infrastructure.
However, since the designs presented in this document do not consider those items, the
right of way limit and slopestake lines are synonymous.
Right of way quantities (in acres) reported in Chapter 4 for each interchange are the sum
of sections A – I, as shown in Figures 27 and 28. The purpose of calculating right of
way quantities by summing sections is to allow for easier analysis of hypothetical
situations. For example, if it is important to minimize the amount of required right of
way in quadrant II (section E), the designer could use a retaining wall instead of filling
the shoulder to the slopestake limit in the reverse nano-interchange. The resulting right
of way quantity could be summed by adding A through I, excluding E (since it would