Genzer).
by Preeta Datta
A dissertation submitted to the Graduate Faculty of North Carolina State University
in partial fulfillment of the requirements for the degree of
Doctor of Philosophy
Chemical Engineering
Raleigh, North Carolina 2015
APPROVED BY:
______________________________ ____________________________ Kirill Efimenko Orlando Rojas
______________________________ ____________________________
Michael Dickey Orlin Velev
___________________________ Jan Genzer
BIOGRAPHY
ACKNOWLEDGMENTS
I am at a loss of words to thank my advisor, Dr. Jan Genzer, for his excellent supervision and guidance during the course of my doctoral research. He’s always been there with his cheerful demeanor and immense patience, motivating me to work even in the most disappointing situations. I think I cannot ask for a better advisor than him and working for him to be one of the best decisions I took in my life. In fact, a part of me doesn’t want to leave.
I also acknowledge Dr. Efimenko; his practical and very critical approach towards research and problem solving helped me keep on track. Thank you Drs. Dickey, Velev, Khan, Henderson and Rojas for letting me use your lab facilities and suggestions.
This thesis would not have been possible without a few individuals, namely Rohan, Phil and Dr. Genzer. They have painstakingly taken time away from their busy schedules to proof-read this thesis at a very short notice. Thanks to Matt and Gilbert for their valuable suggestions. I am grateful to the past Genzer group members – Erich, Casey and Julie, for being the go-to people in my early years in the group. The current Genzer group members and visitors, including Steven, Sean, Duncan, Ying and Stephie, are not only excellent coworkers but great company too. Special mention for Edwin for patiently listening to research-related woes. Thanks to Rich Lamy of Burlington Precision Instruments, Elaine Zhou of AIF and our own, Ms. Sandra Bailey, for their resourcefulness. Overall, my stay at NCState has been wonderful, thanks to the amazing people in the department.
Thank you Vivek for your care and support during the first few years of my academic journey. I am lucky to have made a few friends who made my stay in Raleigh so enjoyable.
I am grateful to a couple of my school teachers and college professors who encouraged me at an impressionable age. I have to mention my aunt and my father, who weren’t directly involved in my Ph.D. She made my young mind curious about science and he encouraged my younger self to dare.
TABLE OF CONTENTS
LIST OF TABLES...viii
LIST OF FIGURES...ix
1. Polymerization under Confinement………... 1
1.1 Introduction………..…. 2
1.2 Thermal Frontal Polymerization..……….. 4
1.3 Template polymerization using “grafting through” approach………... 6
1.4 References………..………... 6
2. Effect of confinement on thermal frontal polymerization……… 9
2.1 Introduction………..………....10
2.2 Experimental Details………..………. 11
2.3 Results & Discussions………..………... 13
2.4 Conclusions……..………... 17
2.5 Acknowledgements…..………... 17
2.6 Appendix..………... 18
2.7 References………..………. 22
3. Controlling Polydispersity in Free Radical Polymerization systems……… 24
3.1 Introduction………..………... 27
3.2 Molecular Weight Distribution of the polymer..……….. 31
3.3 Understanding the front zones…..………... 32
3.4 The role of convection………..………... 33
3.5 Role of ‘gelation’ – choice of solvent………. 36
3.6 Directional heat supply……..……….. 39
3.7 Bimodal nature of the molecular weight distribution…..………. 43
3.8 Discussion……..………. 47
3.9 References……..………. 48
4. Computer Simulation of Template Polymerization using a Controlled Reaction Scheme……… 51
4.1 Introduction…..………... 51
4.2 Simulation Model………..………... 54
4.3 Results and Discussion………..……….. 57
4.4 Conclusions………..………... 70
4.5 Acknowledgements…………..………... 71
4.6 Appendix………..………... 73
5. “Grafting Through” Polymerization using surface-bound monomers………. 78
5.1 Computer Simulation………..………. 80
5.1.1 Set-up and Method………..80
5.1.2 Results and Discussion………. 83
5.2 Experimental Set-up………..….. 92
5.2.1 General Methods and Materials……….. 92
5.2.2 Sample Preparation………... 92
5.2.2.1 Methacrylate Silane deposition and modification……… 92
5.2.2.2 Polymerization of surface-bound monomers………... 93
5.2.3 Results and Discussion……….. 93
5.3 Conclusions..………... 96
5.4 Appendix……..………... 98
5.5 References………..………... 101
6. Outlook………. 104
6.1 Confined Frontal Polymerization as a means to synthesize low PDI polymers…...… 105
6.2 Confined Frontal Polymerization as a separation method to study reaction kinetics.. 106
LIST OF TABLES
LIST OF FIGURES
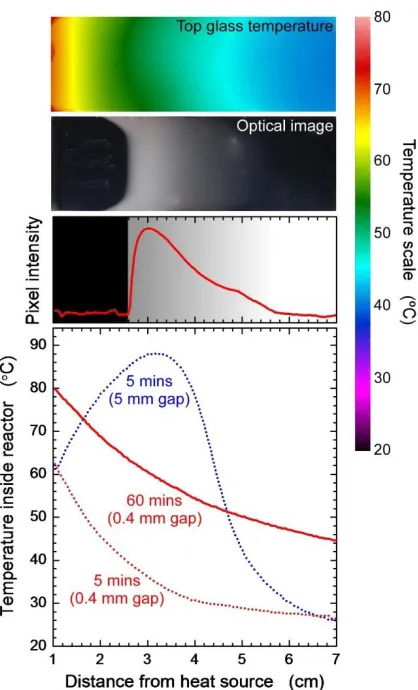
Figure 1.1. The different confinement scenarios in radical polymerization………... 4 Figure 2.1. Schematic diagram of the positive feedback mechanism in a frontal polymerization system……….. 11 Figure 2.2. IR image of top glass surface, snapshot of front, pixel intensity of optical image and temperature inside reactor (top to bottom)……… 12 Figure 2.3. Optimal images of the front (top view) corresponding to different degrees of confinement, at different time intervals after initiation……… 13 Figure 2.4. Front position at different time intervals after initiation (inset: front velocity as a function of vertical confinement)………. 15 Figure 2.5. Normalized molecular weight distribution (log base 10) corresponding to different degrees of confinement……… 15 Figure A2.1. a) DSC trace of potassium persulfate at 5°C heating rate. b) Linear portion of Arrhenius plot derived from DSC trace in Figure 2.1a………... 20
Figure A2.2. (top) Molecular weight distribution of polymer at different distances from the heat source at the end of consecutive runs. (bottom) Variation of overall average molecular weight of the polymer with time after initiation for channel height of 0.4 mm………... 21 Figure 3.1. Degree of polymerization distribution (analogous to molecular weight distribution) for polymer samples taken after 60 mins of ignition at varying distances away from heat source (shown in different colors in the legend) corresponding to different reactor heights (or gaps)……… 28 Figure 3.2. Variation of polydispersity index (PDI) of polymer samples with distance from heat source and reactor height (shown as y-axis) 60 mins after ignition………. 31 Figure 3.3. Kinetic data on Mn (left) and PDI (right) for samples located at different distances
Figure 3.5. Time evolution of the fronts corresponding to different degrees of vertical confinement. The inset shows the cross-section of the front manifesting convection, note the distinct layering………... 34 Figure 3.6. Comparison of the temperature (left ordinate, red lines) and the initiator half-life (right ordinate, green lines) profiles corresponding to 0.4 mm (heavily suppressed convection) and 2 mm (with convection) vertical confinement for various reaction times ranging from 10 to 60 mins……… 35 Figure 3.7. Comparison of front profiles of a 0.4 mm thick horizontal setup and one that is inclined horizontally at 10 degrees (top views)……… 36 Figure 3.8. Motion of suspended particles (shown in black) inside the reaction chamber of height 2 mm (left) and 0.4 mm (right), demonstrating the presence of convection. The red and green arrows mark the initial and the final positions of the particles respectively (from top to bottom)……… 37 Figure 3.9. Storage (E’) and loss (E”) moduli as a function of angular frequency, measured at constant strain of 0.01, for 0.4 mm thick polyacrylamide film in air (solid) and soaked in DMSO (dashed)………... 38 Figure 3.10. Effect of dilution on Mn and PDI for different reactor heights. For very dilute
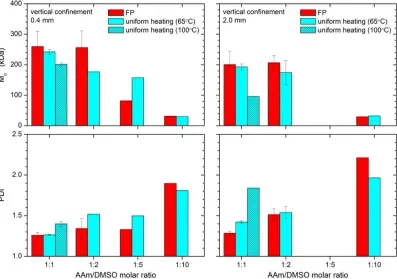
systems, the front did not propagate……… 39 Figure 3.11. Comparison of Mn and PDI of polymers grown via frontal polymerization and
uniform heating at different degrees of dilution. Note that for dilute systems (1:5 and 1:10), the front did not propagate (cf. Figure 3.9)……….. 41 Figure 3.12. Comparison of Mn and PDI of polymers grown via uniform heating with glass
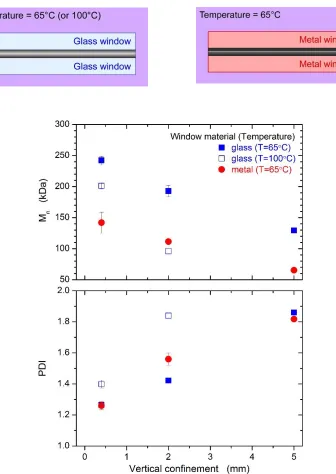
and metal windows (bottom) and schematic diagram of the reactor with different windows (top)………. 42 Figure 3.13. A typical example of peak resolution of degree of polymerization distribution of a polymer sample………. 44 Figure 3.14. Detailed analysis of molecular weight distribution using peak fitting for polymer samples at different distances from heat source corresponding to different reactor heights (along each column). The top row compares the experimental and fitted PDI values. Peak 1 (red) and 2 (blue) correspond to the two weighted Schulz-Zimm peaks fitted to the bimodal distribution. The middle row shows the PDIs and number average degree of polymerization (analogous to Mn) for the fitted peaks. The bottom row shows the weights of the two peaks
Figure 3.15. DSC curve showing exothermic peak for mixture of acrylamide and potassium persulfate in DMSO………... 46 Figure 4.1. a) Rod-like substrates (black) with grafted bound monomers (magenta), (b) Ring-like substrates (black) with grafted monomers (magenta), (c) copolymers formed by combination of free monomers (green) and bound monomers (magenta) – high grafting density of monomers, (d) copolymers with bound “unimers” – low grafting density of monomers on substrate………... 57 Figure 4.2. Comparison of the number and sequence length distributions of B bound monomers in A-B copolymers for different number of initiators ([I] = 12 and 125) and free monomers ([A] = 3125 and 6250) for rod-like substrates……… 59 Figure 4.3. Comparison of the number distribution of B in A-B copolymers, averaged over 10 simulation runs, for different grafting densities on rod-like substrates (σB)………..….. 60
Figure 4.4. Effect of the number of initiators ([I]) and the number of bound B monomers ([B]) on the number distribution and sequence length distribution of B in copolymers A-B…...………... 62 Figure 4.5. Distributions of “mers” in A-B copolymers for [I] = 125, [B] = 64, [A] = 6250 and σ = 1. Unimers to octamers are observed to be formed under these conditions (the red lines demarcate the different substrates)……….. 63 Figure 4.6. Effect of flexibility of the bound B monomers on the number distribution and sequence length distribution of B in A-B copolymers, for [I] = 12 and 125……… 64 Figure 4.7. The average number of A polymers and B copolymers as well as the average A-B composition as a function of the grafting density of the A-B monomers (σB) in fixed (left
column) and flexible (right column) conformations……… 66 Figure 4.8. Comparison of the number distribution of B monomers in A-B copolymers for rod and ring-like substrates……… 68 Figure 4.9. Effect of the orientation of the bound B monomer on their number distribution in A-B copolymers, for [I] = 12, [A] = 3125 and σB = 0.47 (blue), 0.43 (red)………. 70
Figure 5.1. The cubic lattice for simulation – the dimensions of the box are changed to vary the bund B monomer packing density (σB), keeping the volume constant. The blue motifs
denote the monomers bound to the substrate……… 81 Figure 5.2. Comparison of the number distribution of B in A-B copolymers, averaged over 50 simulation runs, for different grafting densities on planar substrates (B) at two different
initiator concentrations ([I] = 12, 125)………. 84 Figure 5.3. Effect of the monomer packing density (σB) on the sequence length distribution of
B in copolymers A-B………... 86 Figure 5.4. Snapshots from a typical simulation run showing the self-limiting nature of the grafting of polymer chains to the substrate……….. 87 Figure 5.5. Distributions of “loops” and “trains” in A-B copolymers for σ = 0.18 and 1 (top and bottom respectively) at different monomer conversions (X)………. 88 Figure 5.6. Effect of the monomer packing density (σB) and number of initiators ([I]) on the
sequence length distribution of B in copolymers A-B………. 89 Figure 5.7. The average number of A polymers and B copolymers as well as the average A-B composition as a function of the grafting density of the A-B monomers (B) for [I] = 12 and [I]
=125……… 91 Figure 5.8. Top, left (a) Cartoon depicting the experimental procedure, (b) ellipsometry dry thickness measurements, (c) Br content estimated from XPS measurements, (d)-(f): TOF-SIMS fragments as a function of fractional coverage by MPS……….…... 96
1.1 Introduction
acrylate polymerization become appreciable resulting in equilibrium polymerization at high temperature. For polymer synthesized in nanoconfined environment, the negative change in entropy upon propagation results in a decrease in equilibrium conversion and a shift of the ceiling temperature to lower temperatures.
The dimensionality of confinement is another aspect that plays a crucial role. The confinement encompasses the broad range from free polymer chains in a good solvent to surface-grafted polymer brushes. The dimensionality and degree of confinement can affect chain mobility and thereby affect propagation and termination rates. Often, the two aspects of confinement, dimensionality and degree, can act in conjunction to affect polymer molecular weight and in some cases also morphology (vide infra). Surface-initiated polymerization is a good example of such extreme confinement [7-15], wherein a loss of translational entropy of the growing chains affects their structure and conformation. The grafted polymers adopt a so-called “mushroom” conformation if the distance between neighboring chains is greater than the radius of gyration of the chain (Rg). When the average distance between two neighboring
chains is less than Rg, the macromolecular grafts enter the so-called “brush” conformation, in
which steric effects due to neighboring chains cause the polymers to stretch perpendicularly to the surface. In this analogy, dimensionality and degree of confinement is imposed by the high grafting density, forcing the chains to grow preferentially in one direction. The conformations of polymer brushes on surfaces are governed by a complex interaction between molecular weight, grafting density, solvent quality, and the curvature of the substrate. The interplay among the microscopic properties of polymer brushes, such as, the molecular weight, the grafting density, the chemical composition of the grafts as well as the sequence distribution of the chemical units along the grafted chain, influences the macroscopic behavior of surface-grafted polymers (i.e., wettability, lubricity, modulus, response to stimulus).
situations. Yet these two situations are intermediate with respect to confinement, as compared to the two extreme cases, i.e., bulk polymerization and polymerization following the “grafting from” protocol. In free radical polymerization, bimolecular termination cannot be avoided, unless under “controlled” conditions. Compared to other controlled/“living” polymerization methods, radical-based polymerization reactions have several advantages, especially in terms of compatibility with both aqueous and organic media as well as a high tolerance toward a wide range of functional groups. This work demonstrates that it is possible to achieve better control on radical polymerization products by tuning the reaction environment. The following sections serve an introduction to the two different modes of polymerization explored in this Thesis.
Figure 1.1. The different confinement scenarios in radical polymerization.
1.2 Thermal Frontal Polymerization
1.3 Template polymerization using “grafting through” approach
“Grafting through” polymerization is based on a bulk radical polymerization reaction utilizing a self-assembled monolayer that contain polymerizable units [21-25]. Free polymer chains formed in solution can incorporate the surface-bound monomers, and thereby, get covalently bonded to the surface. As more growing chains attach to the surface-bound monomers, an immobilized polymer layer is formed on the surface. The proximity of the surface-bound polymerizable units promotes the “grafting through'' process but prevents more free growing chains to “graft to” the polymerizable units. This is the first study that uses a combination of Monte Carlo simulation and surface-sensitive characterization tools to demonstrate that the packing density of the template (that brings these counter-active effects into play) and the dimensionality of the template are key factors that control the structure and sequence distribution in surface-tethered growing polymer chains. Chapter 4 reports on understanding the effect of monomer packing density and the effect of substrate shape on the nature of the polymer chains in case of one dimensional substrates such as rods and nano-wires. Chapter 5 extends the previous study to two dimensional substrates and provides experimental validation of the simulation results.
1.4 References
1. P. G. De Gennes, “Scaling Theory of Polymer Adsorption”, J. Phys., 1976, 37, 1445– 1452.
2. S. Alexander, “Polymer Adsorption On Small Spheres: A Scaling Approach”, J. Phys., 1977, 38, 977–981.
4. F. Begum, H. Y. Zhao, and S. L. Simon, "Modeling Methyl Methacrylate Free Radical Polymerization: Reaction in Hydrophobic Nanopores", Polymer, 2012, 53(15), 3261 – 3268.
5. F. Begum, H. Y. Zhao, and S. L. Simon, "Modeling Methyl Methacrylate Free Radical Polymerization: Reaction in Hydrophilic Nanopores," Polymer, 2012, 53(15), 3238 – 3244.
6. F. Begum and S. L. Simon, "Modeling Methyl Methacrylate Free Radical Polymerization in Nanoporous Confinement," Polymer, 2001, 52, 1539 – 1545.
7. S. T. Milner, “Polymer Brushes”, Science, 1991, 251, 905–914.
8. B. Zhao and W. J. Brittain, “Polymer Brushes : Surface-Immobilized Macromolecules”, Prog. Polym. Sci., 2000, 25, 677–710.
9. I. Luzinov, S. Minko and V. V. Tsukruk, “Adaptive and Responsive Surfaces through Controlled Reorganization of Interfacial Polymer Layers”, Prog. Polym. Sci., 2004, 29, 635–698.
10. P. Uhlmann, H. Merlitz, J. Sommer and M. Stamm, “Polymer Brushes for Surface Tuning”, Macromol. Rapid Commun., 2009, 30, 732–740.
11. M. A. Cohen Stuart, W. T. S. Huck, J. Genzer, M. Müller, C. Ober, M. Stamm, G. B. Sukhorukov, I. Szleifer, V. V. Tsukruk, M. Urban, et al., “Emerging Applications of Stimuli-Responsive Polymer Materials”, Nat. Mater., 2010, 9, 101–113.
12. E.D. Bain, S. Turgman-Cohen, J. Genzer, “Computer simulation approaches for polymerization in grafted systems”, Macromol. Theory & Simul,. 2013, 22, 8.
13. E.D. Bain, K. Dawes, A.E. Özçam, X. Hu, C.B. Gorman, J. Šrogl, J. Genzer, ”Surface-initiated polymerization by means of novel, stable, non-ester-based radical initiator”, Macromolecules, 2012, 45, 3802.
15. S. Turgman-Cohen, J. Genzer, “Computer simulation of concurrent bulk- and surface-initiated living polymerization”, Macromolecules, 2012, 45, 2128.
16. J. Pojman, D. Fortenberry, V. Ilyashenko, “Frontal Polymerization as an Analog of SHS”, Int. J. Self-Propag. High-Temp. Synth.,1997, 6, 355-376.
17. R.P. Washington, O. Steinbock, “Frontal Polymerization Synthesis of Temperature-Sensitive Hydrogels”, J. Am. Chem. Soc., 2001, 123, 7933-7934.
18. J.A. Pojman, “Frontal Polymerization”, in Encyclopedia of Polymer Science: A comprehensive reference, (K. Matyjaszewski & M. Möller, Eds.), Amsterdam, 2001, 4, 957-979.
19. B.A. Grzybowski, “Chemistry in motion: Reaction-diffusion systems for micro- and nanotechnology”, John Wiley & Sons, Hoboken, 2009.
20. J.A. Pojman, Q. Tran-Cong-Miyata (Eds), “Nonlinear dynamics with polymers: Fundamentals, methods and applications”, Wiley-VCH, Weinheim, 2010.
21. M. Henze, D. Madge, O. Prucker and J. Rühe, ““Grafting Through”: Mechanistic Aspects of Radical Polymerization Reactions with Surface-Attached Monomers”, Macromolecules, 2014, 47 (22), 2929-2937.
22. S. Polowinski, “Template Polymerization”, ChemTec Publishing, 1997.
23. G. Challa and Y.Y. Tan, “Template Polymerization”, Pure & Applied. Chem., 1981, 53, 647-651.
24. D. M. Rosenbaum and D. R. Liu, “Efficient and Sequence-Specific DNA-Templated Polymerization of Peptide Nucleic Acid Aldehydes”, J. Am. Chem. Soc., 2003, 125 (46), 13924–13925.
2.
Effect of confinement on thermal frontal polymerization
*
2.1 Introduction
Figure 2.1. Schematic diagram of the positive feedback mechanism in a frontal polymerization system.
2.2 Experimental Details
shown in Figure 2.2. An hour after initiation, the assembly is dismantled and the reaction is quenched by immersing the specimens into liquid nitrogen. Samples of the polymerization product are taken at equispaced intervals (1 cm) and characterized using size exclusion chromatography (SEC) in aqueous medium (eluent: 0.1 M sodium nitrate solution). More details pertaining to our experimental set up and analytical methods are provided in Supplementary information.
2.3 Results & Discussion
The propagating wave-front is marked by a characteristic white zone, often accompanied by random protrusions originating ahead of the front. As heat loss takes place primarily from the top and the bottom glass surfaces, the temperature inside the channel should reach a maximum at the center and decrease symmetrically with increasing distance away from the centerline. However, as the channel height decreases, the difference between the glass surface temperature and the centerline temperature decreases, asymptotically approaching zero. This is manifested in Figure 2.3, which shows the top-view of the propagating fronts corresponding to different confinement at specific time intervals- the parabolic profile flattens out with increasing degree of confinement. The non-uniformity of the temperature profile leads to convection heat transfer inside the system and leads to separation of top and bottom layers of the white zone in the less confined systems (>2mm).
The analysis of the front propagation indicates clearly that at initial stages of the reaction the propagation velocity is constant for all confinement conditions. However, the deviation from this behavior is recorded for later stages of the reaction as velocity decreases with increasing confinement, as shown in Figure 2.4. We note that the results present herein are pertinent to the current dimensions of the system we investigated (i.e., 6 cm length scale). That is, we cannot make definite conclusions about what will the behavior be in larger systems. In order to explain this behavior, one needs to carefully investigate the heat propagation/loss patterns in these systems. In “bulk-like” systems convection favors frontal propagation. As the degree of confinement increases the heat convection is suppressed significantly and polymerization reaction is affected predominantly by the heat diffusion along the channel direction, the resulting molecular weight of the polymer decreases with increasing distance from the external heating source (cf. Figure 2.5). The overall molecular weight (averaged over all samples corresponding to same degree of confinement) of the specimens shows an increase in case of confined systems (190 kDa for bulk systems to a maximum of 350 kDa for confined systems) as shown in Table 2.1.
Table 2.1 The average molecular weight of the polymer samples corresponding to different degrees of confinement.
Channel height (mm)
PAAm average molecular weight (kDa)
0.4 322
0.6 276
1.0 231
2.0 272
Figure 2.4. Front position at different time intervals after initiation (inset: front velocity as a function of vertical confinement).
To corroborate our experimental finding that the average molecular weight of the polymerization products increases with increasing vertical confinement of the system, we calculate the average molecular weights using Gillespie’s algorithm [16] (see Supplementary information). We calculate the rate of initiation from the thermal decomposition kinetics of potassium persulfate obtained from DSC studies [17] (see Supplementary information). The rates of propagation and termination of acrylamide polymerization in DMSO are obtained from literature [18,19]. To account for the caging effect of the sulphate radical in an aprotic solvent (DMSO) [20] and the inhibiting effect of hydroquinone, we use an initiation efficiency factor of 0.01 (arbitrarily chosen as a low value due to the presence of the initiator inhibitor; we do not imply that this is the real value for initiator efficiency present in our system). We calculate the average molecular weights of the polymer formed at different distances from the heated end for the two extreme cases: channel heights 0.4 and 5 mm. The average molecular weight for the highly confined system (0.4 mm) is significantly higher (265 kDa) than the one with 5 mm vertical height (129 kDa); whose values are in accordance with our experimental findings (cf. Table 2.1). The molecular weights predicted by the Gillespie’s algorithm are lower than the experimental values, which can be attributed to the fact that Gillespie’s algorithm does not take into account the gelation effect and that our estimate for the initiation efficiency factor may be slightly off. Nevertheless, the trends obtained from the Gillespie’s algorithm are consistent with the experimental observations.
mm). Thus, in highly confined systems a smaller number of radicals are generated, resulting in a smaller number of chains with a higher molecular weight.
2.4 Conclusions
In conclusion, we report on the first study of the effect of vertical confinement on thermal frontal polymerization. By tuning the height of the reactor, convection can be eliminated and the temperature gradients can be controlled. We observe that reducing the reactor height slows down the front propagation and the overall polymerization process, thereby producing polymers with higher molecular weights.
2.5 Acknowledgements
2.6 Appendix
Calculating the rate of initiation using Differential Scanning Calorimetry (DSC)
The thermal decomposition of potassium persulfate leads to formation of free radicals that initiate the polymerization process. The kinetics of the thermal decomposition of the initiator was characterized using differential scanning calorimetry (DSC). The DSC trace of potassium persulfate is shown in Figure A2.1a. The Arrhenius constants for the initiator decomposition were obtained as following. The heat of reaction ∆Htot is evaluated by integrating the dH/dt curve (zeroed to the baseline value) with respect to temperature and dividing by the heating rate (°C/min) [17]. Then the reaction conversion x(T) at each temperature is calculated by integrating the heat evolved up to the temperature of interest (∆Hi) and dividing by the total heat of reaction (∆Htot). The rate constant kd of initiator decomposition, assuming a first order reaction, is given by:
𝑘
𝑑(𝑇) =
Δ𝐻Δ𝑇
1
Δ𝐻𝑡𝑜𝑡(1−𝑥(𝑇)) (A2.1)
In order to calculate kd values for each temperature, we generate an Arrhenius plot in the form of ln kd vs. 1/T(K). The linear portion of the plot, typically the values between 1% and 50% of initiator conversion, is fitted to a line, and the slope and intercept of the best-fitting line are used to determine the activation energy and the pre-exponential factor, respectively. Figure 2.6.A1.b shows the Arrhenius plot derived from the DSC trace for potassium persulfate. The activation energy was determined to be 134 kJ/mol, and the pre-exponential factor 1018 s-1.
Theoretical Molecular Weight calculations using Gillespie’s Stochastic Simulation Algorithm (GSSA)
chains. The program calculates bulk rate constants at the reaction temperature according to the kinetic equations for acrylamide polymerization in DMSO reported in literature [18-20]. We keep count of the number of polymers generated, the average molecular weight, the number of monomers, the number of initiators and the monomer concentration in each bin after each discrete time interval. Since the radicals are short-lived, we rightly assume that the polymer chains generated in each time interval are dead at the end of the simulation run. The unconverted monomer and initiator concentrations at the end of each run serves as the input parameters for the simulation for the next time interval. At the end of the entire simulation run, we calculate the weighted average molecular weight in each bin by summing over all the discrete time intervals. The overall molecular weight of the polymer product is then calculated by summing over all the bins with appropriate weightage.
The molecular weight distributions corresponding to different distances from heating source and the overall average molecular weight of the polymerization products calculated at the end of the consecutive runs corresponding to a channel height of 0.4 mm are shown in Figure A2.2.
2.7 References
1. J. Pojman, D. Fortenberry and V. Ilyashenko, "Frontal Polymerization as an Analog of SHS," Int. J. Self-Propag. High-Temp. Synth. 1997, 6, 355-376.
2. R. P. Washington and O. Steinbock, "Frontal Polymerization Synthesis of Temperature-Sensitive Hydrogels," J. Am. Chem. Soc. 2001, 123, 7933-7934.
3. J. A. Pojman, "Traveling Fronts of Methacrylic Acid Polymerization," J. Am. Chem. Soc., 1991, 113, 6284-6286.
4. P. M. Goldfeder, V. A. Volpert, V. M. Ilyashenko, A. M. Khan, J. A. Pojman, and S. E. Solovyov, "Mathematical Modeling of Free-Radical Polymerization Fronts," J. Phys. Chem. B 1997, 101, 3474-3482.
5. J. A Pojman, J. Willis, D. Fortenberry, V. Ilyashenko and A. Khan, "Factors Affecting Propagating Fronts of Addition Polymerization: Velocity, Front Curvature, Temperature Profile, Conversion and Molecular Weight Distribution," J. Polym. Sci. Part A: Polym Chem. 1995, 33, 643-652.
6. Pojman, J. A.; Masere, J.; Petretto, E.; Rustici, M.; Huh, D.-S.; Kim, M. S.; Volpert, V. "The Effect of Reactor Geometry on Frontal Polymerization Spin Modes," Chaos 2002, 12, 56-65.
7. M. Bazile Jr., H. A. Nichols, J. A. Pojman, and V. Volpert, "The Effect of Orientation on Thermoset Frontal Polymerization”, J. Polym. Sci. Part A: Polym Chem. 2002, 40, 3504-3508.
8. V. A. Volpert, V. A. Volpert and J. A. Pojman, “Effect of Thermal Expansion on Stability of Reaction Front Propagation”, Chem. Eng. Sci. 1994, 14, 2385-2388.
10. J. A. Pojman, R. Craven, A. Khan and W. West, "Convective Instabilities Induced by Traveling Fronts of Addition Polymerization”, J. Phys. Chem., 1992, 96, 7466-7472. 11. J. A. Pojman, V. M. Ilyashenko and A. M. Khan, "Spin Mode Instabilities in
Propagating Fronts of Polymerization," Physica D 1995, 84, 260-268.
12. B. McCaughey, J. A. Pojman, C. Simmons and V. A. Volpert, "The Effect of Convection on a Propagating Front with a Liquid Product: Comparison of Theory and Experiments," Chaos 1998, 8, 520-529.
13. G. Bowden, M. Garbey, V. M. Ilyashenko, J. A. Pojman, S. Solovyov, A. Taik and V. Volpert, "The Effect of Convection on a Propagating Front with a Solid Product: Comparison of Theory and Experiments", J. Phys. Chem. B 1997, 101, 678-686.
14. J. A. Pojman, V. M. Ilyashenko and A. M. Khan, "Free-Radical Frontal Polymerization: Self-Propagating Thermal Reaction Waves," J. Chem. Soc. Faraday Trans. 1996, 92, 2824-2836.
15. J. A. Pojman, G. Curtis and V. M. Ilyashenko, "Frontal Polymerization in Solution," J. Am. Chem. Soc. 1996, 115, 3783-3784.
16. E. D. Bain, K. Dawes, A. E. Özçam, X. Hu, C. C. Gorman, J. Šrogl, and J. Genzer, “Surface-Initiated Polymerization by Means of Novel, Stable, Non-Ester-Based Radical Initiator”, Macromolecules 2012, 45, 3802-3815.
17. J. C. M. Torfs, L. Deij, A. J. Dorrepaal and J. C. Heijins, “Determination of Arrhenius kinetic constants by differential scanning calorimetry”, Analytical Chemistry 1984, 56, 2863-2867.
18. V. F. Gromov, N. I. Galperina, T. I. Osmanov, P. M. Khomikovskii and A. D. Abkin, “Effect of Solvent on Chain Propagation and Termination Reaction Rates in Radical Polymerization”, European Polymer Journal 1980, 16, 529-535.
19. V. F. Kurenkov and L. I. Abramova, “Homogeneous Polymerization of Acrylamide in Solutions”, Polym.-Plast. Technol. Eng. 1992, 31, 659-704.
3.1 Introduction
One of the major challenges in polymer synthesis is the control of molecular weight distribution (MWD) of the produced polymers. The polydispersity index (PDI) is a statistical measure of the dispersion of a MWD, given by the ratio of the second to the first moment of the MWD. In the case of polymers, the first and second moments are given by the weight average (Mw) and number average (Mn) molecular weights, respectively. Conventional free
radical polymerizations (FRPs) generate polymers with a broad distributions of molecular weights (MW). Theoretically, the lower limit on PDI for a FRP process is 1.5, imposed by the mode of chain termination. In principle, fairly monodisperse polymers can be obtained by free radical polymerization if the process proceeds via a “living” mechanism wherein all the growing chains are initiated at approximately the same time and termination of the propagating chains is heavily suppressed [1]. In the past, researchers have shown that polymerization in microreactors (e.g., porous substrates) produces polymers with narrower MW distributions (or low PDI values) relative to bulk reaction [2]. Onset of gelation during synthesis also narrows down the MWD of polymers due to decreased mobility of the growing chains thus minimizing the likelihood of termination. This is the first study that demonstrates that fairly monodisperse polymers can be produced via FRP without addition of any stable free radicals (e.g., nitroxides, as in nitroxide-mediated polymerization) or ligands (e.g., Cu-salts and metal organic ligands, as in atom transfer radical polymerization).
tube and cube with a characteristic spacing h) scales as MW1/3 and h2. For FRPs, significant increases in MW and decreases in PDI are generally observed. For example, Aida and coworkers reported that relative to bulk polymerization Mn increased from 40 to 400 kDa
for polymerization of methyl methacrylate (MMA) in the 2.7 nm diameter pores of zeolite MCM-41 and PDI decreased from 2.8 to 1.7, respectively. The zeolite did not serve any apparent catalytic role; it was only used to generate nano-confinement, in which the polymerization took place. Similar results were obtained for PMMA synthesized in confined pore glass having 4.4 ~ 5 nm pores sizes [2], and for various other vinyl-based polymers formed in nano-channels of porous coordination polymers (PCPs), mesoporous silica whose walls were decorated with immobilized radical initiators, or in microreactors. In addition to changes in MW and PDI, variations in tacticity have been observed for FRP of styrene, MMA, and vinyl acetate (VA) and a decrease in branching of PVA has also been noted. Because the spatial dimensions of the pores are comparable to the sizes of the polymer segments, distribution of heterogeneities in segmental motion exists, wherein less mobile segments reside close to the wall of the pore. Polymer/wall interactions affect not only the local segmental dynamics but also the overall chain locomotion inside the confining cavity, as reported by Zhao & Simon [2]. As the overall diffusion of polymer chains slows down, monomer diffusion drives the polymerization kinetics and auto-acceleration due to gel effect sets in at a relatively early stage of FRP in nanoscale confinement, which ultimately governs the polymerization kinetics. As a result of slow polymer motion inside confined space, the rate of chain termination decreases dramatically, which results in polymers with high MW and PDI1.5. In bulk polymerizations, as the viscosity increases, the gel effect comes into play causing auto
acceleration by decreasing the rate of termination. In case of monomers, such as methyl
methacrylate or acrylamide, the gel effect influences the overall polymerization kinetics. The
This chapter illustrates how thermal frontal polymerization reaction in vertically-confined reactors (height ~ hundreds of m to a few mm) can create fairly monodisperse polymers free-radically. The combination of all three effects, i.e., confinement, gelation, and front propagation in FRP leads to high MW polymers with relatively low molecular weight PDI (PDI ~1.2). This chapter elaborates on the effect of spatial confinement on convective instabilities and subsequently, the propagation dynamics and nature of polymerization products in horizontal fronts. In bulk or unconfined systems, the sharper temperature gradients and convection cause the reaction front to deform and move faster, resulting in rapid polymerization and non-uniform distribution of polymer chains. Under confinement, temperature gradients are suppressed and in the absence of convection, the polymerization front is well-defined. As a result, the initiation and propagation steps are slower and longer polymer chains with lower polydispersity are formed.
3.2 Molecular weight distribution of the polymer
As in the previous chapter on frontal polymerization (i.e., Chapter 2 in this Ph.D. Thesis), the PDIs of the polymerization products were calculated using Gillespie’s algorithm in order to corroborate experimental findings. The calculated PDI values for highly confined systems (1.75 for 0.4 mm vertical height) are significantly lower than those corresponding to bulk-like or unconfined systems (1.98 for 5 mm). However, the PDIs calculated using Gillespie’s algorithm are greater than the corresponding experimental values for both the bulk-like (5 mm vertical height) and the highly confined system (0.4 mm vertical height). This can be attributed to the fact that Gillespie’s algorithm does not account for the gel effect which can reduce chain termination significantly in acrylamide/DMSO systems and thus produce chains with high MW and relatively low PDI.
Figure 3.2 shows the dependence of PDI of the samples taken from different positions away from heat source, polymerized under different degrees of confinement. Polymerization products of higher Mn (as noted in Chapter 2) and lower PDI are produced under greater degree
of vertical confinement. At larger distances from the heat source, the polymer produced is comparatively less polydisperse. This can be attributed to a slow front propagation velocity and the suppression of convection in vertically confined systems. In order to better understand frontal polymerization in confined geometries, the molecular weight distributions of the products from particular locations in 0.4 mm high reactor were monitored over 60 min in intervals of 10 min (cf. Figure 3.3). It is to be noted that such measurements involved individual reactions quenched at different time periods after ignition. The kinetic data reveal that at any given location (along each column, cf. Figure 3.3), the polymer MW increases with increasing time while the PDI decreases. This indicates accelerated chain initiation and suppressed chain termination, or in other words, the presence of gelation.
Figure 3.2. Variation of polydispersity index (PDI) of polymer samples with distance from heat source and reactor height (shown as y-axis) 60 mins after ignition.
Figure 3.3 Kinetic data on Mn (left) and PDI (right) for samples located at different distances
3.3 Understanding the front zones
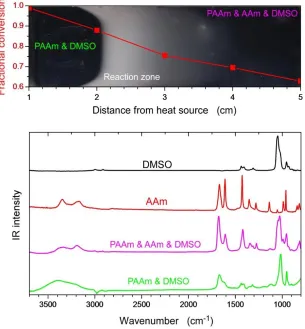
Figure 3.4. The different reaction zones in frontal polymerization (on a dark background) with the respective monomer conversions (top); IR spectra of DMSO, acrylamide (AAm) and the samples from the different zones.
3.4 The role of convection
Figure 3.5. Time evolution of the fronts corresponding to different degrees of vertical confinement. The inset shows the cross-section of the front manifesting convection, note the distinct layering.
Figure 3.6. Comparison of the temperature (left ordinate, red lines) and the initiator half-life (right ordinate, green lines) profiles corresponding to 0.4 mm (heavily suppressed convection) and 2 mm (with convection) vertical confinement for various reaction times ranging from 10 to 60 mins.
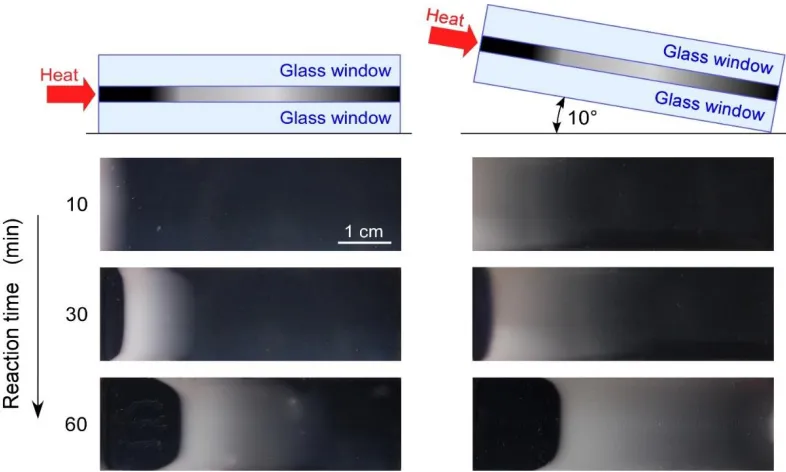
significant difference in front profile nature or time evolution caused by changing system inclination. Further, the presence of convection currents in reactors was tested with suspended particles (cf. Figure 3.8). The particles do not demonstrate any visible displacement in a highly confined reactor (i.e., 0.4 mm, on the right) while they move around in less confined geometries (i.e., 2 mm, on the left). In the light of these evidences, it is concluded that convection is heavily suppressed under vertical confinement on the order of 0.1 mm.
Figure 3.7. Comparison of front profiles of a 0.4 mm thick horizontal setup and one that is inclined horizontally at 10 degrees (top views).
3.5 The role of ‘gelation’ – choice of solvent
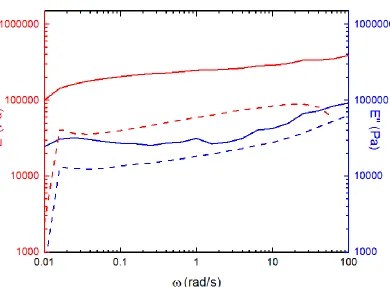
crosslinking (or entanglements). Chemical crosslinking is not possible due to the inherent lack of bifunctionality in the chemical structure of acrylamide monomer. Imidization of acrylamide can lead to a crosslinked product; however, this occurs in trace amounts (< 6%) and does not take place in presence of inert fillers such as barium carbonate or polyacrylamide [Ref. Pojman chapter]. Samples of the formed polymer are subject to modulus measurement at a constant strain of 1%, in air and soaked in DMSO. These polymer samples were collected from a 0.4 mm high reactor at the end of 60 mins and had residual DMSO trapped in them. The storage and loss moduli changes proportionately with frequency, indicating that the polymer is indeed forming a physical gel in presence of trapped DMSO (cf. Figure 3.9). The relatively low values value of the moduli over low values of angular frequency suggests that the gel is a weak one. The overall lower values of moduli measured for samples measured in DMSO implies that the excess solvent can swell the gel and weaken it.
Figure 3.9. Storage (E’) and loss (E”) moduli as a function of angular frequency, measured at constant strain of 0.01, for 0.4 mm thick polyacrylamide film in air (solid) and soaked in DMSO (dashed).
most of the exothermic heat generated goes into initiating more radicals, leading to a self-sustaining reaction front. Hence, by suitable choice of monomer/solvent systems, the gel effect can be utilized to lower chain termination rates leading to better control on polymer MW distribution.
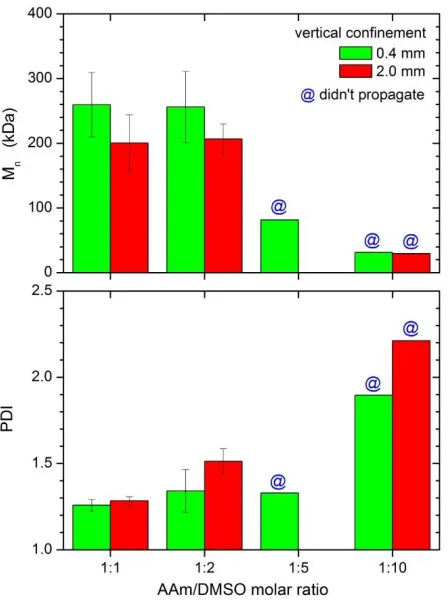
Figure 3.10. Effect of dilution on Mn and PDI for different reactor heights. For very dilute
systems, the front did not propagate.
3.6 Directional heat supply
Figure 3.11. Comparison of Mn and PDI of polymers grown via frontal polymerization and
Figure 3.12. Comparison of Mn and PDI of polymers grown via uniform heating with glass
3.7 Bimodal nature of the molecular weight distribution
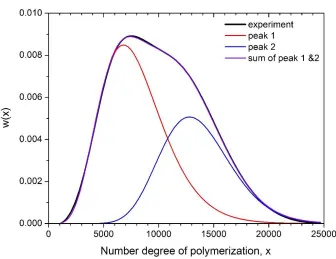
The MW of a polymer sample from frontal polymerization set-up depends on the height of the reactor and its position relative to the heat source. However, the MW distribution of a given polymer sample is not unimodal. It was possible to fit two distinct Schulz-Zimm distributions to a given MW distribution. The relative contributions and parameters of individual peaks are determined by minimizing the sum of least square deviations (cf. Figure 3.13). Extensive data fitting using this approach reveals that the ratio of the Mn corresponding
the higher degree of polymerization peak (peak 2 – blue) corresponds to the monomer-enhanced mode and the lower peak (peak 1 – red) arises from thermally activated initiators (cf. Figure 3.14). Irrespective of the distance from heat source or the reactor height, the lower Mn
fraction (peak 1) dominates. Since the frontal propagation is driven by heat, it is not surprising that the thermally initiated mode of polymerization contributing to low MW polymers is dominating. Heat transport in highly confined reactors is driven by conduction and diffusion, so the temperature decreases at larger distances from the heat source (cf. Figure 3.6). This means a smaller number of thermally initiated radicals are generated and the polymer chains can achieve greater degree of polymerization at distances away from the heat source (cf. Figure 3.14).
Figure 3.14. Detailed analysis of molecular weight distribution using peak fitting for polymer samples at different distances from heat source corresponding to different reactor heights (along each column). The top row compares the experimental and fitted PDI values. Peak 1 (red) and 2 (blue) correspond to the two weighted Schulz-Zimm peaks fitted to the bimodal distribution. The middle row shows the PDIs and number average degree of polymerization (analogous to Mn) for the fitted peaks. The bottom row shows the weights of the two peaks
It is to be noted that the PDI corresponding to each fitted peak is quite low as in the overall MW distribution. This proves that the PDIs lower than the theoretical limit of 1.5 are not the outcome of an erroneous statistical calculation. The narrow polydispersity range of each polymer population can be attributed to a combination of favorable factors: vertical confinement of the reactor, solvent-induced gelation and directional heat supply.
3.8 Discussion
In conclusion, this chapter reported on controlling polydispersity in free radical polymerization reactions by inducing gelation, tuning the degree of vertical confinement and supplying heat in a directional manner via frontal polymerization. By reducing the height of the reactor, we can suppress convective instabilities and achieve a better control on the frontal polymerization process. Under confinement, the front propagation and the overall polymerization process are slowed down, thereby producing longer and more uniform polymer chains relative to bulk polymerization under identical reaction conditions. The results also suggest that the possibility of monitoring simultaneous reactions that are otherwise impossible to decouple, using frontal polymerization set-up.
4.9 References
1. Daniel Colombani, “Chain-growth control in free radical polymerization”, Progress in Polymer Science, 1997, 22, 1649-1720.
2. H. Y. Zhao, Z. N. Yu, F. Begum, R. C. Hedden, S. L. Simon, "The Effect of Nanoconfinement on Methyl Methacrylate Polymerization: T-g, Molecular Weight, and Tacticity", Polymer, 2014, 55 (19), 4959-4965.
3. F. Begum, H. Y. Zhao, and S. L. Simon, "Modeling Methyl Methacrylate Free Radical Polymerization: Reaction in Hydrophobic Nanopores", Polymer, 2012, 53(15), 3261 – 3268.
4. F. Begum, H. Y. Zhao, and S. L. Simon, "Modeling Methyl Methacrylate Free Radical Polymerization: Reaction in Hydrophilic Nanopores", Polymer, 2012, 53(15), 3238 – 3244.
5. F. Begum and S. L. Simon, "Modeling Methyl Methacrylate Free Radical Polymerization in Nanoporous Confinement", Polymer, 2011, 52, 1539 – 1545.
6. G. A. O’Neil & J. M. Torkelson, “Modeling Insight into the Diffusion-Limited Cause of the Gel Effect in Free Radical Polymerization”, Macromolecules, 1999, 32, 411.
8. G. A. O’Neil, M. B. Wisnudel & J. M. Torkelson, “A Critical Experimental Examination of the Gel Effect in Free Radical Polymerization: Do Entanglements Cause Autoacceleration”, Macromolecules, 1996, 29, 7477.
9. M. B. Wisnudel & J. M. Torkelson, “Diffusion-Limited Photophysical Interactions as in Situ Probes of Conversion in Free Radical Polymerization: Quantitative Analysis with Predictive Free-Volume Theory”, Macromolecules, 1994, 27, 7217.
10. R. G. W. Norrish & R. R. Smith, “Catalyzed Polymerization of Methyl Methacrylate in Liquid Phase”, Nature, 1942, 150, 336.
11. J. N. Cardenas & K. F. Driscoll, “High Conversion Polymerization. I. Theory & Application to Methyl Methacrylate”, J. Polymer Sc.: Poly. Chem Ed., 1976, 14, 883.
12. S. W. Benson & A. M. North, “The Kinetics of Free Radical Polymerization under Conditions of Diffusion-controlled Termination”, JACS, 1962, 84(6), 935.
13. T. J. Tulig & M. Tirrell, “Toward a Molecular Theory of the Trommsdorff Effect”, Macromolecules, 1981, 14, 1501.
14. J.A. Pojman, “Frontal Polymerization”, Encyclopedia of Polymer Science: A comprehensive reference, 2012, 4, 957-979.
15. J. A Pojman, J. Willis, D. Fortenberry, V. Ilyashenko and A. Khan, "Factors Affecting Propagating Fronts of Addition Polymerization: Velocity, Front Curvature, Temperature Profile, Conversion and Molecular Weight Distribution," J. Polym. Sci. Part A: Polym Chem. 1995, 33, 643-652.
16. J. A. Pojman, J. Masere, E. Petretto, M. Rustici, S. D. Huh, M. S. Kim, and V. Volpert, "The Effect of Reactor Geometry on Frontal Polymerization Spin Modes”, Chaos 2002, 12, 56-65.
17. M. Bazile Jr., H. A. Nichols, J. A. Pojman, and V. Volpert, "The Effect of Orientation on Thermoset Frontal Polymerization”, J. Polym. Sci. Part A: Polym Chem. 2002, 40, 3504-3508.
18. V. A. Volpert, V. A. Volpert and J. A. Pojman, “Effect of Thermal Expansion on Stability of Reaction Front Propagation”, Chem. Eng. Sci. 1994, 14, 2385-2388.
20. J. A. Pojman, R. Craven, A. Khan and W. West, "Convective Instabilities Induced by Traveling Fronts of Addition Polymerization”, J. Phys. Chem., 1992, 96, 7466-7472. 21. B. McCaughey, J. A. Pojman, C. Simmons and V. A. Volpert, "The Effect of Convection
on a Propagating Front with a Liquid Product: Comparison of Theory and Experiments," Chaos 1998, 8, 520-529.
22. G. Bowden, M. Garbey, V. M. Ilyashenko, J. A. Pojman, S. Solovyov, A. Taik and V. Volpert, "The Effect of Convection on a Propagating Front with a Solid Product: Comparison of Theory and Experiments", J. Phys. Chem. B 1997, 101, 678-686.
23. J. A. Pojman, V. M. Ilyashenko and A. M. Khan, "Free-Radical Frontal Polymerization: Self-Propagating Thermal Reaction Waves," J. Chem. Soc. Faraday Trans. 1996, 92, 2824-2836.
24. J. A. Pojman, G. Curtis and V. M. Ilyashenko, "Frontal Polymerization in Solution," J. Am. Chem. Soc. 1996, 115, 3783-3784.
4. Computer Simulation of Template Polymerization using a Controlled
Reaction Scheme
†
4.1 Introduction
The increasingly demanding industrial applications and the emerging uses of synthetic polymers require synthesis of specialty macromolecules. Synthetic homopolymers often lack perfect molecular-level definition; i.e., they possess non-uniform molecular weight distribution or distribution in tacticities. In addition, synthetic copolymers often exhibit chemical non-uniformity and randomness in the sequence of different types of units along the chains. This lack of definition arises from a number of causes, the most important ones being the statistical nature of the polymerization process and the absence of specificity in chain propagation. In many biological reactions, such as DNA replication or polypeptide synthesis, low molecular
weight substrates and polymeric products are present in the reaction medium together with the
macromolecular compounds, called matrices or templates, which control the synthetic process.
The discovery of DNA replication, an elaborate template synthesis, has inspired the development of template polymerization [1, 2]. Polymer chemists have studied the effects of templates on various types of polymerization methods, including, chain- and step-growth during homo- or copolymerization. The most notable examples are the use of DNA-templated synthesis (DTS) and nucleic acid template synthesis to either elongate DNA and oligo-nucleotide strands or polymerize daughter monomers from a predefined DNA sequence [3]. While DTS is an attractive platform for the production of monodisperse polymers with well-defined chemical sequences, it has so far been limited primarily to biopolymers.
Template polymerization is a process, which utilizes specific interactions between a
preformed macromolecule (i.e., template) and a growing chain [1-5]. It is characterized by
geometrically predetermined paths of chain propagation. Template polymerization comprises
three steps: 1) template-monomer complexation to form a linear array of monomers, 2)
polymerization of bound monomers, and 3) separation of the daughter macromolecule from
the mother template. The monomer units can bind to the template via various physical
interactions, such as, hydrogen bonding, dipole-dipole or electrostatic forces, or by chemical
bonding, such as disulfide bridging. In order to study template systems, one needs to compare
carried out under identical conditions, typically replacing the template by a low molecular
non-polymerizable entity. The effects of the template on the polymerization process and the
product are usually called “template effect” or “chain effect” [1]. The template effects can be
classified as [1, 2, 4-6]: 1) the kinetic effect (i.e., increased the reaction rate, change in kinetic
equation), 2) the molecular effect (i.e., influence on the molecular weight and molecular weight
distribution; ideally, the degree of polymerization of the daughter polymer is the same as the
degree of polymerization of the template used, so-called replication), 3) the effect on tacticity
(i.e., the daughter polymer can have a structure complementary to the structure of the template
used), and 4) the effect on the sequence distribution of units (in case of template
copolymerization). In this work, we explore the effect of templation on the average molecular
weight, composition and sequence distribution of the daughter polymers.
Advances in template polymerization can lead to better control of polymer properties. A few examples of influencing polymer properties, namely tacticity and chain organization, through templation have been reported in literature [7-9]. Other potential applications include synthesis of ladder-like polymers, or surface-based template polymerizations for the production of intertwined structures, free-standing two-dimensional polymers and molecular sensors [9-12]. In order to potentially harness Nature’s templation strategies to produce polymers with controlled lengths, tacticities, and sequences, we need to understand the factors that can affect template polymerization of simpler moieties. Experimental studies are often tedious and expensive because of the difficulties in separating the daughter polymer from the template. To this end, the vast parameter space can be explored easily and effectively with computer simulations.
then inducing polymerization by exposing the substrates to monomer/initiator solution. The main purpose of this work is to setup a framework for gaining an understanding of the structure of products of template polymerization under different conditions. Gaining detailed insight into the structure of the polymers grown via template polymerization will help us understand how the properties of the daughter polymers depend on the densities of free monomers, bound monomers and initiators, spacing of the bound monomers on the template, the template characteristics and the extent of monomer adsorption on the template. We vary systematically the number of free monomers, the number of initiators, the number monomers bound to the template, spacing between adjacent monomer units bound to the template, template characteristics (shape, orientation) and degree of flexibility. Upon testing the different parameters, we seek to identify the most favorable conditions for growth of template-bound polymers. Such information will ultimately assist in designing experimental conditions, leading to “optimal” and well-controlled template polymerization.
Different applications might require that polymers be prepared on a substrate comprising various geometries and dimensionalities, such as nanowires, Si/Au surfaces, a polymer with a stiff backbone, zeolites. Depending on the geometry and the dimensionality, the growing chains experience a diverse degree of confinement. For planar substrates (Si/Au wafers) [13] or nano-porous substrates [14] (zeolites), the added dimensionality can impose stronger spatial restrictions on the growing polymer chains as compared to rod-like substrates (nanowires, polymer backbones). In this paper, we deal specifically with 1-D substrates surfaces because this is perhaps the simplest geometry to model and understand as it imposes the least restriction on the polymer chains. We plan to extend the study to other geometries (planar substrates/nanoporous substrates) and that would be quite straightforward, given our present setup.
on value of the grafting density, templation might be favored (due to proximity of monomer units) or hindered due to stearic effects. Our work provides the framework for finding an optimum grafting density corresponding to substrates of dimensionalities. Substrate shape can potentially impose confinement effects on the growing polymer chains. We explore the two extreme cases of curvature- rod-like substrates and ring-like substrates. Experimentally, it is difficult to investigate the effect of shape of 1-D substrates on templation products. With the present set-up, extension to flat, concave or convex 2-D substrates is straightforward.
4.2 Simulation Model
We use a Monte Carlo (MC) simulation scheme to model the “living”/controlled radical polymerization (CRP) based on the bond fluctuation model (BFM) in the NVT ensemble [15]. The substrates, monomers, and polymers reside on a three-dimensional cubic lattice. All possible permutations and sign inversions of the following vector families represent the allowed set of moves: P(2,0,0) U P(2,1,0) U P(2,1,1) U P(2,2,1) U P(3,0,0) U P(3,1,0). This prevents any bond from crossing and polymers from overlapping. In this implementation, each bead on the lattice represents an effective monomer unit. The simulation results reported here have been carried out on a cubic lattice 50×50×50, with periodic boundary conditions applied in all directions. Because each monomer corresponds to 8 sites effectively, the full lattice occupancy is achieved at 15,625 sites. The computer simulations follow the general scheme of individual steps reported in an earlier work by one of the authors [16]. The values of the parameters intrinsic to the MC simulation scheme are held constant during all the runs, namely reaction probabilities for initiators and living radicals are both 1 and the probability of reaction vs. motion is 0.01. A low value of the reaction probability assures controlled polymer growth. For details of the model and the choice of parameters see Ref. 16 and 17.
is either 28 or 64. The grafting density of the bound monomers on the substrates (σB) is,
Figure 4.1. a) Rod-like substrates (black) with grafted bound monomers (magenta), (b) Ring-like substrates (black) with grafted monomers (magenta), (c) copolymers formed by combination of free monomers (green) and bound monomers (magenta) – high grafting density of monomers, (d) copolymers with bound “unimers” – low grafting density of monomers on substrate.
(105) and runs for a predetermined number of MCS, typically 109, in order to achieve the same conversion. On an average it takes around 6 hours for each set of MC runs.
Chain statistics (i.e., molecular weight, polydispersity index) and the coordinates of the monomers of each polymer and all monomers are stored periodically after several thousand MCS. In order to obtain good statistics, we perform 50 MC simulations runs for every set of input parameters. In order to understand the effect of different parameters (i.e., [B], σB, [A],
[I], substrate shape, bound monomer orientation and flexibility), we monitor the number distribution of bound B monomers and the sequence length distribution in the A-B copolymers, normalized by the number of copolymers formed. While the number distribution gives us a quantitative estimate of the incorporation of bound B monomers in A-B copolymers, the sequence length distribution offers a qualitative insight into the co-monomer distribution in the A-B copolymers. In addition, we also report the number of A-B copolymers and the mole fraction of bound B monomers present in the A-B copolymers.
4.3 Results and Discussion
To facilitate the discussion, we set [B] = 28, and B = 0.42. We will explore the effect
[I] more polymer chains are generated in the system, which reduces the number of B bound monomers available per growing chain. Thus, by increasing [I], it is more likely to form more A-B copolymers but less likely for a growing A-B chain to incorporate many bound B monomers. We will refer back to the effect of the number of initiators on the polymerization process later in this section.
Figure 4.2. Comparison of the number and sequence length distributions of B bound monomers in A-B copolymers for different number of initiators ([I] = 12 and 125) and free monomers ([A] = 3125 and 6250) for rod-like substrates.
We now set [I] = 12 and [B] = 28 and increase σB from 0.42 to 1.0. The normalized
number distributions of bound B monomers per A-B copolymer chain for the different values of σB are plotted in Figure 4.3. The maximum number of B monomers per copolymer
becomes most prominent at the highest grafting (σB = 1); the maximum number of B per
copolymer increases from 7 (for σB < 1) to 13 (for σB = 1). Note that for σB = 1 there is a
distinct peak corresponding to 7 bound B monomers per A-B copolymer indicating that all of the 7 bound B monomers in each substrate (recall that given [B] = 28 and 4 identical substrates bearing the bound B monomers, there are 7 monomers per substrate) can be potentially incorporated in a single chain at the highest grafting density. This implies that we can grow polymer chains that mimic perfectly the template when the B monomeric units are spaced as close as possible along the template. We attribute this behavior to the “proximity effect”; i.e., once a growing chain adds a bound monomer unit, it is more likely to add a neighboring bound B monomer than a random free A monomer. Overall, varying the concentration of free A monomers does not have an effect of the system behavior. This is due to the large excess of A monomers present in the system. In the following discussion, we thus set [A] = 3125 for most of the simulations.
Our computer simulations indicate that for σB < 1 the B monomers are incorporated
into the A-B copolymers as unimers; i.e., there are not dimers, trimers, tetramers, etc. constituting consequent runs of B units within the A-B chains. Only for σB = 1 we detect the
presence of B-mers longer than unimers. This suggests that longer sequences of consecutive B runs can be realized when the B monomers are spaced on the substrate as closely as possible. This finding also reveals that varying the absolute value of [B], while keeping σB = 1 should
alter the population density of the various “mers”. In Figure 4.4, we compare the number and sequence length distributions of systems having different number of bound monomers ([B] = 28 and 64) at σB = 1. The sequence length distribution of B for [I] = 12 and [B] = 28
(shown along x and y-axes of Figure 4.5, respectively). Monomers 1-16, 17-32, 33-48 and 49-64 are attached to substrates 1, 2, 3 and 4 respectively; the red lines demarcate the position of the substrates on Figure 4.5. We count the number of blocks of B in each copolymer, the corresponding block length (number of B in a block) and the serial number of each B monomer unit in a block and plot this information in Figure 4.5 for a visual representation. For example, consider polymer 1 in Figure 4.5; it has two B blocks of lengths 1 and 2 shown in black and yellow respectively. Figure 4.5 also reveals that both these blocks (monomer numbers 49, 50-51) are located on the 4th substrate.
Figure 4.5. Distributions of “mers” in A-B copolymers for [I] = 125, [B] = 64, [A] = 6250 and σ = 1. Unimers to octamers are observed to be formed under these conditions (the red lines demarcate the different substrates).
“proximity effect”; the average spacing between adjacent bound and flexible monomers does not remain constant through the run time, effectively reducing the overall grafting density. This is evident from the disappearance of peaks (red squares) corresponding to 7 (for [B] = 28) or 16 ([B]) = 64) in the number distributions of B and the occurrence of discrete B units in sequence length distributions. Therefore, in systems featuring flexible bound B monomers one cannot polymerize all B monomers present on the substrate. Thus, the B monomers bound rigidly to the substrate (i.e., no conformational flexibility) are more favorable towards templation at high grafting densities.