Patterns of Cell Division and the Risk of Cancer
Steven A. Frank,*
,1Yoh Iwasa
†and Martin A. Nowak
‡*Department of Ecology and Evolutionary Biology, University of California, Irvine, California 92697-2525,†Department of Biology,
Kyushu University, Fukuoka 8128581, Japan and‡Institute for Advanced Study, Princeton, New Jersey 08540
Manuscript received October 18, 2002 Accepted for publication January 6, 2003
ABSTRACT
Epidermal and intestinal tissues divide throughout life to replace lost surface cells. These renewing tissues have long-lived basal stem cell lineages that divide many times, each division producing one stem cell and one transit cell. The transit cell divides a limited number of times, producing cells that move up from the basal layer and eventually slough off from the surface. If mutation rates are the same in stem and transit divisions, we show that minimal cancer risk is obtained by using the fewest possible stem divisions subject to the constraints imposed by the need to renew the tissue. In this case, stem cells are a necessary risk imposed by the constraints of tissue architecture. Cairns suggested that stem cells may have lower mutation rates than transit cells do. We develop a mathematical model to study the consequences of different stem and transit mutation rates. Our model shows that stem cell mutation rates two or three orders of magnitude less than transit mutation rates may favor relatively more stem divisions and fewer transit divisions, perhaps explaining how renewing tissues allocate cell divisions between long stem and short transit lineages.
C
ANCER follows from a series of somatic mutations. each division producing a transit cell that divides only a few times before sloughing.Renewing epithelial tissues such as the skin or
colon may be at particular risk because of the large num- We study a simple model for the number of stem and transit cell divisions that minimize the risk of cancer. ber of cell replications over a lifetime. Cairns (1975)
suggested that renewing tissues may reduce the risk of We show that minimal cancer risk is obtained by using the fewest possible stem divisions subject to the con-cancer by separating into long-lived stem cells and
short-lived transit cells. straints imposed by the need to renew the tissue. In
this case, long-lived stem lineages are a necessary risk Stem cells divide repeatedly and remain at the base
imposed by the constraints of tissue architecture. of the epithelial tissue. Each stem cell division gives rise
Cairns(1975, 2002) suggested that stem cells mutate to one stem cell that remains at the basal layer and one
less frequently than transit cells, favoring a separation transit cell. The transit cell divides a limited number of
into long-lived stem lineages and short-lived transit lin-times, producing cells that move up from the basal layer
eages. We calculate the optimal length of stem and and eventually slough off from the surface. For example,
transit lineages for different combinations of stem and recent studies of human epidermal tissue suggest that
transit mutation rates. If stem mutation rates are suffi-the skin renews from relatively slowly dividing basal stem
ciently lower than transit mutation rates, then selection cells that give rise to rapidly dividing transit lineages,
does favor a split of the cell lineages into a permanent each transit lineage undergoing three to five rounds of
stem line and a series of temporary transit lineages. replication before sloughing from the surface (Janeset
To initiate cancer, the transit cells may require more
al.2002). Studies of gastrointestinal crypts estimate four
mutations than the stem cells. The additional mutations to six rounds of division by transit lineages (Bachet al.
may, for example, cause the transit cells to stick within 2000).
the tissue and avoid being sloughed from the surface. Each piece of renewing tissue must produce a certain
We show that if transit cells require more mutations number of cells over a lifetime. Different patterns of
than stem cells do, avoidance of cancer favors a shift of stem cell and transit cell divisions can give rise to the
cell divisions into longer transit lineages and shorter same total number of cells. For example, stem cells may
stem lineages. divide rarely, each division producing a transit cell that
divides many times before its descendants slough from the surface. Or the stem cells may divide frequently,
PRELIMINARY MODEL OF CELL DIVISION AND CANCER RISK
A renewing epithelial tissue imposes constraints on
1Corresponding author:Department of Ecology and Evolutionary
Biol-the pattern of cell division and cell death. A certain
ogy, University of California, Irvine, CA 92697-2525.
E-mail: [email protected] number of surface cells regularly die and slough off.
Cell division in subsurface layers replaces the lost cells. Before considering a particular model of cell renewal, it is useful to consider how patterns of cell division affect cancer risk in the absence of constraints on which cells die and which cells divide.
In the simplest model, all cell divisions have the same mutation rate and there is no cell death. We start with a single cell. The tissue must continue to divide its cells until it has a total ofkcells. In the absence of cell death, this requires k ⫺ 1 cell divisions. Cancer arises if at least one cell acquiresmmutations. We assume that all mutations act dominantly in the manner of oncogenes. This assumption of dominance simplifies the analysis. The same approach and qualitative conclusions would apply to recessive tumor suppressor loci.
What sort of topology for the history of cellular lin-eages minimizes the risk of cancer? One way to describe
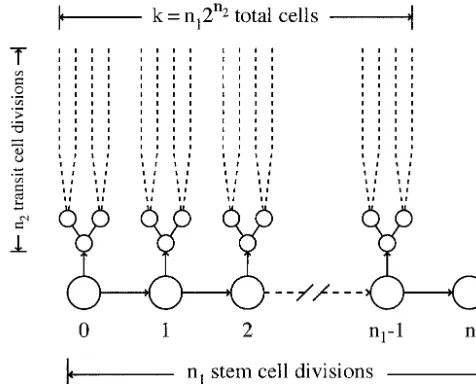
Figure1.—The pattern of cell division giving rise to a total
topology is the evenness in the length of cellular
lin-ofkcells. The single, initial cell divides to produce a stem cell
eages. For example, each division could give rise to one
and a transit lineage. Each transit lineage dividesn2 times,
daughter that does not divide again and one parent yielding 2n2cells. The stem lineage dividesn
1times, producing
that continues division. To make k ⫽ 2n cells would
a total ofk⫽n12n2cells.
require a parental stem lineage with a length of 2n⫺1 cell divisions. Alternatively, each cell division could give
rise to two daughter cells, each of which divides. The of constraint on cellular lineages. The constant cell resulting binary tree would produce 2nfinal cells, each
death forces those transit lineages terminating at the cell ending a cellular lineage withndivisions in its his- surface to be relatively short and requires the
mainte-tory. nance of long-lived stem lineages to renew the tissue.
Ifm⫽1, then topology does not matter because all topologies havek⫺1 cell divisions, and the risk of one
mutation depends only on the number of cell divisions. RENEWING EPITHELIAL TISSUE
Ifm⬎1, then two or more mutations are needed to
We assume that a single basal epithelial cell must cause cancer. Suppose we pick any cell from the total
divide to producekcells over a lifetime. We study how history of cells produced in a tissue. The risk of cancer
the risk of cancer depends on the separation of cell in that cell increases exponentially with the number of
divisions into the stem lineage and a series of transit cell divisions,t, back to the original progenitor cell. This
lineages. In this model,mmutations to the stem lineage exponential increase occurs because the risk of cancer
orm⫹ymutations to the transit lineage cause cancer. rises with cell divisions in proportion totm.
In our model, themmutations must occur inm partic-At any time in the history of cell divisions, the extant
ular genes. Alternatively, one could assume a pool of cells will have a variable numbertof cell division steps
MⰇmmutable genes, among which onlymmutations back to the original progenitor cell. For the next cell
are needed to cause cancer. The larger pool of poten-division, the smallest cancer risk is achieved by using
tially cancer-inducing genes would increase the effective the cell with the smallestt, that is, the shortest lineage.
mutation rates, the risk of cancer, and some of the Smallest t is best because risk increases exponentially
quantitative details of the models that follow. But the with t. If we always add cell divisions to the shortest
main qualitative features are similar under either set of extant lineage, the cellular history will develop as a
assumptions about the number of mutable genes. binary tree with all tips as close as possible to equal
Figure 1 shows the pattern of cell division giving rise length from the progenitor.
to ktotal cells. The stem lineage divides n1 times and
Thus, in the absence of constraints imposed by
partic-each transit lineage divides n2 times, giving a total of
ular patterns of cell death, binary cell division minimizes
k ⫽ n12n2 cells. It is sometimes useful to express the
cancer risk. With cell death, it is best to minimize the
parameters such that k⫽2N⫽2N⫺n22n2 withn
1 ⫽ 2N⫺n2.
length of long lineages.
More cell death means more cell divisions, longer Thus, the length of the stem lineage,n1, increases
expo-nentially as the number of transit divisions,n2, declines.
cellular lineages, and greater risk of cancer. Thus,
apop-Equal mutation rates in stem and transit cells: Sup-tosis, which can limit cancer by weeding out potentially
pose that stem and transit lineages have the same muta-dangerous cells, also imposes a risk because cell
replace-tion rate. Then the result of the previous secreplace-tion implies ment requires increasing the length of cellular lineages.
longest lineages because of the exponential increase in e⫺utd, whered⫽2(2n2⫺i ⫺1) is the number of branches risk with lineage length. Thus, the smallest number of in the descendant cell lineage along which mutations stem divisions and the longest possible transit lineages can occur.
minimize the risk of cancer, subject to the architectural The total risk of two mutations and cancer accumu-constraint for a renewing tissue that requires a certain lates along the stem lineage as
rate of cell loss from the transit lineages. In this case, the maintenance of long-lived stem lineages arises from
R2(n1,n2)⬇
兺
n1
i⫽1
e⫺2us(i⫺1)[2u
sR1(n1⫺i⫹ 1,n2)
the architectural constraints of the tissue rather than
from a scheme of cell division that gives the lowest ⫹
(1⫺2us)T2(n2)] ,
possible risk of cancer. With equal stem and transit
mutation rates, long-lived stem lineages are a necessary where the probability at stepithat a first mutation in risk imposed by tissue architecture. the stem lineage has not occurred ise⫺2us(i⫺1), the
proba-Different mutation rates in stem and transit cells: bility of the first mutation at theith step is 2us, the term
Cairns(1975, 2002) suggested that stem cells may have
reduced mutation rates compared with transit lineages. R1(n1⫺ i⫹1,n2)⫽1⫺e⫺(n1⫺i⫹1)(us⫹ut(2 n2⫹1⫺1))
This would favor more divisions in the stem lineage and
is the risk of at least one mutation in the descendant fewer divisions per transit lineage.
Cairns argued that, in each cell division, the stem branches in the cellular lineage including the current lineage retains the original DNA templates, and all new cell, and, finally, no mutations occur in the ith stem DNA copies segregate to the transit lineage. If most cell with probability 1⫺ 2usand two mutations occur
mutations occur in the production of new DNA strands, in its descendant transit lineage with probabilityT2(n2).
then most mutations would segregate to the transit lin- Using the geometric series, the above approximation eage, and the stem lineage would accumulate fewer forR2can be written equivalently as
mutations per cell division. Cairns cites some evidence in favor of stem cells retaining templates, suggesting that
R2⬇ [2us⫹(1 ⫺2us)T2(n2)]
1⫺ e⫺2usn1
1⫺ e⫺2us
more empirical studies on this topic would be valuable. Different levels of exposure to mutagens may also
cause different mutation rates in stem and transit lin- ⫺
2use⫺n1(z⫹2us)
en1z⫺ 1
ez⫺ 1, eages. In the skin and intestine, the stem cells reside
several layers below the surface. By contrast, the transit
(1)
lineages occur at the upper tissue layers. The upper wherez⫽ut(2n2⫹1⫺ 1)⫺u s.
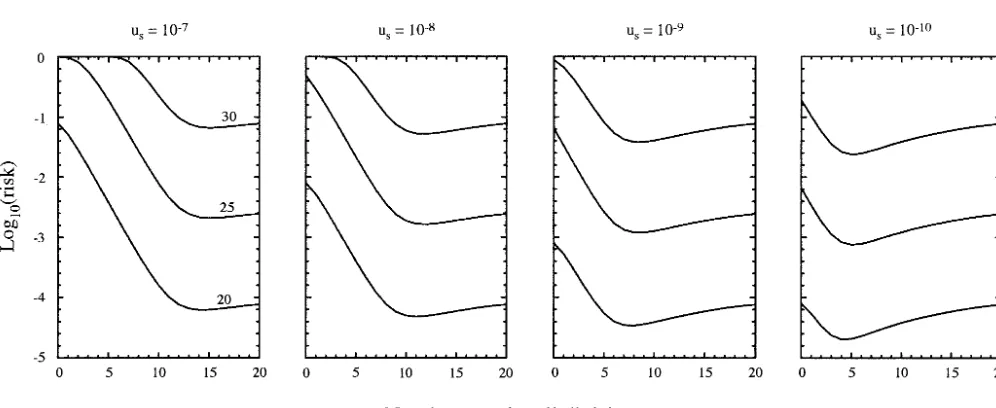
transit cells may be exposed to numerous mutagens, We tested the quality of the approximation in Equa-whereas the deeper stem cells may be partially pro- tion 1 by running replicates of a Monte Carlo simulation tected. Alternatively, the stem cells may divide more of cellular lineages with mutation. Figure 2a shows a match slowly than the transit cells, allowing more time in the between the shape of the curves from the mathematical stem lineage for DNA damage checkpoints and repair. approximation and from the computer simulation. Or, stem cells may be particularly prone to apoptosis Figure 3 shows the risk of at least one cell carrying in response to DNA damage, killing themselves rather two mutations and causing cancer. The plots show risk than risking the repair of damage (Cairns 2002). for different combinations of stem and transit lengths, We assume that a stem cell produces one daughter with thex-axis giving the transit lengthn2corresponding stem cell that inherits mutated genes with probability with a stem length ofn1⫽2N⫺n2. In all cases,u
t⫽10⫺6.
usper gene and one daughter transit cell that inherits Each plot shows different values ofus. The three curves
mutated genes with probability ut per gene. Further in each plot from bottom to top illustrate the risk forN⫽
divisions by transit cells have a mutation rate ofut. 20, 25, and 30, which corresponds to the production of
We calculate the probability of developing cancer for 106–109final transit cells from a single original stem cell.
two mutations, m ⫽ 2 and y ⫽ 0. Consider first the Note that the choice ofn
2that minimizes risk changes
probability of two mutations to a cell in a transit lineage little with the need to produce more cells. Instead, low-withn2cell divisions, assuming that the initial cell has est risk occurs by elongating the stem lineage, keeping
no mutations,
a constant number of transit divisions. Lower stem cell mutation rates favor a shift to more stem and fewer
T2(n2)⬇
兺
n2
i⫽1
2i(u2
t ⫹ 2utT1(n2⫺i)) , transit divisions, as expected.
The risk of three mutations (m⫽3,y⫽ 0) is where there are 2icells after the
ith round of cell divi-sion, each cell with a chanceu2
tof getting two mutations
R3(n1,n2)⬇
兺
n1
i⫽1
e⫺3us(i⫺1)(3u
sR2(n1⫺i ⫹1,n2)
and a chance 2ut of getting one mutation. If a cell
suffers one mutation, the risk of at least one additional
Figure2.—Comparisons of theoretical approx-imations and Monte Carlo simulations for the risk of cancer. (a) Two mutations cause cancer,m⫽ 2, and the total number of cells made isk⫽215.
The transit mutation rate isut ⫽ 10⫺4, and the
stem mutation rate varies from 10⫺7 to 10⫺5 as
shown above each curve. The solid line shows the theoretical approximation from Equation 1. The dashed curve shows the outcome from repeated trials of a Monte Carlo simulation. (b) Two muta-tions cause cancer,m⫽3. Other parameters are as in a or as labeled on the plot. The theoretical approximation is from Equation 2. Note that the approximation shows more divergence from the simulations as us falls toward u2t, that is, as the
frequency of stem mutations per cell division falls toward the frequency of two simultaneous transit mutations per cell division. Thus, the approxima-tions work best whenusⰇ u2t. We used higher
mutation rates in these plots than in later exam-ples to obtain a sufficient number of cellular his-tories with cancer.
with the probability of three hits in a transit lineage of the theoretical approximation against results from Monte Carlo simulations.
Transit cells require more mutations to become can-T3(n2)⬇
兺
n2
i⫽1
2i(u3
t ⫹3u2tT1(n2⫺i)⫹ 3utT2(n2⫺ i)) .
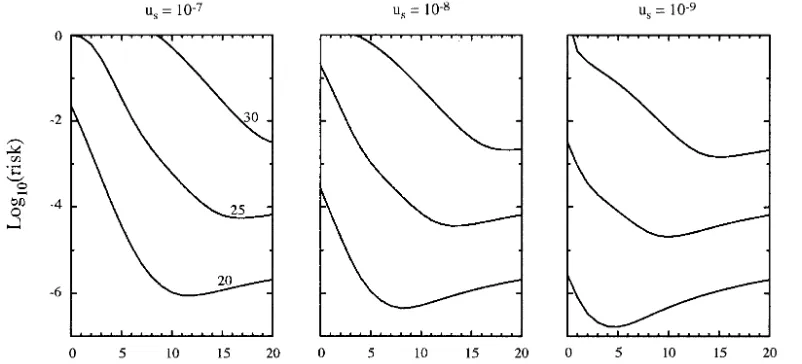
cerous:Transit cells move toward the surface and slough because of pressure from below by continually dividing Figure 4 shows the risk of at least one cell carrying
cells. Thus, transit cells may require mutations to avoid three mutations. Compared with two mutations to
dis-sloughing to cause cancer. For example, an additional ease, the need for three mutations favors a shift to
mutation that makes a transit cell surface sticky may shorter stem lineages and longer transit lineages. This
prevent it from shedding. shift occurs because risk in a particular cellular lineage
Suppose that transit cells require more mutations to rises with the third power of the number of cell divisions
cause cancer than stem cells do. As more transit muta-in that lmuta-ineage, puttmuta-ing a higher cost on a long stem
lineage than on that with two mutations. Figure 2b tests tions are needed to cause cancer, the risk of cancer is
Figure3.—Risk of a cell carrying two mutations, leading to cancer. Thex-axis gives the transit lengthn2corresponding with
a stem length ofn1⫽2N⫺n2. Each plot shows different values ofus, withut⫽10⫺6in all cases. The three curves in each plot from
Figure 4.—Risk of a cell carrying three mutations, leading to cancer. Thex-axis gives the transit lengthn2
cor-responding with a stem length of n1⫽2N⫺n2. Each
plot shows different values of us, withut⫽10⫺5in all cases.
The three curves in each panel from bottom to top il-lustrate the risk forN⫽20, 25, and 30; calculated from Equation 2.
reduced by shifting more cell divisions away from the cells may divide more slowly, allowing more time for accurate replication; and stem cells may experience stem lineage and into transit lineages. This shift is
fa-vored because the extra transit mutations to cause dis- lower carcinogen doses than the surface-exposed transit cells do. These factors could plausibly reduce stem muta-ease protect the transit lineages and reduce their risk
relative to stem cells. tion rates relative to transit cell mutation rates. Cairns
cites some evidence in favor of these factors. Firm con-clusions require further studies.
DISCUSSION
We studied the quantitative effects of different muta-tion rates in stem and transit lineages. Figure 3 shows Three factors have been proposed to favor a split into
the risk of two mutations arising in at least one cell given a permanent stem lineage and a series of short transit
a particular separation into stem and transit lineages. lineages. First, Cairns (1975) argued that transit
lin-Between 5 and 15 transit divisions minimize cancer risk. eages discard their mutations; thus it would be
advanta-The lower end of this range matches the 3 to 5 transit geous to shift cell divisions to those disposable lineages.
divisions of the skin (Janeset al.2002) and 4 to 6 transit We showed that if mutation rates are the same in stem
divisions of the intestine (Bachet al.2000). In Figure and transit lineages, then minimal risk occurs with the
3, the mutation rate per gene in transit divisions is 10⫺6
shortest stem lineage required to satisfy the constraints
and the stem mutation rate varies from 10⫺7to 10⫺10.
imposed by the architecture of a renewing tissue. A
Figure 4 shows similar plots for the risk of three muta-renewing tissue must continually produce new cells to
tions arising in at least one cell. replace the specially differentiated and short-lived
sur-We have focused on a small number of mutations for face layers.
transformation to cancer. It would be more accurate to Second, transit cells may require more mutations to
emphasize that many mutations are probably required cause cancer than stem cells do because transit cells
to transform a lineage, but that only a small number of would normally be discarded after a short time.
Dispos-mutations are rate limiting for transformation ( Knud-able mutations and extra protection in the transit
lin-son1993;Hanahan andWeinberg2000). For exam-eage favor a shift to longer transit linexam-eages and shorter
ple, the rate-limiting steps may have to do with reduced stem lineages. Thus, neither disposable transit
muta-DNA repair or disabling of apoptotic mechanisms that tions nor lower risk in transit cells can explain the
main-kill cells with DNA damage. Once past these steps, other tenance of the stem-transit division as a mechanism to
mutational steps that are not rate limiting may accumu-reduce cancer risk.
late rapidly. Third, Cairns(1975, 2002) suggested that stem
lin-Epithelial cancers in humans probably require more eages have lower mutation rates than transit lineages.
than two or three rate-limiting mutations (Knudson1993; Risk would thus be reduced by more lower-risk stem
HanahanandWeinberg2000). However, an individual divisions and fewer higher-risk transit divisions. Several
may have in early life one or more mutations in several factors may reduce the relative mutation rate of stem
epithelial stem cells. Suppose, for example, that a tissue lineages: stem cells may keep the DNA templates and
is divided into 107⬇223compartments, each
compart-segregate the new, error-prone copies to daughter
tran-ment forming a unit with basal stem cells and rising sit lineages; stem cells may induce apoptosis rather than
If each compartment had only one stem cell derived andKinzler2002). In mice without p53, tumors devel-oped in⬎75% of the animals by 6 months of age ( Mal-from a single progenitor cell, it would require ⬎23
kin2002). It may be that because cancer is such a strong rounds of binary cell division to populate the
compart-selective force, it does not appear early in humans or ments.
other animals. If the progenitor came from the initial 100⬇27cells
How much of tissue architecture is shaped to avoid of the early embryo, then the stem cells of the 107
com-diseases caused by the accumulation of somatic muta-partments have been through at least 30 rounds of cell
tions? Our first model demonstrates that ideas such as division. Many compartments would begin with a stem
disposable transit lineages cannot by themselves explain cell with one rate-limiting mutation, and some
individu-the stem-transit structure. We individu-then calculated individu-the risks als would have compartments that begin life with two
under different stem and transit mutation rates. If stem rate-limiting mutations in disease-causing genes. Thus,
mutation rates are lower than transit rates, then our an additional two or three mutations during epithelial
models make two predictions. First, as the number of renewal may pose some risk.
mutations required to cause disease rises, minimizing Minimizing cancer risk may not be the most
impor-risk favors more transit and fewer stem divisions. Sec-tant force shaping tissue architecture. Renewing tissue
ond, as the stem mutation rates decrease relative to requires constant production of short-lived cellular
lin-transit rates, minimizing risk favors more stem and fewer eages. This structural constraint alone could give rise
transit divisions. It would be interesting to compare to cellular histories with a combination of long-lived
epithelial tissue architectures in organisms with differ-and short-lived lineages.
ent life spans, rates of tissue renewal, and relative rates Most cancers occur in older individuals, in which the
of stem and transit mutations. force of natural selection is weak. Thus, at first glance, it
National Science Foundation grant DEB–0089741 and National
may seem that cancer must be a relatively weak selective
Institutes of Health grant AI24424 support S.A.F.’s research. The
force. However, natural selection favors additional
pro-Packard Foundation and Jeffrey Epstein support M.A.N.’s research.
tections against cancer up to the point at which one more protective character would be selectively neutral
(Nunney1999). The fact that cancer is presently a weak LITERATURE CITED
selective force may be the consequence of how selection
Bach, S. P., A. G. RenehanandC. S. Potten, 2000 Stem cells: the
has in the past shaped tissue architecture and the multi- intestinal stem cell as a paradigm. Carcinogenesis21:469–476. ple regulatory controls on DNA damage, cell prolifera- Cairns, J., 1975 Mutation selection and the natural history of cancer.
Nature255:197–200.
tion, and cell death. For example, the retina has
rela-Cairns, J., 2002 Somatic stem cells and the kinetics of mutagenesis
tively small numbers of cell divisions and therefore a and carcinogenesis. Proc. Natl. Acad. Sci. USA99:10567–10570.
Hanahan, D., andR. A. Weinberg, 2000 The hallmarks of cancer.
low risk of accumulating mutations, and it has relatively
Cell100:57–70.
few rate-limiting regulatory controls preventing trans- Janes, S. M., S. LowellandC. Hutter, 2002 Epidermal stem cells. formation to cancer. By contrast, epithelial tissues have J. Pathol.197:479–491.
Knudson, A. G., 1993 Antioncogenes and human cancer. Proc. Natl.
relatively many cell divisions, a greater risk of
accumulat-Acad. Sci. USA90:10914–10921.
ing mutations, and relatively more rate-limiting regulatory Malkin, D., 2002 Li-Fraumeni syndrome, pp. 387–401 inThe Genetic controls preventing transformation to cancer (Knudson Basis of Human Cancer, Ed.2, edited by B.Vogelsteinand K. W.
Kinzler. McGraw-Hill, New York.
1993).
Nunney, L., 1999 Lineage selection and the evolution of multistage
Cancer has probably been a very strong selective force carcinogenesis. Proc. R. Soc. Lond. Ser. B266:493–498.
Vogelstein, B., andK. W. Kinzler, 2002 The Genetic Basis of Human
in the evolutionary history of multicellularity. Humans
Cancer, Ed.2. McGraw-Hill, New York.
have hundreds or perhaps thousands of genes to