Testing Models of Selection and Demography in
Drosophila simulans
Jeffrey D. Wall,*
,1Peter Andolfatto
†and Molly Przeworski
‡,2*Department of Organismic and Evolutionary Biology, Harvard University, Cambridge, Massachusetts 02138,†Institute of Cell, Animal and Population Biology, University of Edinburgh, Edinburgh EH9 3JT, United Kingdom and
‡Department of Statistics, University of Oxford, Oxford OX1 3TG, United Kingdom
Manuscript received December 10, 2001 Accepted for publication June 12, 2002
ABSTRACT
We analyze patterns of nucleotide variability at 15 X-linked loci and 14 autosomal loci from a North
American population ofDrosophila simulans.We show that there is significantly more linkage disequilibrium
on the X chromosome than on chromosome arm 3R and much more linkage disequilibrium on both chromosomes than expected from estimates of recombination rates, mutation rates, and levels of diversity. To explore what types of evolutionary models might explain this observation, we examine a model of
recurrent, nonoverlapping selective sweeps and a model of a recent drastic bottleneck (e.g., founder event)
in the demographic history of North American populations ofD. simulans.The simple sweep model is
not consistent with the observed patterns of linkage disequilibrium nor with the observed frequencies of segregating mutations. Under a restricted range of parameter values, a simple bottleneck model is consistent
with multiple facets of the data. While our results do not exclude some influence of selection on Xvs.
autosome variability levels, they suggest that demography alone may account for patterns of linkage
disequilibrium and the frequency spectrum of segregating mutations in this population ofD. simulans.
A
fundamental question in population genetics is the lected polymorphism data from 15 X-linked loci and 14 loci on chromosome arm 3R in a California population relative importance of natural selectionvs.neutraland/or demographic factors in shaping genome-wide ofDrosophila simulans.Their goal was to distinguish be-patterns of sequence variability (Lewontin1974;Kimura tween different explanations for the empirical observa-1983). Distinguishing between selective and neutral/ tion that levels of variability are positively correlated with demographic effects on genome variability requires mul- rates of meiotic crossing over in Drosophila (Aguade´et tiple independent loci scattered throughout the genome. al. 1989; Begun and Aquadro 1992; Aquadro et al. Although there are polymorphism data from dozens of 1994). Two major theories have been proposed for this loci in Drosophila (see, e.g., Moriyama and Powell pattern; both describe the effects of natural selection 1996; Andolfatto and Przeworski 2000; Andol- at linked sites. The hitchhiking or selective sweep model fatto 2001; Przeworski et al. 2001), these data are posits that alleles driven to fixation by positive selection difficult to interpret because many of the loci are sam- reduce levels of variation at linked neutral sites (May-pled in different populations. As a result, one is never nard SmithandHaigh1974;Kaplanet al.1989), while quite sure to what extent patterns of variation at a collec- the background selection model considers the variation-tion of loci are the byproduct of the particular sampling reducing effect of strong purifying selection (Hudson schemes used. In particular, in the absence of indepen- and Kaplan 1995; Charlesworth et al. 1993). Both dent knowledge about the demographic history of a models predict a greater reduction of variability in areas species, it becomes very difficult, if not impossible, to of reduced recombination, so both are potential expla-draw inferences about the role of natural selection. nations for the positive correlation between diversity Much of this ambiguity can be eliminated by sequencing levels and recombination rates.
the same lines from the same populations at multiple Begun andWhitley (2000) attempt to distinguish loci, yet it is only recently that consistently sampled between background selection and positive selection Drosophila data have been gathered from many loci models by comparing levels of variability on the X chro-(BegunandWhitley2000;Begunet al.2000;Andol- mosome and an autosome (Aquadro et al. 1994). If fattoandPrzeworski2001). deleterious mutations tend to be partially recessive In one such study,Begun andWhitley(2000) col- (CrowandSimmons1983;Houleet al.1997), purifying selection is expected to be more efficient on the X chromosome relative to the autosomes, due to haploidy
1Corresponding author:Department of Organismic and Evolutionary
in males. The background selection model therefore Biology, Harvard University, 16 Divinity Ave., Cambridge, MA 02138.
predicts that, if all other factors are comparable, there E-mail: [email protected]
should be less of a reduction in levels of variation on
2Present address:Max Planck Institute for Evolutionary
Anthropol-ogy, D-04103 Leipzig, Germany. the X chromosome than on the autosomes
worthet al.1993;Charlesworth1996).Begun and simulans. They found that N estimated from linkage disequilibrium and rˆwas much smaller than the stan-Whitley(2000), however, find reduced levels of
diver-sity on the X chromosome, even when X-linked diverdiver-sity dard estimate ofNbased on levels of variability and an estimate of the mutation rate, which was interpreted as is multiplied by 4⁄
3 (to correct for the fewer number
of X chromosomes, assuming equal male and female a genome-wide excess of linkage disequilibrium in the two species. Our study presents the advantages of consis-effective population sizes). They conclude that the
back-ground selection model is incompatible with their data tently sampled data and more accurate estimates of. and suggest instead that greater hitchhiking effects due
to positive selection on the X relative to the autosomes
METHODS might account for their pattern. This will occur if
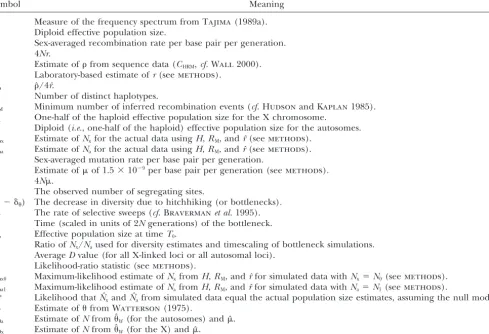
posi-tively selected alleles are sometimes recessive; haploidy A list of definitions for the symbols used in this paper (in approximate order of introduction) can be found on the X in males would then facilitate X-linked selective
sweeps. in Table 1.
Loci and samples:We consider 29 loci collected from Considering what we know about the demographic
history ofD. simulanspopulations, it may also be relevant a singleD. simulanspopulation (Wolfskill Orchard, Cali-fornia), reported by Begun and Whitley(2000). Se-to consider nonselective explanations for Begun and
Whitley’s observation.D. simulansis a human commen- quences were obtained from GenBank and aligned by eye. We consider only biallelic single-nucleotide base sal; it is thought to have originated in tropical Africa
and may have colonized the Americas as recently as a few substitutions; multiple substitutions, insertion-deletion mutations, and other overlapping mutational events hundred years ago (Davidand Capy 1988;Lachaise
et al. 1988). A contraction in population size (i.e., a (e.g., substitutions overlapping with deletions) are ex-cluded from analyses. Excluding multiple substitutions population bottleneck or founder event) during the
initial colonization may have had a large impact on the should not lead to a bias in our frequency spectrum analyses and should be conservative for our estimates patterns of variation in samples from migrant
popula-tions. Indeed, variability in New World populations ap- of. The alternative,i.e., considering multiple substitu-tions as multiple mutasubstitu-tions with missing information, pears to be lower than in African populations, as
ex-pected after a population size contraction (Hamblin would lead to underestimates ofHandRMdue to the missing information and thus to underestimates of andVeuille1999;Andolfatto2001). In addition, the
average Tajima’sD(a commonly used summary of the (see below).
Estimatingr:Previous methods for estimatingrhave frequency spectrum of segregating mutations,cf.Tajima
1989a) at two X-linked loci is higher in non-African fit high-order polynomial curves to the available genetic and physical map data forD. simulans(Trueet al.1996; than in African populations; this also is suggestive of a
population contraction, with an associated loss of low AndolfattoandPrzeworski2000). Here, we assume a composite model, where the rate is constant across frequency alleles in migrant populations (FayandWu
1999;HamblinandVeuille1999). much of the chromosome, but is reduced near the telo-meres and centrotelo-meres (cf. Charlesworth 1996; In this article, we revisit Begun and Whitley’s data,
by explicitly considering both a model of recurrent se- AndolfattoandPrzeworski2001). Cytological map positions are obtained from Flybase (http://flybase.bio. lective sweeps and a recent bottleneck model; we also
examine additional aspects of the data besides levels of indiana.edu; Dec 1, 2000), and the DNA content for each band is estimated from the D. melanogastervalues diversity.Bravermanet al.(1995) showed that a model
of recurrent selective sweeps predicts a sharp excess of inHeinoet al.(1994;i.e., we assumeD. melanogasterand D. simulans have similar amounts of DNA per band). rare variants relative to the expectations of the standard
constant-sized Wright-Fisher neutral model (called here- There is no recombination in males, so we use sex-averaged rates.
after the null model). In our analyses, we study bothD
(Tajima 1989a) and a summary of linkage disequilib- X chromosome: Genetic map positions for 14 marker loci are taken fromSturtevant(1929). Note that these rium (i.e., the nonrandom association between alleles
at different nucleotide sites). We measure linkage dis- marker loci and the autosomal ones are distinct from the loci considered in the polymorphism analysis. The equilibrium by estimating (under the null model) the
population recombination parameter(⫽4Nr, whereN X chromosome is divided into telomeric (I), middle (II), and centromeric (III) segments (see Figure 1a). We is the effective population size andris the sex-averaged
recombination rate per base pair per generation) from model genetic distance as a linear function of physical distance from thewhite locus (2.9 Mb, 4.1 cM) to the the sequence data at each locus (CHRM,cf.Wall2000).
The parameterris estimated from a comparison ofD. fusedlocus (20.2 Mb, 59.4 cM; region II, PearsonR2⬎ 0.99). The recombination rate estimate over this interval simulans physical and genetic maps; we can then
esti-mateNasNˆ⫽ ˆ/4rˆ. Low estimated values ofNˆindicate is 3.2 cM/Mb. Recent recombination measurements (Takano-Shimizu1999) have estimated lower rates of high levels of linkage disequilibrium and vice versa. A
TABLE 1
Definitions of symbols
Symbol Meaning
D Measure of the frequency spectrum fromTajima(1989a).
N Diploid effective population size.
r Sex-averaged recombination rate per base pair per generation.
4Nr.
ˆ Estimate offrom sequence data (CHRM,cf.Wall2000).
rˆ Laboratory-based estimate ofr(seemethods).
Nˆ ˆ/4rˆ.
H Number of distinct haplotypes.
RM Minimum number of inferred recombination events (cf.HudsonandKaplan1985).
Nx One-half of the haploid effective population size for the X chromosome.
Na Diploid (i.e., one-half of the haploid) effective population size for the autosomes.
Nˆx Estimate ofNxfor the actual data usingH,RM, andrˆ(seemethods).
Nˆa Estimate ofNafor the actual data usingH,RM, andrˆ(seemethods).
Sex-averaged mutation rate per base pair per generation.
ˆ Estimate ofof 1.5⫻10⫺9per base pair per generation (seemethods).
4N.
S The observed number of segregating sites.
(1⫺ ␦) The decrease in diversity due to hitchhiking (or bottlenecks).
⌳r The rate of selective sweeps (cf.Bravermanet al.1995).
T0 Time (scaled in units of 2Ngenerations) of the bottleneck.
Nb Effective population size at timeT0.
nr Ratio ofNx/Naused for diversity estimates and timescaling of bottleneck simulations.
D AverageDvalue (for all X-linked loci or all autosomal loci).
R Likelihood-ratio statistic (seemethods).
Nˆx0 Maximum-likelihood estimate ofNxfromH,RM, andrˆfor simulated data withNx⫽N0(seemethods).
Nˆa1 Maximum-likelihood estimate ofNafromH,RM, andrˆfor simulated data withNa⫽N1(seemethods).
R* Likelihood thatNˆxandNˆafrom simulated data equal the actual population size estimates, assuming the null model.
ˆW Estimate offromWatterson(1975).
Nˆa Estimate ofNfromˆW(for the autosomes) andˆ .
Nˆx Estimate ofNfromˆW(for the X) andˆ .
netic map data of Sturtevant (1929) and Takano- If we assume that genetic distance increases with the square of physical distance from the centromere (0.0 Shimizu (1999), and assuming that genetic distance
Mb) todelta(5.4 Mb), we estimate a rate of 2.2 cM/Mb increases with the square of physical distance from the
for the miranda locus (4.9 Mb). We localized the telomere (0.0 Mb) to thewhite locus (2.9 Mb), a rate
pitchounelocus (93F16-94A1) outside of the distal break-of 1.5 cM/Mb is estimated forPgd(2.1 Mb). All other
point (93F6-7) of the fixed 3R inversion difference X-linked loci from Begun and Whitley (2000) fall
betweenD. melanogasterandD. simulansbyin situ hybrid-within the boundaries of region II.
ization on polytene chromosomes (using a method Chromosome 3R:Genetic map positions for 13 marker
modified fromSniegowskiandCharlesworth1994). loci were obtained fromOhnishiandVoelker(1979).
Since pitchoune lies outside the inversion, it resides D. simulansandD. melanogasterdiffer by a single
inver-ⵑ15.5 Mb from the centromere (i.e., region II). The sion on this chromosomal arm (breakpoints 84F1 and
remaining 12 loci on chromosome 3R considered for 93F6-7;LemeunierandAshburner1976). This
differ-polymorphism analyses are also in region II. ence has been accounted for in estimates of physical
Estimating N: We proceed assuming that the true distances between genetic markers. The chromosome
r is known for each locus. Two summaries of linkage arm is divided into two regions (see Figure 1b). The
disequilibrium areH, the observed number of distinct first region is defined as the centromeric region (I) and
haplotypes, andRM, the minimum number of inferred extends from the centromere todelta(5.4 Mb, 64 cM).
recombination events (HudsonandKaplan1985). We We define a second region (II, Figure 1b) that
encom-calculate Pr(H,RM|), or equivalently passes the rest of the chromosome arm fromdelta to
Acph-1(22.2 Mb, 134 cM), which is an estimated 16.8 Pr(H,RM|N)⬀lik(N|H,RM), Mb in length. For region II, we model genetic distance
tion size and is the mutation rate per base pair per generation.) Instead, we generate random genealogies and then place the observed number of mutations,S, on the tree. One motivation for this procedure is that Sis observed, whilemust be estimated (Hudson1993). Both methods produce similar results in other contexts (e.g.,Wall2000;WallandHudson2001). A minimum of 2 ⫻ 105 replicates were run for a large number of differentNxandNavalues at each locus. The particular values used and estimated likelihoods are available on request from the authors.
Null simulations:We compare the selective sweep and bottleneck models (described below) with a constant-sized, panmictic, neutral coalescent model (Hudson 1983). Here, we consider it more appropriate to use standard coalescent simulations (with fixed mutation rate, as opposed to a fixed number of segregating sites) for the selective sweep simulations, because they have a large variance in tree sizes. To ensure comparability, we also use standard coalescent simulations for the bot-tleneck and null simulations. To estimate, the popula-tion mutapopula-tion rate, we split the data into three classes of sites (introns, synonymous sites, and nonsynonymous sites) and assume a fixed neutral (population) mutation rate for each class. is then estimated for each class
Figure1.—Cumulative genetic distancevs.cumulative phys- usingWatterson’s(1975) estimator, separately for the ical distance based on 14 genetic markers for the X
chromo-X and 3R. some (a) and 13 genetic markers for chromosome 3R (b).
Selective sweep simulations: We consider a model The X chromosome is divided into telomeric (I) and middle
(II) and centromeric (III) segments. Thewhitelocus (2.9 Mb) where recurrent, nonoverlapping favorable alleles arise
andfusedlocus (20.2 Mb) are chosen as boundaries (dotted at sites linked to a neutral locus. The model assumes
lines). Chromosome 3R is divided into centromeric (I) and that beneficial mutations are selected immediately upon
middle (II) segments. The delta locus (5.4 Mb) defines the
introduction into the population. Our methods follow boundary between these two regions (dotted line).
those ofBravermanet al.(1995), but we run coalescent simulations with a fixed mutation rate as opposed to the “fixedS” methodology (Hudson1993;Braverman likelihood, and the joint likelihood at a collection of loci
is found by multiplying the likelihoods at the individual et al.1995). Also, our implementation incorporates in-tragenic recombination within the neutral locus, except loci. This is reasonable since none of the loci are closely
linked to each other and thus can be considered as evo- during the selective phases. The lack of intragenic re-combination during the selective phases makes little lutionarily independent. DefineNxandNaas the
effec-tive population sizes of the X and the autosomes, respec- difference to our results, so long as the neutral locus is relatively short (M. Przeworski,unpublished results). tively. Define Nˆx and Nˆa as the maximum-likelihood
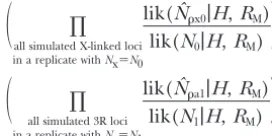
estimates for the X-linked and autosomal loci;Nˆxis the On average, it produces more linkage disequilibrium than a model that always has intragenic recombination value ofNxthat maximizes⌸all X-linked locilik(Nx|H,RM), while
Nˆais the value ofNathat maximizes⌸all autosomal locilik(Na|H, (thus is conservative for our purposes). Note that there is a typo in Equation 1 of Braverman et al. (1995), RM). We choose to summarize the data before
per-forming maximum likelihood because of computational describing the increase in frequency of the favored al-lele. Instead, we use Equation 3a inStephanet al.(1992), constraints; maximum likelihood on the full data is
com-putationally infeasible even for recombination rates which approximates the increase from frequency εto 1 ⫺ ε. We implement our simulations with ε ⫽ 1/2N one-tenth of those considered here. As it is, the
likeli-hoods for this article took several months of computing (as inBravermanet al.1995). Selection is additive, and we arbitrarily assume the selection coefficient of one time on a pair of 600 Mhz Pentium III processors.
The likelihoods were estimated from simulations that beneficial allele to bes⫽0.005. We obtain similar results for other values ofs(results not shown; see also discus-assume a neutral infinite-sites model and use the
proto-col ofHudson(1993). This method differs slightly from sion).
Denote the decrease in diversity due to hitchhiking standard coalescent simulations, which generate random
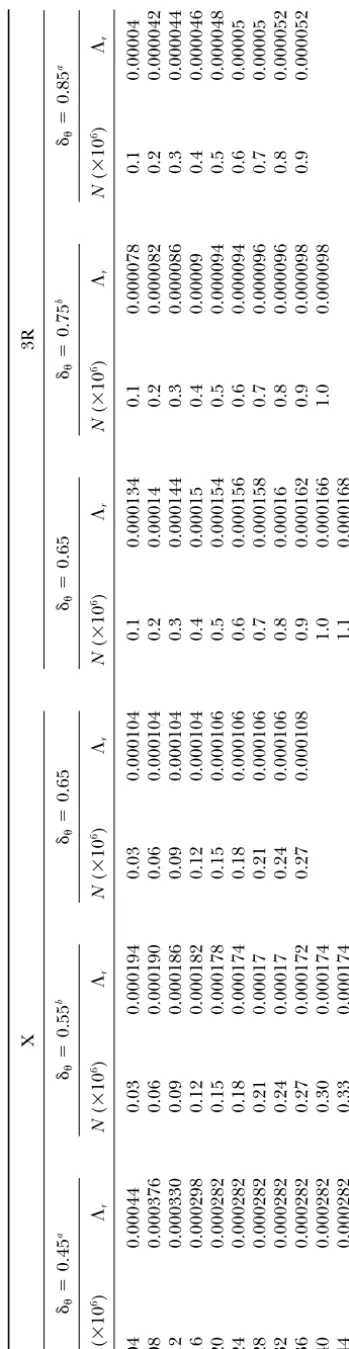
popula-and 0.45 for the X. The autosomal values were chosen to be close to the observed ratio of non-African to African diversity levels (Andolfatto2001), while the X chro-mosome values were chosen to produce a wide range of X-linked to autosomal diversity ratios. The motivation here is that African populations ofD. simulans may be roughly at equilibrium, whereas non-African popula-tions might have reduced variation due to local adapta-tion. This line of reasoning suggests a range of plausible values for␦. Note also that data from other loci suggest that the ratio of X to autosomal levels of diversity may be higher than was observed byBegun and Whitley (2000; 0.79 for all non-African data, cf. Andolfatto 2001).is estimated for each locus as in the null simula-tions and then divided by␦. The rate of selective sweeps (⌳rinBravermanet al.1995) was estimated by
simula-tion to produce the desired decrease (1⫺ ␦) in. The actual values used are listed in Table 2. In almost all of the 3R simulations and for larger values of Nx, ⌳r is
small enough that the probability of a second benefical mutation arising while a sweep is still ongoing is⬍0.05. See thediscussionfor more on the applicability of the model.
Bottleneck simulations:It is relatively straightforward to incorporate changes in population size into the coa-lescent framework (e.g., Tajima 1989b; Slatkin and Hudson1991). For the autosomes, we consider a model where the effective population size is constant in the past at 5⫻ 106. Then, at time T0, the population size immediately crashes to a bottleneck sizeNb, after which it increases exponentially to a current effective popula-tion size of 5⫻106. For a given value ofT
0, we chooseNb so that the reduction in diversity caused by a bottleneck equals the autosomal values of (1⫺ ␦) (see above). As before, we assume a fixed mutation rate for introns, synonymous sites, and nonsynonymous sites, and we estimate these rates from the data (cf.Watterson1975) before dividing by␦. Since one of our goals is to exam-ine whether bottlenecks have a stronger effect on the X, we use the estimated autosomal mutation rates for the X chromosome as well, after multiplying bynr to
correct for the chromosomal differences in effective population size. The scaled timeT0(in coalescent time units) is similarly divided bynrfor the X relative to 3R,
but the population sizes estimated from the patterns of linkage disequilibrium (described below) are assumed to freely vary. This need arises because values for X-linked loci must be close toWatterson’s (1975) esti-mate of for simulations to be comparable (i.e., levels of diversity in the simulations should be close to what is observed in the data). However, it is better to allow Nx and Na (as estimates of linkage disequilibrium) to vary freely, so that we can see what effect bottlenecks have on linkage disequilibrium. We present results for the following parameter combinations: (a)T0 ⫽ 2000 generations ago,␦⫽0.85, andnr⫽0.6; (b)T0⫽2000
TABLE 2 Rate of selective sweeps for hitchhiking simulations X 3R ␦ ⫽ 0.45 a ␦ ⫽ 0.55 b ␦ ⫽ 0.65 ␦ ⫽ 0.65 ␦ ⫽ 0.75 b ␦ ⫽ 0.85 a N ( ⫻ 10 6) ⌳r N ( ⫻ 10 6) ⌳r N ( ⫻ 10 6) ⌳r N ( ⫻ 10 6) ⌳r N ( ⫻ 10 6) ⌳r N ( ⫻ 10 6) ⌳r 0.04 0.00044 0.03 0.000194 0.03 0.000104 0.1 0.000134 0.1 0.000078 0.1 0 .00004 0.08 0.000376 0.06 0.000190 0.06 0.000104 0.2 0.00014 0.2 0.000082 0.2 0 .000042 0.12 0.000330 0.09 0.000186 0.09 0.000104 0.3 0.000144 0.3 0.000086 0.3 0 .000044 0.16 0.000298 0.12 0.000182 0.12 0.000104 0.4 0.00015 0.4 0.00009 0.4 0 .000046 0.20 0.000282 0.15 0.000178 0.15 0.000106 0.5 0.000154 0.5 0.000094 0.5 0 .000048 0.24 0.000282 0.18 0.000174 0.18 0.000106 0.6 0.000156 0.6 0.000094 0.6 0 .00005 0.28 0.000282 0.21 0.00017 0.21 0.000106 0.7 0.000158 0.7 0.000096 0.7 0 .00005 0.32 0.000282 0.24 0.00017 0.24 0.000106 0.8 0.00016 0.8 0.000096 0.8 0 .000052 0.36 0.000282 0.27 0.000172 0.27 0.000108 0.9 0.000162 0.9 0.000098 0.9 0 .000052 0.40 0.000282 0.30 0.000174 1.0 0.000166 1.0 0.000098 0.44 0.000282 0.33 0.000174 1.1 0.000168 aCorresponds to Figure 4 a. bCorresponds to Figure 4b.
TABLE 3
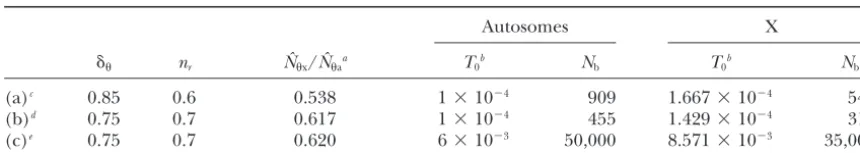
Parameter values used in bottleneck simulations
Autosomes X
␦ nr Nˆx/Nˆaa T0b Nb T0b Nb
(a)c 0.85 0.6 0.538 1⫻10⫺4 909 1.667⫻10⫺4 545
(b)d 0.75 0.7 0.617 1⫻10⫺4 455 1.429⫻10⫺4 318
(c)e 0.75 0.7 0.620 6⫻10⫺3 50,000 8.571⫻10⫺3 35,000
See the text and Table 1 for parameter definitions.
aThe observed ratio of X to autosomal diversity levels in the simulations.
bScaled in units of 4Ngenerations.
cSame parameter values as Figure 5a.
dSame parameter values as Figure 5b.
eSame parameter values as Figure 5c.
105generations ago,␦
⫽0.85, andnr⫽0.7. T0values Credibility intervals forNx/Na:To assess what range of X to autosomal diversity levels is consistent with the were chosen to correspond to recent (ⵑ200 years ago)
or ancient (ⵑ12,000 years ago) colonization of the data of Begun andWhitley (2000), we calculate ap-proximate credibility intervals forNx/Nafrom the ob-Americas,␦was chosen to be close to the ratio of
non-African to non-African autosomal diversity levels in D. sim- served numbers of segregating sites. We take a neutral mutation rate ofˆ ⫽1.5⫻10⫺9per site per generation ulans (0.76, cf.Table 3 in Andolfatto 2001), and nr
was chosen so that the relative levels of variability on (see above). As with the bottleneck simulations, we as-sume fixed population mutation rates for synonymous the X and the autosomes would be close to what was
observed byBegunandWhitley(2000). These values sites, nonsynonymous sites, and introns and estimate these (cf. Watterson1975) from the autosomal loci. are shown in Table 3. See thediscussionfor more on
the sensitivity of the results to the particular parameter We then assume that these parameters (multiplied by Nx/Na) apply to the X-linked loci as well and calculate values chosen and whether the particularnrvalues used
are plausible.
lik(Nx/Na|S⫽observed value)⬀Pr(S⫽observed value|Nx/Na). Frequency spectrum of segregating mutations:We use
D (Tajima 1989a) to test whether the observed fre- HereSrefers to the total number of inferred segregating sites summed over all X-linked loci. We employ the quency spectrum of segregating mutations is compatible
with the expectations under bottlenecks or selective standard2 approximation for⫺2 ln(L1/L0) to obtain approximate 95% credibility intervals, where L0 is the sweeps. We consider D, the average D value for the
X-linked loci and the 3R loci, separately and tabulate maximum likelihood andL1is the likelihood at an alter-native parameter value.
both the average simulatedDvalue and the proportion
Likelihood-based statistics: To quantify how consis-of simulations that haveDgreater than or equal to what
tent the actual data are with the null model, we employ is observed (see results). A total of 5000 replicates
a likelihood-ratio test. We calculate Nˆx and Nˆa from were run for each model and parameter combination.
the actual data as described earlier. Then, forNx⫽N0 We present results for only the most conservative values
andNa⫽N1, we calculate ofNxandNa.
Estimating:We take a value of 1.5⫻10⫺9per site
R(N0,N1)⫽
冢
兿
all X-linked locilik(Nˆx|H,RM)
lik(N0|H,RM)
冣 冢
all 3R loci兿
lik(Nˆa|H,RM)
lik(N1|H,RM)
冣
. per generation for the neutral mutation rate at silent
sites. This estimate is based on average per year
diver-The significance levels forRare determined by simula-gence at synonymous sites in various Drosophila species
tion for a range of N0 andN1 values. We simulate 104 comparisons (SharpandLi1989;Li1997;McVeanand
replicates of the 29 loci withNx⫽N0andNa⫽N1. Then, Vieira 2001), assuming an average of 10 generations
we calculateNˆx0andNˆa1for each replicate, whereNˆx0 per year for D. simulans (see Andolfatto and
Prze-is the value ofNxthat maximizes worski 2000 for a discussion). The neutral mutation
rate is only loosely related to our analyses, but it provides
兿
all simulated X-linked loci in a replicate withNx⫽N0
lik(Nx|H,RM) a connection between observed levels of diversity and
an estimate of the effective population size under the
andNa1is the value of Nathat maximizes null model. We assume that mutation rates do not vary
significantly among chromosomes. This assumption is
兿
all simulated autosomal loci in a replicate withNa⫽N1
lik(Na|H,RM). supported by comparisons of average divergence at
syn-onymous sites on the X and on chromosome 3R (Begun
TABLE 4
冢
兿
all simulated X-linked loci in a replicate withNx⫽N0
lik(Nˆx0|H,RM)
lik(N0|H,RM)
冣
Nˆestimates for each locusX 3R
冢
all simulated 3R loci兿
in a replicate withNa⫽N1
lik(Nˆa1|H,RM)
lik(N1|H,RM)
冣
Locus Nˆx Locus Nˆapgd 0 mir 3.5⫻106
values provides a simulated distribution of R(N0, N1)
mei-9 0 nos 1.7⫻105
values, from which we tabulate how often the simulated
ovo 0 osa 9.3⫻104
Rvalues are greater than or equal to the actualRvalue.
X 6.3⫻104 hsc70 0
For each parameter combination, we also calculate what sqh 0 cp190 0
proportion of trials have estimated population sizesNˆx0 ct 1.2⫻104 hyd 7.3⫻104 andNˆa1equal to the values estimated from the actual dec-1 7.7⫻104 rel 1.6⫻105
sn 1.3⫻105 pit 5.0⫻105
data. Define
otu 1.4⫻105 ap50 3.8⫻105
R*(N0,N1)⫽ Pr(Nˆx0⫽Nˆx|Nx⫽N0) yp3 0 tcp1 4.1⫻105
gar 0 fzo 3.2⫻105
⫻Pr(Nˆa1⫽Nˆa|Na⫽N1).
sog 0 aats 2.4⫻105
rud 0 tld 3.0⫻106
R*(N0,N1) is the likelihood of the actual effective
popu-bnb 2.5⫻105 osbp 7.6⫻105
lation size estimates (usingH andRM) when data are
mei-218 0
generated under the null model (withNx⫽N0andNa⫽
For comparison, the estimates ofNfrom levels of diversity
N1). From our simulations, we plot the value ofR* as a
areNˆx⫽2.5⫻106andNˆa⫽5.0⫻106.
function ofN0 andN1.
Ideally, we would like to perform the same analyses under the selective sweep and bottleneck models, but
morphism data than expected from standard estimates calculating the relevant likelihoods is computationally
of,r, and. Note that the low values in Table 4 are prohibitive. Instead, we useR* again, with all likelihoods
not the result of the particular properties ofˆ ⫽CHRM. calculated assuming the null model, even though the
In fact, simulations (under the standard equilibrium simulated data are generated under a different model.
neutral model) show that for the small sample sizes As before, R* is a measure of how likely it is for the
considered here,CHRMis biased upward, suggesting that simulated data to produce the actual estimated
popula-theNˆvalues in Table 4 might on average be overesti-tion sizes. A total of 104 replicates are run for each
mates (J. D. Wall,unpublished results). parameter combination. Otherad hocstatistics were
con-Contrasting patterns between X and autosomes: Be-sidered; they all produced similar results (results not
cause patterns of variation vary greatly from locus to shown).
locus even when the underlying parameters are the same, the precision of the estimate ofNcan be greatly
RESULTS increased by combining information from multiple loci.
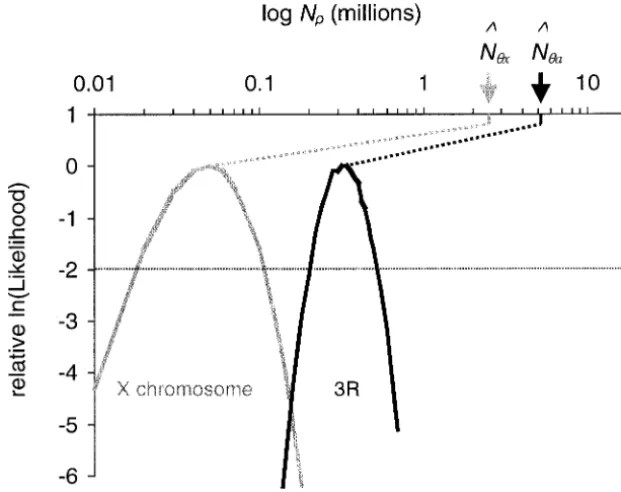
Figure 2 shows the relative log likelihoods ofN for all
Excess linkage disequilibrium on all chromosomes:
of the X-linked loci (the curve on the left) and all of Table 4 shows the estimates ofNˆon the basis ofH,RM,
the autosomal loci (the curve on the right). For ease andrˆfor each locus. One observation that is
immedi-of comparison, the curves have been normalized so that ately apparent is that these values are systematically less
their maxima are at 0. It is striking how distinct the two than estimates ofN based on estimates of the neutral
likelihood curves are:Nˆa (⫽ 3.2 ⫻ 105) is more than mutation rate and observed levels of polymorphism. For
six times Nˆx (⫽ 0.5 ⫻ 105). The horizontal line in example, if we takeˆ ⫽1.5⫻10⫺9/bp/generation for
Figure 2 shows the ⵑ95% credibility intervals (using silent sites (see methods) and ⫽ 0.030 per
synony-the standard asymptotic approximations for maximum mous base pair (estimated from all of the autosomal
likelihood) for the chromosome-specific estimates ofN; loci considered in this article, cf. Watterson 1975),
the two intervals do not overlap. A nonparametric rank then we obtain the estimateNˆa⫽5.0⫻106. The
corre-order test shows that the locus-specificNˆestimates for sponding estimate from the X-linked loci isNˆx⫽2.5⫻
the X-linked loci are indeed less than the autosomal 106. In contrast, 26 out of 29 loci haveNˆ
estimates at
estimates (Table 4, Mann-WhitneyU-test;P⬍0.002). least an order of magnitude less than the corresponding
Note that since males carry only one X chromosome, Nˆ estimate. This discrepancy between Nˆ (estimated
we do not necessarily expectNxto equalNa. If male and from linkage disequilibrium) andNˆ (estimated from
female effective population sizes are equal, then 4Nx⫽ levels of diversity) has been noted before with different
3Na. However, there are many possible factors that may Drosophila data and slightly different methodology
cause the two effective population sizes to be unequal (AndolfattoandPrzeworski2000) and implies that
Charles-Figure 2.—Plots of the relative values of
ln(lik(N|H, RM)) as a function ofNfor the
X-linked loci (curve on the left) and the 3R loci (curve on the right). Both have been nor-malized so that their maxima are at 0.
Corre-sponding estimates of Nˆ are indicated by
arrows. The horizontal line is at⫺1.92, which
delineates theⵑ95% credibility intervals (see
methods). A minimum of 2⫻105replicates were run for each locus and each value of
N. The values of N considered were 1.0 ⫻
104–8.0⫻104(increment 1.0⫻104) and 1.0⫻
105–7.0⫻105(increment 2.0⫻104).
worth2001). If chromosomal effective population sizes The chromosomal difference in diversity levels (BegunandWhitley2000), the chromosomal differ-are proportional to silent siteˆWvalues (cf.Watterson
1975), then, from the data analyzed here, Nˆx/Nˆa ⬇ ence in levels of linkage disequilibrium (this study), and the overall high levels of linkage disequilibrium 0.50. When all sites are considered (with different rates
for synonymous sites, nonsynonymous sites, and in- (AndolfattoandPrzeworski2000; this study) are all ways in whichD. simulansdata do not conform to the trons), thenNˆx/Nˆa⬇0.59. Theⵑ95% credibility
inter-val forNx/Nabased on all sites (seemethods) is 0.43– expectations of the standard equilibrium neutral model. We now examine how two simple alternative models (a 0.69. Under neutrality, Nx/Na⫽ 0.50 is unexpected,
regardless of how biased the gender-specific population recurrent selective sweep model and a recent bottleneck model) are expected to affect the levels of diversity sizes are (Caballero1995). This observation is in part
what ledBegunandWhitley(2000) to conclude that and linkage disequilibrium on different chromosomes. Though the true history of D. simulans populations is natural selection must be acting to reduce the levels of
variation on the X relative to the autosomes. Our results likely to be much more complex, these models should help us gain insight into the effects of demography demonstrate that the difference in the levels of linkage
disequilibrium between the X and 3R (Nˆx/Nˆa⫽0.16) and natural selection on the patterns of segregating variation.
is substantially greater than the difference in their
diver-sity levels. Sweep model:We considered all combinations of␦⫽
0.85, 0.75, and 0.65 for 3R and␦⫽0.65, 0.55, and 0.45 Figure 3a shows thePvalue ofR(seemethods) as a
function of Nx and Na. For all population sizes where for the X. All nine sets of simulations produced very similar results, and we display only a representative pair 2NxⱖNa, the actual value ofRis significantly too large.
This suggests that there is significantly more linkage of them here. Figure 4 shows the value ofR* as a func-tion ofNxandNa. Figure 4a has␦⫽ 0.85 for 3R and disequilibrium on the X than on 3R, even after
correct-ing for the differences in effective population sizes sug- ␦⫽ 0.45 for the X, while the corresponding␦values in Figure 4b are 0.75 and 0.55, respectively. We find gested by diversity levels. For the same population sizes,
Figure 3b shows the proportion of trials for whichNˆx0⫽ that recurrent selective sweeps do not lead to striking increases in levels of linkage disequilibrium, as mea-0.5 ⫻ 105 and Nˆ
a1 ⫽ 3.2 ⫻ 105 (see methods). The
different shading categories were chosen so that in Fig- sured (see also Przeworski 2002). In particular, the increase in averageNˆx0andNˆa1in the sweep simulations ure 3, a and b were as similar in appearance as possible;
the lightest areas on both graphs represent areas of is no more than what is expected from the decrease in levels of diversity. In other words, the estimated ratio parameter space that are compatible with the data. For
all population sizes where 2Nxⱖ Na, the value ofR* is of the number of recombination events to the number of mutation events, ˆ/ˆW, does not vary much when quite small (i.e.,R*⬍8.0⫻10⫺4). If instead we repeat
the rank order test with the null hypothesis that 2Nx⫽ data are generated under either the null model or the recurrent selective sweep model. Exploratory simula-Na, then the two chromosomes are still significantly
Figure4.—R* as a function ofNxandNaunder a model
Figure3.—Unusualness of the data as a function ofNxand of recurrent selective sweeps. a has␦⫽0.85 for 3R and␦⫽ Na. a plots thePvalue ofR, while b plots the value ofR*. (䊐) 0.45 for the X, while b has␦⫽0.75 for 3R and ␦⫽0.55
P⬎0.05; ( ) 0.01⬍P⬍0.05; (䊏)P⬍0.01. Seemethods for the X. Seemethodsfor more details. The shading
catego-for details. The cutoffs catego-for the different shading categories in ries are the same as in Figure 3b.
b were chosen so that the appearances of the two figures were
as similar as possible. (䊐)R*⬎10⫺3; ( ) 2⫻10⫺4⬍R*⬍
10⫺3; (䊏)R*⬍2⫻ 10⫺4. For comparison, Nˆx⫽25 ⫻105
(D) greater than or equal to what is actually observed.
andNˆa⫽50⫻105.
Under recurrent hitchhiking, the average simulatedD is negative, as expected. The actualDfor the X-linked loci is significantly too high (P⬍0.004, one-tailed test), wider range of sample sizes and relative recombination
while the trueDfor the autosomal loci is not unusual. rates than considered for theD. simulansdata (results
Bottleneck model:Due to computational constraints, not shown). Thus, this simple model for repeated
epi-we consider only a few parameter combinations. Figure sodes of positive selection seems to explain neither the
5 showsR* as a function ofNxandNafor three different overall high levels of linkage disequilibrium nor the
examples. As can be seen, recent bottlenecks are consis-chromosomal difference in levels of linkage
disequilib-tent with much higher effective population sizes. Equiva-rium.
lently, recent bottlenecks cause an increase in observed Previous work has shown that recurrent selective
levels of linkage disequilibrium. For example, two out sweeps lead to a strong skew in the frequency spectrum
of three (Figure 5, a and b) are consistent withNa ⫽ toward an excess of rare variants (Braverman et al.
5.0⫻106, while one out of three (Figure 5b) is consistent 1995). The D. simulans data of Begun and Whitley
with Nx ⫽ 2.5 ⫻ 106. In addition, at least for some (2000), on the other hand, show no marked skew in
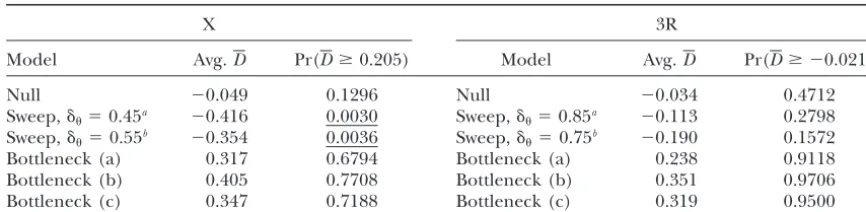
parameter values (e.g., those of Figure 5b), the average the frequency spectrum. The average value of Tajima’s
ratio ofNˆx0/Nˆa1is much larger than what was estimated Dfor the 15 X-linked loci is 0.205, while the average
under the null model (0.16) and closer to the expecta-value for the 14 loci on 3R is⫺0.021. Table 5 shows what
TABLE 5
Frequency spectrum test for various models
X 3R
Model Avg.D Pr(Dⱖ0.205) Model Avg.D Pr(Dⱖ ⫺0.021)
Null ⫺0.049 0.1296 Null ⫺0.034 0.4712
Sweep,␦⫽0.45a ⫺0.416 0.0030 Sweep,␦
⫽0.85a ⫺0.113 0.2798
Sweep,␦⫽0.55b ⫺0.354 0.0036 Sweep,␦⫽0.75b ⫺0.190 0.1572
Bottleneck (a) 0.317 0.6794 Bottleneck (a) 0.238 0.9118
Bottleneck (b) 0.405 0.7708 Bottleneck (b) 0.351 0.9706
Bottleneck (c) 0.347 0.7188 Bottleneck (c) 0.319 0.9500
Underlined values haveP⬍0.01. See the text and Tables 2 and 3 for the details of the models.
aSame parameter values as in Figure 4a.
bSame parameter values as in Figure 4b.
fewer X chromosomes than autosomes, a bottleneck is demographic history of North American populations of more severe for the X (i.e., the minimal population size D. simulans, but as a human commensal,D. simulansis is smaller). This leads to both a greater increase in unlikely to have arrived in North America before hu-linkage disequilibrium and a greater reduction in levels mans did. The first people in the Americas are thought of variability on the X relative to the autosomes. In to have crossed via the Bering Strait ⵑ14,000–15,000 principle, a recent bottleneck might explain both the years ago (see, e.g., Jones et al. 1994). If we assume chromosomal differences in levels of linkage disequilib- an average of 10 generations a year, then T0 ⫽ 2000 rium and the overall high levels of linkage disequilib- generations ago and 1.2 ⫻ 105 generations ago corre-rium, but it remains to be seen whether the parameter spond to 200 years ago and 12,000 years ago, respec-values required are plausible (seediscussion). tively. However, it seems improbable that D. simulans The effect of a bottleneck on the frequency spectrum crossed via the Bering Strait, since this would require is complex. For results from a similar model, see Fay travel through thousands of miles of harsh Arctic andWu(1999). During and immediately after a bottle- weather and dependence on humans with a low popula-neck, a deficiency of rare variants is expected, but as tion density. Thus, it may be more likely thatD. simulans time passes, the accumulation of recent mutations leads was introduced into the Americas after the European to an excess of low frequency segregating sites. For the conquestⵑ500 years ago. No one knows whenD. sim-small values ofT0considered here, bottlenecks are ex- ulansfirst started crossing the Atlantic as stowaways on pected to lead to positive Tajima’sDvalues (more so for ships, but it seems plausible that at first the number of the X than the autosomes). Table 5 shows the average of migrants was limited. Both the volume of traffic and the simulated D values, as well as the proportion of the cargo composition changed slowly over time; at simulatedD values greater than or equal to the actual some point in the past, successful migration to the Amer-values. As is expected under a recent bottleneck, the icas must have been possible but difficult. So, indepen-actualDis higher for the X-linked loci than it is for the dent of genetic data, a recent bottleneck in the history autosomal loci. In all cases, the actualDvalues for both of American populations of D. simulansseems to be a the X and 3R are within the middle 95% of the simulated reasonable demographic model. We chose to model distribution, thoughDfor the 3R loci is close to being a single founder event, followed by rapid population
significantly too low. growth. Perhaps a more realistic model would have
many founder events, spread out over time (continuing to the present day). However, the earliest migrants might
DISCUSSION have contributed a disproportionally large amount to
the gene pool of the new population; the newly founded This study analyzes sequence data from a North
Amer-population may have had ample opportunity to grow, ican population ofD. simulansand documents that the
since 500 years ago there were many settled human high observed levels of linkage disequilibrium and the
communities in the Americas. If so, later migrants would chromosomal differences in levels of linkage
disequilib-then be less important, since they would contribute rium are not expected under the standard null model.
proportionally very little to the genetic makeup of the Both demographic and selective departures from the
population. null model are possible explanations, and we
consid-In summary, our simple bottleneck model probably ered two of these alternatives to the null model. We
captures some fundamental element of the population describe below some of the difficulties associated with
history of North American D. simulans.Assuming that assessing whether these models are appropriate.
equi-librium, a simple bottleneck model can, at least qualita- tion in the data analyzed in this article. The effect that a bottleneck has on levels of diversity, linkage disequilib-tively, account for three essential features of the
Califor-nian D. simulans data: (1) a genome-wide increase in rium, and the frequency spectrum is quite sensitive to many unknown parameters. Exploratory simulations levels of linkage disequilibrium; (2) more linkage
dis-equilibrium on the X than on the autosomes; and (3) suggest that decreasing (1⫺ ␦) orT0(while keeping the other parameters constant) leads to a greater increase in a skew in the frequency spectrum toward more common
variants on the X relative to the autosomes. linkage disequilibrium, while decreasing nr leads to
more of an effect on the X relative to the autosomes. However, this does not necessarily mean that a
bottle-neck is a sufficient explanation for the patterns of varia- Also, if the current effective population size andT0are larger, there is little effect on levels of linkage disequilib-rium. For example, if the currentNis 1⫻109, thenT0 must be quite small (e.g.,T0ⱕ4⫻103generations) for a bottleneck to have an appreciable effect on estimates of linkage disequilibrium (results not shown).
Perhaps more worrisome is the fact that the ratio of effective sizes for the X and the autosomes in the ances-tral population (nr) must be low (i.e., ⱕ0.75) to be
consistent with the observed ratio of diversities in the Californian population (i.e., ⱕ0.69, the approximate upper bound forNˆx/Nˆa). In the bottleneck simulations we present (Table 2, Figure 5), we assume 0.6ⱕ nrⱕ
0.7. In other words, we assume that the male effective population size is greater than or equal to the female effective population size. This situation may be unlikely for Drosophila where sexual selection is expected to reduce the effective population size of males relative to females (CrowandMorton1954). On the other hand, Charlesworth(2001) pointed out that if females are generally in poor breeding condition (as observed by Boule`treau 1987 in an European population), then nrwill be reduced. This may counter the effects of sexual
selection in males. In fact, for non-AfricanD. melanogas-ter,Charlesworth(2001) estimatesnr⫽0.73 and 0.64,
with or without sexual selection on males, respectively. Thus, the prebottleneck nr may have been low if the
founding population was non-African (e.g., European). Unfortunately, we have little information about the rela-tive variance in male and female reproducrela-tive successes in Drosophila populations or the origin of this particular North American population ofD. simulans. Under the simplest assumption of equal numbers of males and females (i.e.,nr⫽0.75), a severe and recent bottleneck
can still produce an X/autosome ratio of diversities that is consistent with the findings ofBegunandWhitley (2000); ifT0 ⫽ 2000 generations and ␦ ⫽ 0.75, then Nˆx/Nˆa⫽ 0.684.
Positive selection models:An alternative to a purely demographic explanation is that natural selection for adaptation has influenced the observed patterns of vari-ation.D. simulansoriginated in Africa (DavidandCapy
Figure5.—R* as a function ofNxandNaunder a model
of a recent population bottleneck. (a)T0⫽2000 generations
ago,␦⫽0.85, andnr⫽0.6. (b)T0⫽2000 generations ago,
␦⫽0.75, andnr⫽0.7. (c)T0⫽1.2⫻105generations ago,
␦⫽0.85, andnr⫽0.7. The shading categories are the same
1988;Lachaise et al.1988), and some adaptive evolu- produce the excess of linkage disequilibrium that is observed (given the proposed reduction in X-linkedvs. tion must have occurred while populations coped with
different environments and colder climates. We mod- autosomal diversity), the relevant question is whether larger values ofNxandNaare compatible with the data. eled natural selection by simulating recurrent,
nonover-lapping selective sweeps linked to a neutral locus. Al- The answer to this question is still no; Figure 4 shows thatR* is very small when bothNxandNaare large (i.e., though under certain assumptions (discussed inBegun
and Whitley 2000) this model can reduce X-linked when the nonoverlapping sweep assumption is met). The problem of overlapping sweeps might be exacer-(relative to autosomal) levels of diversity, our
simula-tions show that it is inconsistent with other facets of the bated if the rate of selective events over time is not constant or the strength of selection is weaker. The data: A simple selective sweep model leads to an excess
of rare variants and no appreciable increase in levels of general effects of a recurrent selective sweep model on the frequency spectrum and levels of linkage disequilib-linkage disequilibrium. In contrast, the data show no
skew in the frequency spectrum, high levels of linkage rium are not very sensitive to s, as long as s ⱖ 0.002 (results not shown). However, for smaller selection coef-disequilibrium on 3R, and extremely high levels of
link-age disequilibrium on the X. ficients (e.g.,s⬍0.002) and the small population sizes considered here, the simple selective sweep model be-We chose the simple recurrent sweep model partly
because it has been carefully studied before (e.g., comes inappropriate due to the large number of over-lapping selective events. Also, if natural selection is be-Kaplan et al.1989;Braverman et al.1995) and partly
because it is reasonably easy to implement in the coa- ing driven by adaptation to new environments, then the rate of introduction of favorable alleles might depend lescent context (where many replicates can be run
quickly). However, it is not clear whether the model is heavily on the location and movement of populations and would be much higher at some times than at others. appropriate for Drosophila data. For example, our
sim-ulations assume that selection is additive, even though Without any independent source of information on the relevant parameters, we have no idea how often selective one of the main arguments for greater hitchhiking
effects on the X invokes dominance effects (see, e.g., sweeps may have overlapped and interfered with each other over time. We also have no idea how multiple Begun and Whitley2000). This facet is not a major
concern, since any process with recurrent, rapid fixation competing sweeps (perhaps in a subdivided population) affect levels of variation, the frequency spectrum, or of new alleles is likely to produce a similar pattern in
sequence data (i.e., a skew in the frequency spectrum patterns of linkage disequilibrium, or for that matter how sweeps in a subdivided population behave. For any toward rare alleles and no increase in levels of linkage
disequilibrium, using the methods in this article). of these models to be viable explanations of the data, they would need to increase levels of linkage disequilib-Another concern is the frequency of selective sweeps.
We have chosen simulation parameters that allow few rium on both chromosomes (though much more on the X than the autosomes). They would also need to overlapping sweeps. We calculate [similar to (6) in
Bravermanet al.1995] that the probability that a sec- be able to cause a decrease in levels of variability (on the X) without causing a skew in the frequency spectrum ond selective sweep starts before a given one has finished
is⬎0.05 for values of Nx ⱕ2.4 ⫻ 105and Naⱕ 1.5 ⫻ toward rare variants. This seems unlikely unless many of the sweeps are ongoing. Further work will explore 105. Most of these overlaps consist either of new
benefi-cial alleles arising after an older benefibenefi-cial allele has how such models affect patterns of sequence polymor-phism.
already swept to high frequency (but not fixed) and/
or two beneficial alleles that are not tightly linked to Another possibility is that adaptive evolution operated on standing variation, instead of newly arising muta-each other; in both cases, the two sweeps are essentially
independent. In general, if s and ␦ are fixed, then tions. If so, the rate of adaptation on the X might actually be slower than the rate on the autosomes (Orr and multiple sweeps are more likely to overlap as N
de-creases. This happens because a selective sweep with a Betancourt 2001). Nothing is known yet about the predictions of such a model regarding levels of diversity, given value ofshas an effect on standing levels of linked
neutral diversity that is only weakly dependent on N, the frequency spectrum, or levels of linkage disequilib-rium on different chromosomes. But, as before, it is while sweeps take longer (in units of scaled time) in
smaller populations, so are more likely to overlap. Note unlikely that this model could decrease levels of diversity without affecting the frequency spectrum, unless many that we fixed␦so that the effect of selection would be
comparable across different values ofN. If instead we selective events have not yet led to fixation of the favored type.
were to fix the rate of introduction of advantageous
alleles, then there would be more sweeps asNincreases, Finally, natural selection might operate in a way that is fundamentally different from the simple directional and ␦ would decrease with increasing N; because we
have no prior knowledge regarding⌳r, this implementa- selection models discussed above. However,Gillespie
(1997) examined a range of selective models and found tion does not seem to be appropriate. Since our goal
Andolfatto, P.,andM. Przeworski,2000 A genome-wide depar-frequency spectrum (see,e.g., his Figure 3). This makes
ture from the standard neutral model in natural populations of it less likely that any of them are consistent with the Drosophila. Genetics156:257–268.
observed frequency spectra and levels of diversity (leav- Andolfatto, P.,andM. Przeworski,2001 Regions of lower cross-ing over harbor more rare variants in African populations of ing aside the issue of whether they are consistent with
Drosophila melanogaster.Genetics158:657–665.
the observed levels of linkage disequilibrium). An alter- Aquadro, C. F., D. J. BegunandE. C. Kindahl,1994 Selection, native put forward by Begun and Whitley (2000) is recombination, and DNA polymorphism in Drosophila, pp. 46–56 inNon-Neutral Evolution: Theories and Molecular Data, edited byB.
that the rapid changes in frequency (without fixation)
Golding.Chapman & Hall, New York.
of X-linked meiotic drive or sexually antagonistic alleles Begun, D. J.,andC. F. Aquadro,1992 Levels of naturally occurring may also account for reduced levels of variability on the DNA polymorphism correlate with recombination rates in D.
melanogaster.Nature356:519–520. X relative to the autosomes. Nothing is known about
Begun, D. J.,andP. Whitley,2000 Reduced X-linked nucleotide how such a model would affect the frequency spectrum polymorphism inDrosophila simulans.Proc. Natl. Acad. Sci. USA or levels of linkage disequilibrium. 97:5960–5965.
Begun, D. J., P. Whitley, B. L. Todd, H. M. Waldrip-DailandA. G. Conclusions: Any evolutionary model that seeks to
Clark,2000 Molecular population genetics of male accessory be a sufficient explanation for the North AmericanD. gland proteins in Drosophila. Genetics156:1879–1888. simulans data must simultaneously be consistent with Boule`treau, J.,1987 Ovarian activity and reproductive potential
in a natural population ofDrosophila melanogaster.Oecologia35:
the observed levels of diversity, frequency spectra, and
319–342. levels of linkage disequilibrium on the X and autosomes.
Braverman, J. M., R. R. Hudson, N. L. Kaplan, C. H. Langleyand A simple bottleneck model can do so, but only ifnrⱕ W. Stephan,1995 The hitchhiking effect on the site frequency
spectrum of DNA polymorphisms. Genetics140:783–796. 0.75 and the population size reduction was severe and
Caballero, A.,1995 On the effective size of populations with sepa-recent. It is not clear how reasonable these conditions
rate sexes, with particular reference to sex-linked genes. Genetics are. On the other hand, a simple hitchhiking model 139:1007–1011.
Charlesworth, B.,1996 Background selection and patterns of ge-can be rejected because it is inconsistent with both the
netic diversity inDrosophila melanogaster.Genet. Res.68:131–149. observed frequency spectra and levels of linkage
disequi-Charlesworth, B.,2001 The effect of life-history and mode of librium. inheritance on neutral genetic variability. Genet. Res.77:153–
The relative role of natural selection in shaping pat- 166.
Charlesworth, B., M. T. MorganandD. Charlesworth,1993 terns ofD. simulansgenetic variation remains unknown.
The effect of deleterious mutations on neutral molecular varia-More work needs to be done to explore how other tion. Genetics134:1289–1303.
models of natural selection affect patterns of variability. Crow, J.,andN. E. Morton,1954 Measurement of gene frequency drift in small populations. Evolution9:202–214.
These models might examine,e.g., adaptation in
struc-Crow, J. F.,andM. J. Simmons,1983 The mutational load in Dro-tured populations, natural selection in variable environ- sophila, pp. 1–35 inThe Genetics and Biology of Drosophila, Vol. 3C, ments (cf.,Gillespie1991, 1997;OrrandBetancourt edited byM. Ashburner, H. O. CarsonandJ. N. Thompson.
Academic Press, London. 2001), and/or interference between multiple favorable
David, J. R.,andP. Capy,1988 Genetic variation ofDrosophila melano-alleles. This work will give us a sense of which models gasternatural populations. Trends Genet.4:106–111.
are plausible forD. simulansdata. Fay, J. C.,andC.-I Wu,1999 A human population bottleneck can account for the discordance between patterns of mitochondrial It will be much easier to testD. simulansevolutionary
versus nuclear DNA variation. Mol. Biol. Evol.16:1003–1005. models once sequence polymorphism data from other Gillespie, J. H.,1991 The Causes of Molecular Evolution(Oxford Series (predominantly African) populations are gathered. in Ecology and Evolution). Oxford University Press, Oxford, UK.
Gillespie, J. H.,1997 Junk ain’t what junk does: neutral alleles in These data might allow one to infer whether migration
a selected context. Gene205:291–299. to the Americas occurred primarily from Europe or
Hamblin, M. T.,andM. Veuille,1999 Population structure among from Africa and would help us construct a reasonable African and derived populations ofDrosophila simulans: evidence for ancient subdivision and recent admixture. Genetics153:305– demographic null model. Only by explicitly considering
317. demography will we be able to start deciphering the
Heino, T. I., A. O. SauraandV. Sorsa,1994 Maps of the salivary contribution of natural selection for adaptation to dif- gland chromosomes ofDrosophila melanogaster.Dros. Inf. Serv.73:
621–738. ferent populations ofD. simulans.
Houle, D., K. A. Hughes, S. Assimacopoulos andB.
Charles-We thank B. Charlesworth and two anonymous reviewers for helpful worth,1997 The effects of spontaneous mutation on quantita-suggestions on an earlier version of this manuscript. J.D.W. and M.P. tive traits. II. Dominance of mutations with effects on life-history were supported by National Science Foundation Postdoctoral Fellow- traits. Genet. Res.70:27–34.
Hudson, R. R.,1983 Properties of a neutral allele model with intra-ships in Bioinformatics. P.A. was supported by a European Molecular
genic recombination. Theor. Popul. Biol.23:183–201. Biology Organization Postdoctoral Fellowship.
Hudson, R. R.,1993 The how and why of generating gene genealo-gies, pp. 23–36 inMechanisms of Molecular Evolution, edited byN. TakahataandA. G. Clark.Japan Scientific Society, Tokyo.
Hudson, R. R.,andN. L. Kaplan,1985 Statistical properties of the LITERATURE CITED
number of recombination events in the history of a sample of DNA sequences. Genetics111:147–164.
Aguade´, M., N. MiyashitaandC. H. Langley,1989 Reduced
varia-Hudson, R. R.,andN. L. Kaplan,1995 Deleterious background tion in the yellow-achaete-scuteregion in natural populations of
selection with recombination. Genetics141:1605–1617. Drosophila melanogaster.Genetics122:607–615.
Jones, S., R. MartinandD. Pilbeam(Editors), 1994 The Cambridge
Andolfatto, P.,2001 Contrasting patterns of X-linked and
autoso-Encyclopedia of Human Evolution.Cambridge University Press, Cam-mal nucleotide variation inDrosophila melanogasterandDrosophila
Kaplan, N. L., R. R. HudsonandC. H. Langley,1989 The “hitch- Sharp, P. M.,andW. H. Li,1989 On the rate of DNA sequence evolution in Drosophila. J. Mol. Evol.28:398–402.
hiking effect” revisited. Genetics123:887–899.
Kimura, M.,1983 The Neutral Theory of Molecular Evolution.Cam- Slatkin, M.,andR. R. Hudson, 1991 Pairwise comparisons of mito-chondrial DNA sequences in stable and exponentially growing bridge University Press, Cambridge, UK.
Lachaise, D., L. M. Cariou, J. R. David, F. Lemeunier, L. Tsacas populations. Genetics129:555–562.
Sniegowski, P.,andB. Charlesworth,1994 Transposable element et al., 1988 Historical biogeography of theDrosophila melanogaster
species subgroup. Evol. Biol.22:159–225. numbers in cosmopolitan inversions from a natural population inDrosophila melanogaster.Genetics137:815–827.
Lemeunier, F.,andM. A. Ashburner,1976 Relationships within
the melanogaster species subgroup of the genus Drosophila (So- Stephan, W., T. H. E. Wiehe,andM. W. Lenz,1992 The effect of strongly selected substitutions on neutral polymorphism: analyti-phophora). II. Phylogenetic relationships between six species
based upon polytene chromosome banding sequences. Proc. R. cal results based on diffusion theory. Theor. Popul. Biol.41:
237–254. Soc. Lond. Ser. B Biol. Sci.193:275–294.
Lewontin, R. C.,1974 The Genetic Basis of Evolutionary Change.Co- Sturtevant, A. H.,1929 The genetics ofDrosophila simulans. Carne-gie Inst. Wash.399:1–62.
lumbia University Press, New York.
Li, W. H.,1997 Molecular Evolution.Sinauer Press, Sunderland, MA. Tajima, F.,1989a Statistical method for testing the neutral mutation hypothesis by DNA polymorphism. Genetics123:585–595.
Maynard Smith, J.,andJ. Haigh,1974 The hitch-hiking effect of
a favourable gene. Genet. Res.23:23–35. Tajima, F.,1989b The effect of change in population size on DNA polymorphism. Genetics123:597–601.
McVean, G. A. T.,andJ. Vieira,2001 Inferring parameters of
muta-tion, selection and demography from patterns of synonymous Takano-Shimizu, T.,1999 Local recombination and mutation ef-fects on molecular evolution in Drosophila. Genetics.153:1285– site evolution in Drosophila. Genetics157:245–257.
Moriyama, E. N.,andJ. R. Powell,1996 Intraspecific nuclear DNA 1296.
True, J. R., J. M. MercerandC. C. Laurie,1996 Differences in variation in Drosophila. Mol. Biol. Evol.13:261–277.
Ohnishi, S.,andR. A. Voelker,1979 Comparative studies of allo- frequency and distribution among three sibling species of Dro-zyme loci in Drosophila simulans and D. melanogaster.II. Gene sophila. Genetics142:507–523.
arrangement on the third chromosome. Jpn. J. Genet.54:203– Wall, J. D.,2000 A comparison of estimators of the population 209. recombination rate. Mol. Biol. Evol.17:156–163.
Orr, H. A.,andA. J. Betancourt,2001 Haldane’s sieve and adapta- Wall, J. D.,andR. R. Hudson,2001 Coalescent simulations and tion from the standing genetic variation. Genetics157:875–884. statistical tests of neutrality. Mol. Biol. Evol.18:1134–1135.
Przeworski, M.,2002 The signature of positive selection at ran- Watterson, G. A.,1975 On the number of segregating sites in domly chosen loci. Genetics160:1179–1189. genetical models without recombination. Theor. Popul. Biol.7:
Przeworski, M., J. D. WallandP. Andolfatto,2001 Recombina- 256–276. tion and the frequency spectrum inDrosophila melanogasterand