ABSTRACT
PUROHIT, YOJNA. Atomistic and First Principles Studies of Pb Segregation to Al Grain Boundaries and its Influence on Thermal Stability and Mechanical Behavior. (Under the direction of Prof. Donald W. Brenner).
Nanostructured materials have received much interest because they exhibit different properties compared to coarse-grained polycrystals of the same material. Many enhancements in the properties of nanocrystalline materials due to fine grain size are lost if grain growth occurs. Enrichment of the grain boundaries (segregation) with solute atoms with limited solubilities has been shown to diminish or even reverse the free energy available for grain growth by forming metastable structures. Al-Pb is an immiscible alloy system with a positive energy of segregation and therefore is a potential candidate for segregation-induced grain boundary stabilization.
Pb impurities can help stabilize nanocrystalline Al against grain growth. Subsequent calculations of the energies of Pb clusters embedded in an Al matrix, in a cuboctahedral configuration, using the same potential, predict a cross-over cluster size of approximately 2.8 nm below which Pb prefers to segregate to grain boundaries compared to forming clusters in the Al matrix.
To study the stabilization of Al grain boundaries caused by segregation of Pb impurities, grain boundary energy as a function of Pb content was investigated for two high symmetry Σ
5 {210} and Σ 5 {310} Al tilt grain boundaries. Calculations for grain boundary energies were performed using atomistic MEAM and Density Functional Theory calculations. Results from both of these methods showed a reduction in grain boundary energy with an increase in Pb content.
atomistic GLUE calculation at intermediate angles within about 0.08 J/m2 and 0.06 J/m2, respectively. The predictions given by the MEAM+DSUM and the GLUE+DSUM for an intermediate grain boundary containing Pb at 22.6o, along with matching the full atomistic MEAM and GLUE result also matched the first principles result reasonably well. The multiscale DSUM predicts a strong dependence of the grain stabilization energy on tilt angle.
Atomistic and First Principles Studies of Pb Segregation to Al Grain
Boundaries and its Influence on Thermal Stability
and Mechanical Behavior
by Yojna Purohit
A dissertation submitted to the Graduate Faculty of North Carolina State University
in partial fulfillment of the requirements for the Degree of
Doctor of Philosophy
Materials Science and Engineering Raleigh, North Carolina
2008
APPROVED BY:
--- --- Prof. Ronald O. Scattergood Prof. Carl C. Koch
DEDICATION
BIOGRAPHY
ACKNOWLEDGEMENTS
I would like to express my sincere gratefulness to my advisor Prof. Donald W. Brenner for his guidance, encouragement, suggestion and discussion. I am also thankful to Prof. Ronald O. Scattergood for his support and guidance to this research.
I would also like to thank Prof. Carl C. Koch and Prof. John M. Mackenzie for agreeing to serve on my PhD thesis committee.
I would like to acknowledge National Science Foundation for financial support. In addition, I would like to acknowledge my coworkers, D. L. Irving, Lipeng Sun and C. W. Padgett, for their help. I am also thankful to Ms. Edna Deas for her help in administrative matters.
TABLE OF CONTENTS
LIST OF TABLES ...x
LIST OF FIGURES ... xiv
CHAPTER 1 – INTRODUCTION ...1
1.1INTRODUCTION ...1
1.1.1 PROPERTIES OF NANOSTRUCTURED MATERIALS ...7
1.1.1.1STRENGTH AND HARDNESS...7
1.1.1.2DUCTILITY ...9
1.1.1.3ELASTIC PROPERTIES...10
1.1.1.4DIFFUSIVITY...11
1.1.1.5THERMAL STABILITY OF NANOSTRUCTURED MATERIALS...12
1.1.2 COMPUTER MODELING ...13
1.1.3 NANOALLOYS ...15
1.1.3.1 Al-Pb ALLOY SYSTEM...18
1.2 THESIS OBJECTIVES ...23
1.3 THESIS ORGANIZATION...23
REFERENCES ...25
2.1 INTRODUCTION ...31
2.2 ATOMISTIC SIMULATIONS...31
2.2.1 THERMODYNAMIC ENSEMBLES ...32
2.3 METROPOLIS MONTE CARLO ALGORITHM...34
2.4 MOLECULAR DYNAMICS ...39
2.4.1 INTEGRATORS...41
2.4.1.1 VELOCITY VERLET ALGORITHM ...41
2.4.1.2 PREDICTOR-CORRECTOR ALGORITHM ...42
2.5 THERMOSTATS ...45
2.5.1 HOOVER THERMOSTAT ...46
2.6 PERIODIC BOUNDARY CONDITIONS ...47
REFERENCES ...49
CHAPTER 3 – INTERATOMIC POTENTIAL FOR Al-Pb ALLOY ...52
3.1 INTRODUCTION ...52
3.2 MEAM FORMALISM ...54
3.2.1 SCREENING PROCEDURE ...59
3.3 Al-Pb ALLOY MEAM POTENTIAL ...61
3.4 DFT CALCULATIONS ...65
CHAPTER 4 – MODELING OF THE STRUCTURES FORMED BY
SUBSTITUTIONAL Pb IMPURITY IN Al AND ITS EFFECT ON MECHANICAL
BEHAVIOR...70
4.1 INTRODUCTION ...70
4.2 METHODOLOGY ...71
4.3 RESULTS AND DISCUSSIONS...74
4.3.1 BULK Al-Pb ALLOY...74
4.3.2 BICRYSTALLINE Al-Pb ALLOY ...76
4.3.3 NANOCRYSTALLINE Al-Pb ALLOY...80
4.4 STABILIZATION ENERGIES ...81
4.5 EFFECT OF Pb ON MECHANICAL BEHAVIOR OF Al...84
4.5.1 INTRODUCTION ...84
4.5.2 METHODOLOGY ...85
4.5.3 RESULTS AND DISCUSSION ...86
REFERENCES ...91
CHAPTER 5 – PREDICTION OF ENERGIES OF TWO HIGH SYMMETRY Σ 5 <100> TILT GRAIN BOUNDARIES IN Al-Pb ALLOYS USING ATOMISTIC MEAM AND FIRST PRINCIPLES DENSITY FUNCTIONAL CALCULATIONS93 5.1 INTRODUCTION ...93
5.2 METHODOLOGY ...96
5.4 FIRST PRINCIPLES RESULTS...101
REFERENCES ...105
CHAPTER 6 – PREDICTION OF A MINIMUM Pb CLUSTER SIZE BELOW WHICH Pb PREFERS TO SEGREGATE TO Al GRAIN BOUNDARIES COMPARED TO FORMING CLUSTERS IN BULK Al...106
6.1 INTRODUCTION ...106
6.2 METHODOLOGY ...108
6.3 RESULTS AND DISCUSSION ...115
REFERENCES ...121
CHAPTER 7 – PREDICTION OF ENERGIES OF <100> TILT GRAIN BOUNDARIES IN Al-Pb ALLOYS USING THE DISCLINATION STRUCTURAL UNITS MODEL ...122
7.1 INTRODUCTION ...122
7.2 METHODOLOGY ...124
7.3 RESULTS AND DISCUSSION ...129
REFERENCES ...134
CHAPTER 8 – SUMMARY AND SUGGESTIONS FOR THE FUTURE WORK136 8.1 SUMMARY...136
LIST OF TABLES
CHAPTER 2 - FUNDAMENTALS OF ATOMISTIC SIMULATIONS
Table 2.1 Coefficient values for a second order Nordsieck-Gear predictor-corrector Method ...45
CHAPTER 3 - INTERATOMIC POTENTIAL FOR Al-Pb ALLOY
Table 3.1 Parameters for the MEAM potential of Al and Pb. The units of the sublimation energy Ec, and the equilibrium nearest-neighbor distance re, are the eV and A0
respectively ...61
Table 3.2 Parameters for the MEAM potential for the Al-Pb alloy. The units of the sublimation energy Ec, and the equilibrium nearest-neighbor distance re, are the eV and A0 respectively ...63
Table 3.4 Comparison of the properties of two hypothetical Al-Pb alloys given by first principles DFT calculations and the MEAM potential ...67
CHAPTER 4 - MODELING OF THE STRUCTURES FORMED BY
SUBSTITUTIONAL Pb IMPURITY IN Al AND ITS EFFECT ON MECHANICAL BEHAVIOR
Table 4.1 Atomic segregation energies and hydrostatic stresses for atoms around the Σ5 {210} Al grain boundary. The segregation energies and hydrostatic stresses are in units of eV/atom and GPa, respectively. -ve Tensile stress, +ve Compressive stress...78
Table 4.2 Enthalpies of several Al-Pb structures...83
Table 4.3 Relative enthalpies of several bicrystalline Al-Pb structures. Relative enthalpy of 1 Pb in bulk Al = 1.622 eV/atom...84
CHAPTER 5 - PREDICTION OF ENERGIES OF TWO HIGH SYMMETRY Σ 5
<100> TILT GRAIN BOUNDARIES IN Al-Pb ALLOYS USING ATOMISTIC MEAM AND FIRST PRINCIPLES DENSITY FUNCTIONAL CALCULATIONS
CHAPTER 6 - PREDICTION OF A MINIMUM Pb CLUSTER SIZE BELOW
WHICH Pb PREFERS TO SEGREGATE TO Al GRAIN BOUNDARIES COMPARED TO FORMING CLUSTERS IN BULK Al
Table 6.1 Details showing calculations of energy term E2 (In Eq. (4) above...116
Table 6.2 Details showing calculations of energy term E1(In Eq. (4) above). MN refers
to magic numbers of Pb atoms...117
Table 6.3 Details showing calculations of energy term ΔE (In Eq. (4) above). MN refers to magic numbers of Pb atoms...118
CHAPTER 7 - PREDICTION OF ENERGIES OF <100> TILT GRAIN
BOUNDARIES IN Al-Pb ALLOYS USING DISCLINATION STRUCTURAL UNITS MODEL
Table 7.1 Geometric parameters of the preferred boundaries and the elastic constants used in the calculations ...127
LIST OF FIGURES
CHAPTER 1 - INTRODUCTION
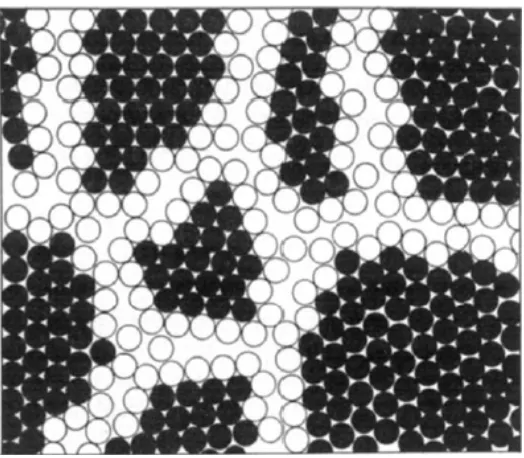
Fig. 1.1 Two-dimensional model of a nanostructured material. The atoms in the centers of the crystals are indicated in black. The ones in the boundary core regions are represented as open circles [1] ...6
Fig. 1.2 Schematic representation of the variation of yield stress as a function of grain size from nanocrystalline to microcrystalline regimes [19]...8
Fig. 1.3 Young’s modulus as a function of porosity for nanocrystalline Pd and Cu [32] .11
Fig. 1.4 Z-contrast image of in situ consolidated Al-1.0%Pb showing the Al grain boundaries covered with Pb atoms. The brighter region represents Pb phase and darker region represents Al phase [60] ...20
CHAPTER 2 -FUNDAMENTALS OF ATOMISTIC SIMULATIONS
Fig. 2.1 Schematic of Metropolis Monte Carlo Algorithm...38
Fig. 2.3 Illustration of periodic boundary conditions ...49
CHAPTER 3 - INTERATOMIC POTENTIAL FOR Al-Pb ALLOY
Fig. 3.1 Potential screening of atoms i and k by atom j [13] ...60
CHAPTER 4 - MODELING OF THE STRUCTURES FORMED BY
SUBSTITUTIONAL Pb IMPURITY IN Al AND ITS EFFECT ON MECHANICAL BEHAVIOR
Fig. 4.1 Illustration of the Al bicrystalline geometry. (a) Entire Al bicrystal containing two complementary Σ5 <100> {210} tilt grain boundaries. Bulk atoms are shown in blue and other colors represent GB atoms. (b) A Schematic of the Σ5 <100> {210} tilt grain boundary. The open and closed circles represent atoms on the {100} and {200} planes, respectively ...72
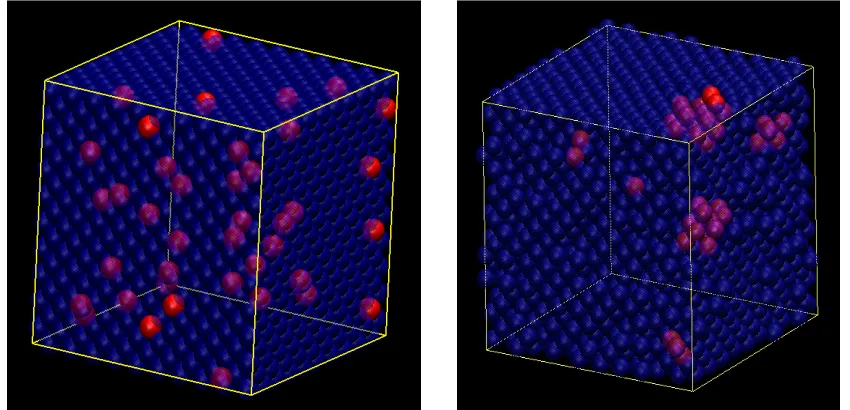
Fig. 4.3 Illustrations of the initial and simulated configurations for the bulk Al-Pb solid solution. Al and Pb atoms are shown in blue and red, respectively. (a) Initial configuration. (b) Final configuration after 1.9×10⁶ MC moves ...75
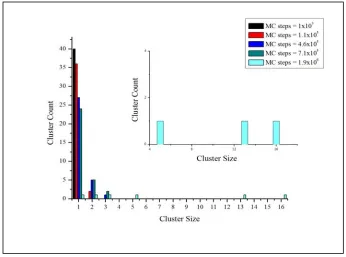
Fig. 4.4 Size distribution for Pb nanoclusters in bulk Al-Pb solid solution...76
Fig. 4.5 Initial configuration for an Al bicrystal, where one percent of the Al atoms are replaced with Pb atoms ...77
Fig. 4.6 Illustration of the final configuration after 2×10⁶ MC moves for the system with 1 atomic percent Pb impurities. Al and Pb atoms are shown in blue and red, respectively. (a) Entire system. (b) Close-up view ...77
Fig. 4.7 Illustration of the final configuration after 5.5×10⁶ MC moves for the system with 5 atomic percent Pb impurities. Al and Pb atoms are shown in blue and red, respectively. (a) Entire system. (b) Close-up view ...79
Fig. 4.8 Illustrations of the final configuration (after 2×10⁶ MC moves) for the nanocrystalline Al-Pb alloy. Al is shown in blue, and Pb and grain boundary atoms are shown in red and green, respectively...80
Fig. 4.10 Stress-strain curves for pure Al and Al-Pb alloys with 1 and 8 atomic percent Pb on Al grain boundaries...87
Fig. 4.11 Deformation structures for pure Al at 60, 61 and 62 ps ...88
Fig. 4.12 Deformation structures for 1 atomic percent Pb doped Al at 56, 57, 58 and 59 ps...89
Fig. 4.13 Deformation structures for 8 atomic percent Pb doped Al at 58, 59, 60 and 61 ps...90
CHAPTER 5 - PREDICTION OF ENERGIES OF TWO HIGH SYMMETRY Σ 5 <100> TILT GRAIN BOUNDARIES IN Al-Pb ALLOYS USING ATOMISTIC MEAM AND FIRST PRINCIPLES DENSITY FUNCTIONAL CALCULATIONS
Fig. 5.1 (a) Illustration of an Al bicrystalline geometry containing two Σ5 <100> {210} tilt grain boundaries. Bulk and GB atoms are shown in silver and white, respectively. (b) Schematic of the Σ5 <100> {210} tilt grain boundaries. The open and closed circles represent atoms on the {100} and {200} planes, respectively ...98
tilt grain boundaries. Bulk and GB atoms are shown in silver and white, respectively. (b) Schematic of the Σ5 <100> {310} tilt grain boundaries. The open and closed circles represent atoms on the {100} and {200} planes, respectively ...99
Fig. 5. 3 Grain boundary energy as a function of the percentage of the coincident sites occupied by Pb atoms - ( Σ 5 {210} grain boundary)...100
Fig. 5.4 Grain boundary energy as a function of the percentage of the coincident sites occupied by Pb atoms - ( Σ 5 {310} grain boundary)...100
Fig. 5.5 Illustrations of the Σ5 {210} structure (top views) and the Σ5 {310} structure (bottom views) without (left views) and with Pb (right views). Al (Grey), Pb (Black) ..104
CHAPTER 6 - PREDICTION OF A MINIMUM Pb CLUSTER SIZE BELOW
WHICH Pb PREFERS TO SEGREGATE TO Al GRAIN BOUNDARIES COMPARED TO FORMING CLUSTERS IN BULK Al
Fig. 6.1 (a) A simulation cell, showing a cuboctahedral shaped Pb cluster (red) embedded in Al matrix (blue). (b) Schematic of cuboctahedral shape viewed along a <110> type direction ...109
Fig. 6.3 Schematic of a Σ5 <100> {210} undoped Al tilt boundary. The silver and black represent atoms on the {100} and {200} planes, respectively ...113
Fig. 6.4 (a) Bicrystalline reference configuration number 1, that contains two Pb doped
Σ5 <100> {210} Al tilt boundaries. (b) Schematic of reference configuration number 1. Al and Pb atoms are shown in silver and black respectively...113
Fig. 6.5 (a) Bicrystalline reference configuration number 2, that contains two Pb doped
Σ5 <100> {210} Al tilt boundaries. (b) Schematic of reference configuration number 2. Al and Pb atoms are shown in silver and black respectively...114
Fig. 6.6 (a) Bicrystalline reference configuration number 3, that contains two Pb doped
Σ5 <100> {210} Al tilt boundaries. (b) Schematic of reference configuration number 3. Al and Pb atoms are shown in silver and black respectively...114
Fig. 6.7 Variation of E2 with mPb for the three reference structures...116
Fig. 6.8 Variation of E1 with nPb for cuboctahedal shape Pb clusters ...117
Fig. 6.10 ΔE (eV/Pb atom) vs. nPbwith respect to reference structure number 2 ...120
Fig. 6.11 ΔE (eV/Pb atom) vs. nPbwith respect to reference structure number 3 ...120
CHAPTER 7 - PREDICTION OF ENERGIES OF <100> TILT GRAIN
BOUNDARIES IN Al-Pb ALLOYS USING DISCLINATION STRUCTURAL UNITS MODEL
Fig. 7.1 Disclination structural unit model representation of a grain boundary consisting of B and C structural units [9]...126
Fig. 7.2 Dependence of grain boundary energy on angle for <100> symmetrical
tilt-grain boundaries in Pb doped Al as calculated by atomistic MEAM and multiscale MEAM+DSUM model ...130
Fig. 7.3 Dependence of grain boundary energy on angle for <100> symmetrical tilt-grain boundaries in Pb doped Al as calculated by atomistic GLUE and multiscale GLUE+DSUM model ...132
CHAPTER 1
INTRODUCTION
1.1 INTRODUCTION
variety of functions in automobile, aerospace, marine and civil structures, and food and medical industries.
In coarse-grained metals, plastic deformation results from the nucleation of dislocations from Frank-Read sources and their motion through the crystal. A dislocation is a line lattice defect that was first introduced to explain the discrepancy between the observed and theoretical shear strength of metals. There are two basic types of dislocation movement, glide (or conservative motion) in which the dislocation moves in the surface which contains both its line and Burgers vector, and climb (or non conservative motion) in which the dislocation moves out of the glide surface normal to the Burgers vector. Glide of many dislocations results in slip, which is the most common manifestation of plastic deformation in crystalline solids. It can be understood as sliding or successive displacement of one plane of atoms over another on so-called slip planes.
The ability of a crystalline material to plastically deform largely depends on the ability for a dislocation to move within a material. Therefore, impeding the movement of dislocations results in the strengthening of the materials. There are a number of ways to impede dislocation movement, which include;
• Control of grain size - Grain boundaries provide obstacles to dislocation motion. As the orientation of the crystals on either side of a grain boundary is different and random, a dislocation moving on a common slip plane in one crystal can rarely move on to a similar slip plane in the adjacent crystal. Hence dislocations are stopped by a grain boundary and pile up against it. The smaller the grain size, the more frequent the pile up of dislocations.
Hall [2] and Petch [3] proposed the following equation for the yield stress of a polycrystalline material σy as a function of average grain size d
2 1
−
+ = i kd y σ
σ (1)
where σi is the yield stress for a crystal of the same material where there are no grain boundaries and, k is a material-dependent constant. According to this relationship, the yield strength is inversely related to the square root of the grain size.Hence decreasing the grain size aids in the development of high strength materials of the same composition.
results in a decrease in the mobility of the dislocations and a strengthening of the material.
However these mechanisms can’t be extrapolated to the materials with the grain size in nano regime. In nanostructured solids a large fraction of atoms ~up to 50% (as discussed below) are boundary atoms; thus intercrystalline deformation mechanisms based on grain boundary processes are expected to become relevant, as opposed to intracrystalline mechanisms based on dislocation activity. At the smallest grain sizes, dislocation sources such as Frank-Read source inside grains cannot easily exist because of size and image force limitations; only dislocations emitted from a boundary can eventually travel across the grain. From these arguments a change in plasticity mechanism is expected with decreasing grain size from a dislocation-dominated to a boundary-dominated mechanism such as grain boundary sliding.
Nanostructured materials can be conveniently divided in to three categories [4-5]:
• Materials with reduced dimensions in the form of (isolated, substrate-supported or embedded) nanometer-sized particles, thin wires or thin films. This type of microstructure is important, for example, for materials with catalytic applications.
and wear resistance can be enhanced by creating a nanometer-sized microstructure in thin surface regions.
• Bulk solids with a nanometer-scale microstructure in which the chemical composition, the atomic arrangement and/or the size of the building blocks (e.g. crystallites or atomic/molecular groups) forming the solid vary on a length scale of a few nanometers throughout the bulk.
Two classes of the latter category, one with a homogenous and other with
heterogeneous microstructures, may be distinguished. In the first class, the atomic structure and/or the chemical composition varies in space continuously throughout the solid on an atomic scale. Glasses and supersaturated solid solution are examples of this type. In the second class, the materials are assembled of nanometer-sized building blocks, mostly crystallites as illustrated in Fig. 1.1. These building blocks may differ in their atomic structure, their crystallographic orientation and/or their chemical
composition. The heterogeneous structures are crucial for many of the properties of these materials. The focus of this dissertation is on this second class of materials.
characterized by a reduced atomic density and interatomic spacings deviating from those in the perfect lattice [1]. The fraction of these intercrystalline regions increases as the grain size decreases. A nanocrystalline material may be regarded as a composite consisting of crystalline and intercrystalline (grain boundaries, triple junctions) components.The portion of the intercrystalline components in polycrystalline materials is so small that its effect on observed properties is negligible whereas in nanocrystalline materials, not only do grain boundaries play an important role, but also triple lines and quadruple nodes can contribute significantly to deformation.
1.1.1 PROPERTIES OF NANOSTRUCTURED MATERIALS
Nanostructured materials have received much interest because they exhibit different properties compared to coarse-grained polycrystals of the same material [5-11]. Some of the properties of nanocrystalline (nc) materials are summarized below.
1.1.1.1 STRENGTH AND HARDNESS
These models include [20]:
• Enhanced Coble creep - Chokshi et al. [12] proposed that the inverse Hall-Petch behavior is caused by enhanced Coble creep, i.e. creep due to diffusion in the grain boundaries. Coble creep scales with the grain size (d) as d-3, and estimates of the creep rate of nanocrystalline metals indicate that this could be the explanation of the inverse Hall-Petch behavior. Direct measurements of the creep rate have, however, ruled out this explanation [21-22].
• Suppression of dislocation pileups - Once the grain size drops below the equilibrium distance between dislocations in a pileup, pileups are no longer possible, and the Hall-Petch relation should cease to be valid [22-23].
• Porosity and flaws - Processing artifacts (pores, incomplete particulate bonding) have a negative effect on the strength and are the main reasons for the inverse Hall-Petch behavior observed in earlier studies. Improved processing techniques [24] have allowed production of nanocrystalline samples with densities above 98%; these have shown no inverse Hall-Petch behavior in copper at grain sizes down to approximately 10-15 nm [25]. Chen et al. have found Hall-Petch hardening in pure nanocrystalline Cu at grain sizes as small as 10 nm [26].
1.1.1.2 DUCTILITY
are (1) artifacts from the processing, (2) force instability in tension and (3) crack nucleation or propagation instability. The development of artifact free materials using modern processing techniques has contributed significantly to an increase in strength as well as ductilities for these materials. Available literature suggests that having a bimodal grain size distribution results in high strength as well as good ductility in nanocrystalline materials [29-30].
1.1.1.3 ELASTIC PROPERTIES
1.1.1.4 DIFFUSIVITY
The numerous interfaces in nanocrystalline materials provide a high density of short circuit diffusion paths. Thus, nanocrystalline materials are expected to exhibit an enhanced self diffusivity in comparison to single crystals or conventional polycrystals with the same chemical composition. This idea was confirmed by self diffusion measurements in nanocrystalline copper [33-35]. The nanocrystalline materials may be utilized technologically in areas where solids with high diffusivities are needed.
1.1.1.5 THERMAL STABILITY OF NANOSTRUCTURED MATERIALS
The unique properties of nanostructured materials, when compared to their coarse grained counterparts, are attributed to the presence of a high volume fraction of internal interfaces. A large amount of energy stored in these interfaces (grain boundaries) provides a large driving force for grain growth and grain growth has been observed in nanocrystalline Pd and Cu at temperatures as low as room temperature [36-37]. Many enhancements in the properties of nanocrystalline materials due to the ultra-fine grain size are lost if grain growth occurs during application. Knowledge concerning methods for stabilizing the microstructure of nanocrystalline materials exposed to high temperatures is therefore highly desirable.
Weissmüller and co-workers [44–46]suggested that it is possible for nanocrystalline metallic alloys to be metastable, i.e. no tendency for grain growth, if EGB(specific grain boundary energy) can be reduced to zero or below. Ignoring entropic effects, the variance of the EGB with Eseg (enthalpy of segregation) is given by
( )
{
solute}
seg GBGB E X E
E = 0 −
where EGB( )0 is the specific excess free energy of a pure solvent and {Xsolute
}
is the specific dopant coverage on the grain boundary. If EGB ≤0, due to a large and positive Eseg and /or{
Xsolute}
, the total Gibbs free energy of a nanocrystal would be equal to or below that of thesingle crystal solid solution and the driving force for the grain growth is eliminated. In alloy systems of Pd-Zr [47] and Y-Fe [45], both of which have a high enthalpy of segregation, grain growth was suppressed upon increasing the solute concentration.
1.1.2 COMPUTER MODELING
small grain sizes, in agreement with some experimental measurements. The simulations confirm that plastic deformation in the inverse Hall-Petch region occurs mainly by grain boundary sliding, with a minimal influence of dislocation motion on the deformation.
For grain sizes above approximately 10 nm, the deformation of nanocrystalline metals is a result of both atomic scale grain boundary processes and dislocation activity within the grains. Recently, there has been some debate in the literature regarding the existence of full dislocations in nanocrystalline grains during the deformation process. In a polycrystalline material, the size of Frank-Read sources cannot exceed the grain size. Because the stress needed for their operation is inversely proportional to the size of the source, this deformation mechanism can operate only down to a grain size of typically about 1 μm. For a smaller grain size, mobile dislocations must be nucleated from other sources, such as the grain boundaries or grain junctions.
boundary associated with its emission sufficiently lowers the grain boundary energy such that the emission of the trailing partial dislocation is not always needed to further relax the system [53].
MD simulations by Yamakov et al. [54-56] showed that the trailing partial dislocation may be emitted from grain boundary interfaces in aluminum. They suggested that the stacking fault width, and hence the intrinsic stacking fault energy, as defined by the distance between two partial dislocations is the central quantity that defines the transition from full to partial dislocation emission as grain size approaches the critical size for the onset of inverse Hall-Petch behavior.
More recent work by Van Swygenhoven and coworkers [53,57] has argued that interpreting the crossover between deformation regimes in terms of only the intrinsic stacking fault energy is insufficient. They emphasized that the entire generalized stacking fault curve [58] must be taken into consideration and proposed that the ratio of the unstable and intrinsic stacking fault energies is more appropriate to describe the observed dislocation activity in nanocrystalline samples.
1.1.3 NANOALLOYS
density of interfaces in nanostructured solids in terms of interface atomic structure. Nanocrystalline alloys represent an additional group of nanostructured solids. Because in these solids the density of topological defects is comparable to the density of alloy atoms, they promise to exhibit exciting new physical effects. At present there are two issues that are of particular importance. The first is the effect of an alloying component on the mechanical behavior of a nanocrystalline material and the second is the effect of the alloying component on grain boundaries on boundary stability.
The effects of Pb on the mechanical properties of nanocrystalline Al are uncertain based on several experimental results as discussed in more detail below [59-60]. In one case hardening was observed [59], while in the other there was a dramatic softening effect [60]. The latter investigators suggested that the Pb segregation to grain boundaries observed using Z-contrast high-resolution transmission electron microscopy (HRTEM) was the cause of the softening. Seonhee Jang [61] carried out molecular dynamics simulations for uniaxial tensile straining of two-dimensional columnar microstructures of aluminum (Al) and aluminum-lead (Al-Pb) alloys. A softening effect in agreement with, but less than that found experimentally was observed in her simulations.
than many-body potential such as the embedded-atom method, they have the advantage that the properties of the impurities can be varied continuously in a straightforward manner. Impurity atom(s) of various characteristics and concentration were added to the near vicinity of the grain boundary to determine the structural and energetic effects.
They conclude that cohesive energy of a dopant atom does not have much effect on EGB (specific grain boundary energy) upon segregation. On the other hand, the size of the dopant atom as compared to the host atoms is much more influential in affecting EGB. Dopant atoms of both greater and smaller size compared to the surrounding Cu atoms caused a decrease in
GB
E when they were brought closer to the grain boundary; however, the larger dopants were more effective in decreasing the energy.
It was also shown that the grain boundary energy could be reduced to zero, which has been theoretically proposed as necessary for achieving a metastable state for nanocrystals. The solute concentration in the grain boundary was gradually raised for each of the different dopant/host atomic size mismatches to determine if the EGB can be reduced to zero or below. For each of the dopant atom sizes, this was achieved for a certain solute concentration, which increased with decreasing dopant/host atomic size mismatch.
1.1.3.1 Al-Pb ALLOY SYSTEM
Immiscible alloy systems have been of great interest owing to their metastable structure formation in non-equilibrium processes and technological merits associated with them. It has been revealed that alloys could be synthesized in such systems with highly non-equilibrium processing methods such as melt spinning and ball milling [63-64]. Al-Pb is a typical immiscible binary alloy and a system on which some important alloys such as bearing alloys and solder materials are based.
the simulations predict segregation of Pb impurities towards the Al grain boundaries prior to cluster formation depending on the Pb content and the number of grain boundaries. In addition, for the nanocrystalline structure the Pb impurities also segregate toward triple junctions. Analysis of the local stress shows that the Pb atoms tend to initially segregate to lattice sites along the grain boundary that would otherwise be under hydrostatic tension, consistent with the larger effective size of Pb atoms compared to Al. After these sites are filled, the simulations predict the formation of individual Pb clusters across the grain boundaries. Hence the simulations support the conclusions of Rajulapati et al. These simulations, and subsequent calculations of the energies of Pb clusters in an Al matrix with the same potential function, predict a preference for the segregation of Pb atoms to grain boundaries compared to the formation of embedded Pb clusters with diameters less than about 2.8 nm. More importantly, analysis of the relative enthalpies for various substitutional Pb defects suggests that Pb impurities can help stabilize nanocrystalline Al against grain growth.
The stabilizing effect of Pb impurities on the energies of Al grain boundaries was investigated for two high symmetry Σ 5 {210} and Σ 5 {310} symmetrical tilt grain
boundaries. This was done following the work by Millett et al. who studied the energy of a Σ
as a function of the percentage of the coincident sites along the plane of atoms at the two-grain boundaries occupied by Pb atoms. They both showed a reduction in two-grain boundary energies with increasing Pb content. Stabilization was also confirmed by first principles calculations of the grain boundary energies of the above two boundaries.
Next, a dependence of the energies of <100> symmetrical Al tilt boundaries over a complete range of misorientation angles with and without Pb substitution on the Al grain boundaries was investigated. A disclination-structural units model (DSUM) of grain boundaries that combines the structural units model [67-70] with the disclination [71-73] based description of grain boundaries was used for this purpose. The approach used energies from an atomistic potential for a few Pb doped key structures as input into the DSUM model [74-77]. The reliability of the DSUM was evaluated by calculating energies of a number of intermediate grain boundaries atomistically, using both the MEAM [78-82] and a ‘Glue’ type [83-84] interatomic potential and comparing these to predictions from the DSUM. The DSUM predicted a strong dependence of the grain stabilization energy on tilt angle.
1.2 THESIS OBJECTIVES
There are five main objectives to this dissertation:
1. To characterize cluster formation and the segregation of Pb impurities to grain boundaries in an Al bicrystal and a three-dimensional Al nanocrystal using Monte Carlo simulations. 2. To obtain a crossover cluster size below which Pb prefers to segregate to grain boundaries compared to forming clusters in bulk Al.
3. To investigate segregation-induced stability of grain boundaries in Al-Pb nanoalloys using atomistic MEAM and first principles calculations.
4. To establish the applicability of the disclination structural units model for alloys. 5. To study the effect of Pb on the mechanical behavior of Al using MD simulations.
1.3 THESIS ORGANIZATION
Chapter 3 describes the two interatomic potentials - 1. The Modified Embedded Atom Method, and 2. The ‘Glue’ type potential that were used for modeling the structures and grain boundary energies of Al-Pb alloys.
In Chapter 4 the results of two types of simulations and calculations are reported. First are the structures predicted by the Monte Carlo simulations for a bulk Al-Pb alloy, an Al-Pb bicrystalline structure containing two Σ5 {210} grain boundaries, and a nanocrystalline Al-Pb alloy. Calculations that predict relative enthalpies at 0K for several structures associated with the bicrystalline Al-Pb alloy are also presented. Second are the results of the effect of Pb on the mechanical behavior of Al. The molecular dynamics simulations in uniaxial tension were used to study deformation behavior in bicrystalline aluminum and aluminum-lead alloys.
In Chapter 5 the results of the calculations that show a stabilizing effect of Pb impurities on the energies of Al grain boundaries as a function of Pb content are presented. The calculations for the grain boundary energies were carried out using the atomistic MEAM and the first principles methods.
In Chapter 7 the results of the application of a multiscale disclination structural units model (DSUM) for calculating energies of <100> Al tilt grain boundaries over a complete range of misorientation angles with and without Pb atoms on the Al grain boundaries are presented.
Chapter 8 summarizes the outcomes of the present work and gives suggestions for the future work.
REFERENCES
1. H. Gleiter, Prog. Mater. Sci., 33 (1989) 223.
2. E. O. Hall, Proc. Roy. Soc. London, B64 (1951) 474. 3. N. J. Petch, J. Iron Steel Inst., 174 (1953) 25.
4. H. Gleiter, Nanostruct. Mater., 6 (1995) 3. 5. H. Gleiter, Acta mater., 48 (2000) 1.
6. C. Suryanarayana, Internat. Mater. Rev., 40 (1995) 41.
7. R. W. Siegel, Materials Science and Technology—A Comprehensive Treatment, Vol. 26: Processing of Metals and Alloys, ed. R.W. Cahn (Weinheim, Germany: VCH, 1991), pp. 583–614.
8. C. Suryanarayana et al., editors, Processing and Properties of Nanocrystalline Materials (Warrendale, PA: TMS, 1996).
11. C. Suryanarayana, JOM, 54, 9 (2002) 24-27.
12. A. H. Chokshi, A. Rosen, J. Karch, H. Gleiter, Scripta Metall., 23 (1989) 1679.
13. G. E. Fougere, J. R. Weertman, R. W. Siegel, S. Kim, Scripta Metall. Mater. 26 (1992) 1879.
14. T. R. Malow, C. C. Koch, P. Q. Miraglia, and K. L. Murty, Mater. Sci. Eng. A, 252 (1998) 36.
15. T. Yamasaki, P. Schloßmacher, K. Ehrlich, Y. Ogino, Nanostruct. Mater. 10 (1998) 375. 16. C. Schuh, T. G. Nieh, T. Yamasaki, Scripta Mater., 46 (2002) 735.
17. C. Schuh, T. G. Nieh, H. Iwasaki, Acta Mater., 51 (2003) 431.
18. D. H. Jeong, U. Erb, K. T. Aust, G. Palumbo, Scripta Mater., 48 (2003) 1067. 19. K. S. Kumar, H. Van Swygenhoven, S. Suresh, Acta Mater., 51 (2003) 5743.
20. J. Schiøt, T. Vegge, F. D. Di Tolla, K. W. Jacobsen, Web-Article, Simulations of Mechanics and Structure of Nanomaterials – From Nanoscale to Coarser Scales.
21. G. W. Nieman, J. R. Weertman, R. W. Siegel, Scripta Metall. Mater. 24 (1990) 145. 22. T. G. Nieh, J. Wadsworth, Scripta Metall. Mater. 25 (1991) 955.
23. C. S. Pande, R. A. Masumura, R.W. Armstrong, Nanostruct. Mater. 2 (1993) 323.
24. P. G. Sanders, G. E. Fougere, L. J. Thompson, J. A. Eastman, J. R. Weertman, Nanostruct. Mater., 8 (1997) 243.
25. P. G. Sanders, C. J. Youngdahl, J. R. Weertman, Mater. Sci. Eng. A, 234-236 (1997) 77. 26. J. Chen, L. Lu, K. Lu, Scripta Mater., 54 (2006) 1913.
29. Y. M. Wang, M. W. Chen, F. H. Zhou, E. Ma, Nature, 419 (2002) 912.
30. X. Zhang, H. Wang, R. O. Scattergood, J. Narayan, C. C. Koch, A.V. Sergueeva, A. K. Mukherjee, Acta Mater., 50 (2002) 4823.
31. G. W. Nieman, J. R. Weertman, R. W. Siegel, J. Mater. Res., 6 (1991) 1012. 32. P. G. Sanders, J. A. Eastman, J. R. Weertman, Acta Mater., 45 (1997) 4019.
33. R. Birringer, H. Hahn, H. Hofler, J. Karch, H. Gleiter, Defect and Diffusion Forum 59 (1988) 17.
34. J. Horvath, R. Birringer, H. Gleiter, Solid State Comm. 62 (1987) 391.
35. J. Horvath, DIMETA-88, International Conference on Diffusion in Metals and Alloys, Balatonfiired, Hungary, September 5-9, 1988.
36. V. Y. Gertsman, R. Birringer, Scripta Metall Mater., 30 (1994) 577. 37. J. Weissmüller, J. Loffler, M. Kleber, Nanostruct. Mater., 6 (1995) 105.
38. V. Randle, (ed.), in The Role of the Coincidence Site Lattice in Grain Boundary Engineering, The Institute of Materials, Leeds, ISBN 1861250061, 1996.
39. P. Knauth, A. Charai, P. Gas, Scripta Metall. Mater., 28 (1993) 325.
40. K. Boylan, D. Ostrander, U. Erb, G. Palumbo, K. T. Aust, Scripta Metall. Mater., 25 (1991) 2711.
41. A. M. El-Sherik, K. Boylan, U. Erb, G. Palumbo, K. T. Aust, Mat. Res. Soc. Symp. Proc., 238 (1992) 727.
42. R. J. Perez, B. Huang, A. A. Sharif, E. J. Lavernia, in Synthesis and Processing of Nanocrystalline Powder, p273, TMS, Warrendale, PA, 1996.
44. J. Weissmüller, “Nanocrystalline Materials – An Overview,” in: synthesis and processing of Nanocrystalline Powder (D.L.Bourell,ed), pp. 3-19,TMS, Warrendale, PA (1996).
45. J. Weissmüller, W. K. Krauss, T. Haubold, R. Birringer, H. Gleiter, Nanostruct. Mater., 1 (1992) 439.
46. J. Weissmüller, J Mater. Res., 9 (1994) 4.
47. CE. Krill, R. Klein, S. Janes, R. Birringer, Mater. Sci. Forum, 179-181 (1995) 443. 48. J. Schiøtz, F. D. Di Tolla, K. W. Jacobsen, Nature 391 (1998) 561
49. H. Van Swygenhoven, M. Spaczer, A. Caro, D. Farkas, Phy. Rev. B, 60 (1999) 22. 50. H. Van Swygenhoven, A. Caro, D. Farkas, Mater. Sci. Eng. A, 309-310, (2001) 440. 51. H. Van Swygenhoven, P. M. Derlet, A. Hasnaoui, Phy. Rev. B, 66 (2002) 024101. 52. P. M. Derlet, H. Van Swygenhoven, A. Hasnaoui, Philo. Mag., 83 (2003) 3569. 53. H. Van Swygenhoven, P. M. Derlet, A. G. Froseth, Nature Materials, 3 (2004) 399.
54. V. Yamakov, D. Wolf, M. Salazar, S. R. Phillpot, H. Gleiter, Acta Mater., 49 (2001) 2713.
55. V. Yamakov, D. Wolf, S. R. Phillpot, H. Gleiter, Acta Mater., 50 (2002) 5005. 56. V. Yamakov, D. Wolf, S. R. Phillpot, H. Gleiter, Acta Mater., 51 (2003) 4135. 57. A. G. Froseth, P. M. Derlet, H. Van Swygenhoven, Acta Mater., 52 (2004) 5863. 58. J. A. Zimmerman, H. Gao, F. F. Abraham, Modell. Simul. Mater. Sci. Eng., 8 (2000) 103.
59. H.W. Sheng, F. Zhou, Z.Q. Hu and K. Lu, J. Mater. Res., 13 (1998) 308.
61. S. Jang, Molecular Dynamics Simulations of Plastic Deformation in Nanocrystalline Metal and Alloy, (2007) PhD Thesis.
62. P. C. Millett, R. P. Selvam, S. Bansal, A. Saxena, Acta Mater., 53 (2005) 3671.
63. C. C. Koch, O. B. Cavin, C. G. McKamey, J. O. Scarbrough, Appl. Phys. Lett., 43 (1983) 1017.
64. R. B. Schwarz, R. R. Petrich, C. K. Saw, J. Non-Cryst. Solids, 76 (1985) 281.
65. E. Johnson, H. H. Andersen, U. Dahmen, Microscopy Research and Technique, 64 (2004) 356.
66. L. H. Zhang, E. Johnson, U. Dahmen, Acta Mater. 53 (2005) 3635.
67. A. P. Sutton, V. Vitek, Philosophical Transactions of the Royal Society of London A, 309 (1983) 1.
68. A. P. Sutton, V. Vitek, Philosophical Transactions of the Royal Society of London A, 309 (1983) 37.
69. A. P. Sutton, V. Vitek, Philosophical Transactions of the Royal Society of London A, 309 (1983) 55.
70. G. J. Wang, A. P. Sutton, V. Vitek, Acta Metall., 32 (1984) 1093. 71. J. C. M. Li, Surf. Sci., 31 (1972) 12.
72. K. K. Shih, J. C. M. Li, Surf. Sci., 50 (1975) 109. 73. A. E. Romanov, Mater. Sci. Eng. A, 164 (1993) 58.
75. R. Z. Valiyev, V. I. Vladimirov, V. Y. Gertsman, A. A. Nazarov, A. Y. Romanov, Physics of Metals and Metallography, 69 (1990) 30.
76. A. A. Nazarov, O. A. Shenderova, D. W. Brenner, Mater. Sci. Eng. A, 281 (2000) 148. 77. D. V. Bachurin, R. T. Murzaev, A. A. Nazarov, Fizika Metallov i Metallovedenie, 96 (2000) 11.
78. M. I. Bakes, Phys. Rev. Lett., 59 (1987) 2666.
79. M. I. Baskes, I. S. Nelson, A. F. Wright, Phys. Rev. B, 40 (1989) 6085. 80. M. I. Baskes, Phys. Rev. B, 62 (1992) 2727.
81. M. I. Baskes, R. A. Johnson, Modell. Simul. Mater. Sci. Eng., 2 (1994) 147. 82. M. I. Baskes, Mater. Sci. Eng. A, 261 (1999) 165.
83. F. Ercolessi, M. Parrinello, E. Tosatti, Philo. Mag., 58(1) (1988) 213.
CHAPTER 2
FUNDAMENTALS OF ATOMISTIC SIMULATIONS
2.1 INTRODUCTION
In this chapter the theory of atomistic simulations as related to this thesis is presented. First a general overview of atomistic simulations, which includes a brief description of thermodynamic ensembles, is presented. It is followed by a description of the atomistic methods and algorithms that were used in the present work. Section 2.3 and Section 2.4 outlines the fundamentals of the Monte Carlo and molecular dynamics methods, respectively. A description of the temperature control methods and periodic boundary conditions used in this work are given in Sections 2.5 and 2.6, respectively. All of the above background will help give a clearer understanding of the following chapters.
2.2 ATOMISTIC SIMULATIONS
interatomic potential provides a model for the potential energy of a system of atoms. The accuracy of property prediction relies on the proper choice of potential function. Commonly, the total potential energy of the system is written solely as a function of the positions of the atomic nuclei. This simplification avoids having to specifically account for the motion and interaction of the individual electrons. Since interatomic forces are conserved, the force on a given atom, Fi, is related to the interatomic potential, U, through the gradient operator. The force on a given atom, Fi is then obtained from the potential function, U, using:
( )
iN i
r r U F
∂ ∂ −
= (1)
where rN represents the position vectors for the system of N atoms while ri is the atomic position vector for the ithatom. Detailed information regarding the interatomic potentials used for calculations in this work is presented in Chapter 3.
2.2.1 THERMODYNAMIC ENSEMBLES
microcanonical (NVE) ensemble in statistical mechanics. For molecular dynamics, the natural ensemble is the microcanonical ensemble (NVE) because Newton’s equations lead naturally to energy conservation. Unfortunately, the microcanonical ensemble does not correspond to the conditions under which most experiments are carried out. To run simulations at other non-NVE statistical ensembles we must introduce a thermostat and/or a barostat in the system. Depending on the equations of motion that describe the system of atoms, these calculations may correspond to the canonical (NVT) and/or the isothermal-isobaric (NPT) ensemble in statistical mechanics. There are several schemes that have been devised to thermostat systems treated with atomistic simulations. A brief description of the thermostating methods used in this work is given in Section 2.5.
The ensemble average of a physical quantity, A, can be written as:
∑
= M AiPi A1
, M ≈∞ (2)
In the above equation, Ai represents the value of the physical quantity A associated with each
of the M accessible microstates (i = 1…M) of the system and Pi the probability of the system
to be in microstate i with energy Ei respectively. The form of Pi is determined by which
( )
NVT NV E
i Z
e P β i
−
= (3)
where E is the energy, β =1/KBTand ZNVT is the partition function, i.e.,
=
∑
− ( )i
NV E NVT e i
Z β (4)
For an exact mean, the total number of microstates M should approach infinity. Because in reality we can generate only a finite number m of the total number of M ≈∞ microstates, we only obtain an estimate for the mean value of the physical quantity A:
i m
iP A A ≈
∑
1
(5)
The accuracy of the estimate obtained by simulations therefore depends directly on the quality (or the way m representative conformations are chosen.) of the representative m conformations.
2.3 METROPOLIS MONTE CARLO ALGORITHM
sampling method, the m conformations are chosen randomly. The immense majority of these conformations has energy very different from the average energy of the system and hence contributes little to the mean. This gave rise to the idea of importance sampling. The idea of importance sampling in Monte Carlo simulations is to choose a representative set of conformations in such a way that the selection is biased towards conformations that are significantly populated at equilibrium. Metropolis Monte Carlo [7] is one such importance sampling method and has been used in the present work.
Monte Carlo simulation methods based on the Metropolis algorithm have been successfully used to study segregation phenomena in various alloy structures [21-23]. They can circumvent slow physical dynamic processes such as diffusion in the alloy systems and therefore makes calculation faster. The simulations using the Metropolis algorithm were performed in the canonical ensemble, where the total number of atoms of each element, volume and the temperature were held constant. Starting from an arbitrary configuration, a new system configuration is accepted or rejected based on the Boltzmann probability distribution function.
For our simulations, each Monte Carlo step consisted of the repetition of the following two moves:
(2) The exchange of atom identities between Pb and Al, which allowed the placement of substitutional Pb atoms into their equilibrium positions.
Each move that lowers the potential energy of a new configuration was accepted. Moves that raise the potential energy were accepted if a random number was smaller than the ratio of Boltzmann factors for the system after and before the move.
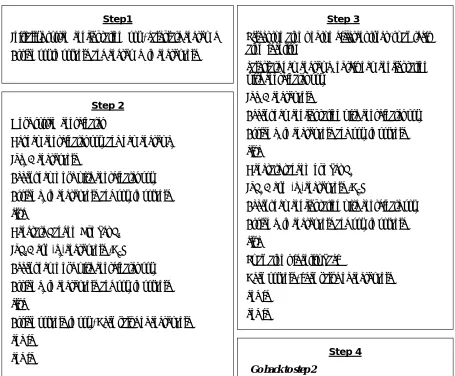
A schematic of the algorithm used to construct the Metropolis random walk is given in Fig. 2.1 and is also described below.
Step 1. Initialize:
a. Initialize the system configuration with coordinates xyz_old and energy energy_old.
Step 2. Atom Move:
a. Make a change in the configuration to obtain a new configuration 2 with coordinates xyz2
and energy e2.
b. If e2 < energy_old, accept the new configuration with coordinates xyz2, and assign e2 to
energy_old and xyz2 to xyz_old .)
c. If e2 > energy_old, generate a random number R1. If R1 < exp ((-e2-energy_old)/KBT),
R1 > exp ((-e2-energy_old)/KBT), then revert back to the old energy energy_old and assign
xyz_old to xyz2.
Step 3. Atom identity swap:
a. Swap the identity of element Al with Pb.
b. Calculate energy of this configuration with coordinate xyz2 to be e3.
c. If e3 < energy_old, accept the new configuration with coordinate xyz2, and assign energy e3
to energy_old and xyz2 to xyz_old.
d. If e3 > energy_old, generate a random number R1. If R1 < exp ((-e3-energy_old)/KBT),
then accept the new configuration xyz2 and assign energy e3 to energy_old and xyz2 to
xyz_old. If R1 > exp ((-e3-energy_old)/KBT), then swap back atom identity and revert back
to the old energy, energy_old, and old coordinates, xyz_old.
Step 4:
Fig. 2.1 Schematic of Metropolis Monte Carlo Algorithm.
Step1
Initialize system configuration (xyz), calculate energy (e) Assign xyz to xyz_old and energy (e) to energy_old
Step 2
Move system coordinates
Get new coordinates xyz2and new energy e2 If e2< energy_old
Accept new move with coordinates xyz2 Assign e2to energy_old and xyz2to xyz_old else
Generate Random Number R1 If R1< exp(-e2-energy_old)/KBT) Accept new move with coordinates xyz2 Assign e2to energy_old and xyz2to xyz_old else
Assign xyz_old to xyz2, Keep value of energy_old end if
end if
Step 3
Select two atoms of two different types, swap their atom identity
calculate new energy e3of this new configuration with coordinates xyz2
If e3 < energy_old
Accept new configuration with coordinates xyz2 Assign e3to energy_old and xyz2to xyz_old else
Generate random number R2 If R2 < exp (-e3-energy_old)/KBT)
Accept new configuration with coordinate xyz2 Assign e3to energy_old and xyz2to xyz_old else
Swap atoms identity back
Keep xyz_old, keep value of energy_old end if
end if
Step 4
2.4 MOLECULAR DYNAMICS
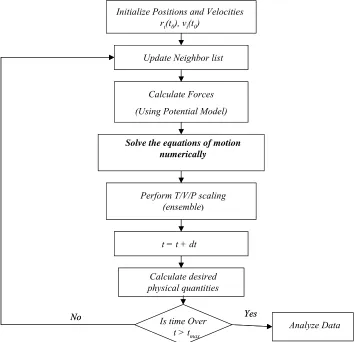
Molecular dynamics (MD) is a computer simulation method to follow the motion of particles with time by numerically integrating classical equations of motion. A general flow chart for a classical MD simulation is shown in Fig. 2.2. When an MD simulation is started for the very first time, one needs to specify the initial arrangement of the atoms in space, their initial momenta and parameters that determine the interatomic potential. The momenta in some cases need to be scaled such that they match an initial input temperature. Atoms in the system interact with each other through an interatomic potential. A neighbor list allows one to dramatically reduce the number of possible interactions one needs to actually consider. A neighbor list is created at the beginning of the simulation. Upon subsequent calls to the neighbor list, the list gets updated automatically. Forces between particles are calculated from the gradient of the energy function. The time integration algorithms allow one to integrate the equation of motion of the interacting particles and follow their trajectory. Knowing the positions and some of their time derivatives at time t (the exact details depend on the type of algorithm), the integration scheme gives the same quantities at a later time
δt
Fig. 2.2 A general flow chart for molecular dynamics simulation.
Initialize Positions and Velocities ri(t0), vi(t0)
Update Neighbor list
Solve the equations of motion numerically
Perform T/V/P scaling (ensemble)
t = t + dt Calculate Forces (Using Potential Model)
Calculate desired physical quantities
Is time Over
t > tmax Analyze Data
No Yes
Initialize Positions and Velocities ri(t0), vi(t0)
Update Neighbor list
Solve the equations of motion numerically
Perform T/V/P scaling (ensemble)
t = t + dt Calculate Forces (Using Potential Model)
Calculate desired physical quantities
Is time Over
t > tmax Analyze Data
2.4.1 INTEGRATORS
Different methods can be used to solve the classical equations of motion. Two popular integration methods for MD calculations are the velocity Verlet algorithm [24-25] and the predictor-corrector algorithms [26-28]. The MD code with the MEAM potential was implemented with a velocity Verlet integrator and the code with the Glue-type potential was implemented with a predictor-corrector integrator.
2.4.1.1 VELOCITY VERLET ALGORITHM
In the velocity Verlet algorithm positions and velocities at time t +δt are obtained from the same quantities r
( )
t , v( )
t at time t in the following way:Given r
( )
t , v( )
t and f( )
tStep 1: Calculate position at t+δtand velocity at t+δt/2
(
) ( ) ( )
( )
22 1 δt m t f δt t ν t r δt t r ⎟ ⎠ ⎞ ⎜ ⎝ ⎛ ⎟ ⎠ ⎞ ⎜ ⎝ ⎛ + + =
+ (6)
(
) ( )
( ) ( )
δ tm t f t v δt/ t v ⎟ ⎠ ⎞ ⎜ ⎝ ⎛ ⎟ ⎠ ⎞ ⎜ ⎝ ⎛ + = + 2 1
Step 2: Evaluate force at t+δt; f
(
t +δt)
.Step 3: Calculate velocity at t+δt
(
) (
)
(
)
δtm δt t f δt/ t v δt t v ⎟ ⎠ ⎞ ⎜ ⎝ ⎛ + ⎟ ⎠ ⎞ ⎜ ⎝ ⎛ + + = + 2 1
2 (8)
Now all quantities for the new step t +δt have been found, go back to step 1. Here, δt is the molecular dynamics time step for the simulation, which is typically on the order of femtoseconds and m is the particle mass.
This algorithm has many desirable properties because its form is exactly time reversible (which allows the equations of motion to be propagated forward in time without iteration) and symplectic (the volume in phase space is conserved), insuring long simulation time stability and convergence.
2.4.1.2 PREDICTOR-CORRECTOR ALGORITHM
Step1: Predictor - From the positions and their time derivatives, all known at timet, one “predicts” the same quantities at time t +δt by means of a Taylor expansion.
(
t δt)
r( )
t δtv( )
t / δt a( )
t / δt b( )
t ... pr + = + +1 2 2 +1 6 3 +
(
t δt) ( )
v t δta( )
t / δt b( )
t ... pv + = + +1 2 2 +
(
t δt) ( )
a t δtb( )
t ... pa + = + +
(
t δt)
... pb + = (9)
The p superscript refers to predicted values. The variables are
r = position
v = velocity ⎟ ⎠ ⎞ ⎜ ⎝ ⎛ dt dr
a = acceleration ⎟⎟
⎠ ⎞ ⎜⎜ ⎝ ⎛ 2 2 dt r d
b = Third derivative of position with respect to time ⎟⎟
⎠ ⎞ ⎜⎜ ⎝ ⎛ 3 3 dt r d
Step 2: Force evaluation - The force is computed at time t +δt taking the gradient of the potential at the predicted positions. The resulting acceleration value called corrected
acceleration at time t+δt;
(
)
m F
δt
t
acceleration” ap
(
t +δt)
. The difference between the two constitutes an error (which represents the discrepancy between Taylor-series second derivative and the acceleration calculated explicity from force).(
t δt)
ac(
t δt)
ap(
t δt)
Δa + = + − + (10)
Step 3: Corrector - This error is used to “correct” positions and their derivatives. All the corrections are proportional to the error, with the coefficient of proportionality
(
c0,c1,c2...)
determined to maximize the stability and accuracy of the algorithm.(
t δt)
rp(
t δt)
c Δa(
t δt)
cr + = + + 0 +
(
t δt)
vp(
t δt)
c Δa(
t δt)
cv + = + + 1 +
(
t δt)
ap(
t δt)
c Δa(
t δt)
ca + = + + 2 +
(
t δt)
... cb + = (11)
Table 2.1 Coefficient values for a second order Nordsieck-Gear predictor-corrector method.
C0 = 1/6 C1 = 5/6 C2 = 1 C3 = 1/3
The predictor-corrector algorithm can achieve a higher degree of energy conservation than the velocity Verlet algorithm with a longer time step. However, velocity Verlet algorithms are easier to implement than predictor corrector algorithms.
2.5 THERMOSTATS
Appropriate temperature control methods must be incorporated into simulations that maintain constant temperature. The temperature is defined by the ensemble average of the kinetic energies of all particles as:
2 2
1mv2 = KBT (12)
simple and straightforward to code and was used in our Monte Carlo simulations. They suffer the drawback that they are not time-reversible or deterministic, properties that become important in some advanced MD techniques.
In the extended system method, the system is allowed to interact with the surrounding environment through some thermal constraints. The system may be coupled to a heat bath to ensure that the average system temperature is maintained close to the requested temperature. When this is done the equations of motion are modified and the system no longer samples the microcanonical ensemble. Instead trajectories in the canonical (NVT) ensemble, (or something close to it) are generated. Many different methods exist to specify the interaction between the atomic system and the environment. The Nose-Hoover thermostat is one such method and has been used in our MD simulations.
2.5.1 HOOVER THERMOSTAT
m p r i i = & i i
i F p
p& = −ξ
(
)
⎟⎟ ⎠ ⎞ ⎜⎜ ⎝ ⎛ + − =∑
= N i B ii f K T
m p Q 1 2 1 1
ξ& (13)
where f is the degrees of freedom of the physical system (e.g. 3N), T is the desired temperature and Q is the ‘fictitious’ mass of the additional degree of freedom (reservoir). The choice of Q is critical in the implementation of this thermostat. The thermodynamic ‘friction’ constant dynamically alters the velocities of the individual atoms such that the temperature of the system is adjusted towards the desired temperature. The Nose-Hoover thermostat is more complicated than other methods. However, it is also the best and, therefore, most used thermostat today for NVT simulations.
2.6 PERIODIC BOUNDARY CONDITIONS
one time is still expensive. Simulations are therefore limited to systems with tens of thousand of atoms on personal computers and about a billion atoms on super computers. To model a macroscopic system in terms of a finite simulation system of N particles, the concept of periodic boundary conditions [3] is often employed. They are useful for simulating a part of a bulk system with no surfaces present and they have been used in all of our simulations.
REFERENCES
1. U. Burkert, N. L. Allinger, Molecular Mechanics, (1982).
2. J. R. Shewchuk, An introduction to the conjugate gradient method without the agonizing pain, (1994), Carnegie Mellon University.
3. M. P. Allen, D. J. Tildesley, Computer Simulations of Liquids, (1987), Clarendon Press, Oxford.
4. J. M. Haile, Molecular Dynamics Simulation: Elementary Methods, (1992), Wiley, New York.
5. D. C. Rapaport, The Art of Molecular Dynamics Simulation, (2004), 2nd ed. Cambridge University Press.
6. D. Frenkel, B. Smith, Understanding Molecular Simulations: From Algorithms to Applications, (1996), Academic Press.
7. N. Metropolis, A. W. Rosenbluth, M. N. Rosenbluth. A. H. Teller and E. Teller, J. Chem. Phys., 21 (1953) 1087.
8. K. Binder, editor, Monte Carlo Methods in Statistical Physics, (1986), second edition, Springer-Verlag.
9. K. Binder, editor, Applications of the Monte Carlo Method in Statistical Physics, (1984), Springer-Verlag.
10. K. Binder, editor, The Monte Carlo Method in Condensed Matter Physics, (1992) Springer-Verlag.
11. S. Foiles, M. Baskes, M. Daw, Phys. Rev. B, 33 (1986) 7983. 12. M. Finnis, J. Sinclair, Philo. Mag. A, 50 (1984) 49.
13. K. Jacobsen, J. Norskov, M. Puska, Phys. Rev. B, 35 (1987) 7423. 14. F. Ercolessi, J. Adams, Europhys. Lett., 26(8) (1994) 583.
15. F. Ducastelle, Computer simultions in material science, (1991), Kluwer, Doredrect. 16. A. Sutton, Electronic Structure of Materials, (1993), Clarendon Press, Oxford. 17. A. E. Carlsson, (1990). Beyond pair potentials in elemental transition metals and semiconductors. Solid State Physics, 43, Academic Press, New York, 1-91.
18. M. I. Baskes, Phys. Rev. B, 62 (1992) 2727. 19. M. I. Baskes, Mater. Chem. Phys., 50 (1997) 152.
21. P. Deurinck, C. Creemers, Surf. Sci., 441 (1999) 493. 22. S. M. Foiles, Phys. Rev. B, 32 (1985) 7685.
23. X. Y. Liu, P. P. Ohotnicky, J. B. Adams, C. L. Rohrer, R. W. Hyland, Surf. Sci., 373 (1997) 357.
24. L. Verlet, Phys. Rev. 159 (1967) 98.
25. W. C. Swope, H. C. Anderson, P. H. Berens, K. R. Wilson, J. Chem. Phys. 76 (1982) 637.
26. S. C. Chapra, R. P. Canale, Numerical Methods for Engineers, (1988), McGraw-Hill, New York.
27. C. W. Gear, Numerical initial value problems in ordinary differential equations, (1971), Prentice-Hall, Englewood Cliffs, NJ.
CHAPTER 3
INTERATOMIC POTENTIAL FOR Al-Pb ALLOY
3.1 INTRODUCTION
A modified embedded atom method interatomic potential designed for Al-Pb alloys was used in this work. Among various semiempirical atomic potentials, the embedded-atom method (EAM) proposed by Daw et al. [1-3] has been very successful in various applications [4]. However, the EAM potential has limitations in describing alloys and compounds because it cannot deal with elements that have directional bonding characteristics. Baskes proposed the modified EAM (MEAM) that includes angular contributions of electron density to describe the directionality of bonding [5-9].
elements that exhibit the directionality of atomic bonding. The directional bonding permits a better representation of the inhomogeneous environment around an atom when its surrounding neighbors are from different species. This enables the MEAM potential to be highly applicable to alloy systems. Moreover, the determination of the pair interactions involves principally a reference structure and the universal equation of state, which precludes any further paratermization of the potential as required for EAM potentials.
The MC simulations and the atomistic calculations to predict the structures and the segregation-induced stability of grain boundaries in Al-Pb nanoalloys, as discussed in chapters 4 and 5, were carried out using the MEAM potential. The MEAM potential was developed following the procedure given by Baskes and coworkers, with its parameters fit to the results of first principles DFT calculations. Calculations given in chapter 6 and 7 pertaining to a cluster-to-segregation cross over size determination and the DSUM model were also performed using the MEAM potential.
from ab initio linear muffin-tin orbitals calculations and a massive quantum mechanical database of atomic forces generated using ultrasoft pseudopotentials in conjunction with ab initio molecular statics simulations.
The Glue-type interatomic potential is computationally simple and therefore faster when compared to the MEAM potential. That prompted us to further use it for carrying out simulations pertaining to tensile deformation of Al-Pb alloys (Chapter-4). The Glue potential gave reasonable values for the stacking fault energy of Al.
3.2 MEAM FORMALISM
The total energy E of a system of single type of atoms in the MEAM can be written as:
( )
( )
( )∑
∑
⎟⎟ ⎠ ⎞ ⎜⎜ ⎝ ⎛ + = ≠i j i
ij ij i
i
Tot F R
E ρ φ
2 1
(1)
![Fig. 1.2 Schematic representation of the variation of yield stress as a function of grain size from nanocrystalline to microcrystalline regimes [19]](https://thumb-us.123doks.com/thumbv2/123dok_us/1236321.1156158/31.612.169.419.104.305/schematic-representation-variation-stress-function-nanocrystalline-microcrystalline-regimes.webp)
![Fig. 1.3 Young’s modulus as a function of porosity for nanocrystalline Pd and Cu [32].](https://thumb-us.123doks.com/thumbv2/123dok_us/1236321.1156158/34.612.182.420.104.327/fig-young-modulus-function-porosity-nanocrystalline-pd-cu.webp)

![Fig. 3.1 Potential screening of atoms i and k by atom j [13].](https://thumb-us.123doks.com/thumbv2/123dok_us/1236321.1156158/83.612.212.432.266.476/fig-potential-screening-atoms-i-k-atom-j.webp)