A
NEW BINARY PARTICLE SWARM OPTIMIZER TO SELECT
A
SMALLER SUBSET OF GENES FOR LEUKAEMIA CANCER
CLASSIFICATION
Mohd Saberi Mohamad'<, Sigeru Omatu', Safaai Deris2 and Michifuci Yoshioka', Anazida Zainal2
'Department of Computer Science and Intelligent Systems, Graduate School of Engineering, Osaka Prefecture University,
Sakai, Osaka 599-8531, Japan 2Department of Software Engineering, Faculty of Computer Science and Information System, Universiti Teknologi Malaysia, 81310 Skudai, Johor, Malaysia
Email: [email protected].{sigeru.yoshioka}@.cs.osakafu-u.ac.jp. [email protected]
Abstract: The application of microarray data for cancer classification has recently gained in popularity. The main problem that needs to be addressed is the selection of a smaller subset of genes from the thousands of genes in the data that contributes to a disease. This selection process is difficult because of the availability of the small number of samples compared to the huge number of genes, many irrelevant genes, and noisy genes. Therefore, this paper proposes an improved binary particle swarm optimization to select a near-optimal (smaller) subset of informative genes that is relevant for cancer classification. Experimental results show that the performance of the proposed method is superior to the experimental method and other related previous works in terms of classification accuracy and the number of selected genes.
Keywords: Gene Selection, Hybrid Approach, Microarray Data, Particle Swann Optimization.
1. INTRODUCTION
Microarray is a device that can be employed in measuring of expression levels of thousands of genes simultaneously. It finally produces microarray data that contain useful information of genomic, diagnostic, and prognostic for researchers [5]. Thus, there is a need to select informative genes that contribute to a cancerous state [7]. However, the gene selection process poses a major challenge because of the following characteristics of microarray data: the huge number of genes compared to the small number of samples (higher-dimensional
data), irrelevant genes, and noisy data. To overcome this challenge, a gene selection method '
is used to select a subset of genes that increases the classifier's ability to classify samples "
more accurately [6].
Recently, several methods based on particle swarm optimization (PSO) are proposed
to select informative genes from microarray data [1],[2],[8]. PSO is a new evolutionary technique proposed by Kennedy and Eberhart [3]. It is motivated from the simulation of
social behaviour of organisms such as bird flocking and fish schooling. Shen et al. have
proposed a hybrid of PSO and tabu search approaches for gene selection [8]. However, the
results obtained by using the hybrid method are less significant because the application of
tabu approaches in PSO is unable to search a near-optimal solution in search spaces. Next, an
improved binary PSO have been proposed by Chuang et al. [1]. This approach produced
100% classification accuracy in many data sets, but it used a higher number of selected genes
to achieve the higher accuracy. It uses the higher number because of all global best particles
are reset to the same position when their fitness values do not change after three consecutive
iterations. Li et al. have introduced a hybrid of PSO and GA for the same purpose [2].
Unfortunately, the accuracy result is still not high and many genes are selected for cancer
classification since there is no direct probability relation between genetic algorithms (GA)
and PSO. Generally, the proposed methods that based on PSO [1],[2],[8] are intractable to efficiently produce a near-optimal (smaller) subset of informative genes for higher
classification accuracy. This is mainly because the total number of genes in microarray data is
too large (higher-dimensional data).
2. METHODS
"~I
2.1 The Standard Version of Binary PSO (BPSO)
Binary PSO (BPSO) is initialised with a population of particles. At each iteration, all particles
move in a problem space to find the optimal solution. A particle represents a potential
solution (gene subset) in an n-dimensional space [4]. Each particle has position and velocity
vectors for directing its movement. The position vector and velocity vector of the ith particle
in the n-dimension can be represented
as Xi
== (x~,x; ,...,x;)
andV;
== (v~,v; ,..., v;) ,
respectively, where x; is a binary bit, i=I,2, ..m (m is the total number of particles); d=I,2,..n
(n is the dimension of data).
In gene selection, the vector of particle positions is represented by a binary bit string
of length n, where n is the total number of genes. Each vector denotes a gene subset. If the
value of the bit is I, it means that the corresponding gene is selected. Otherwise, the value of
if
=
(gbest' ,gbest2. Sig(vt) E [0,I].
, 'previous works ir e ,
". 3) for the posil
if 1
if 1
o
means that the corresponding gene is not selected. Each particle in a generation updates its own position and velocity according to the following equations:es
(1)
ed
ry
Sig(v1) = _1_"I +e-v; (2)
of
ve if Sig(v1) > r3 , then x1 = 1; else x1 =
o.
(3)he where w is the inertia weight. c, and C2 are the acceleration constants in the interval [0,2].
of
rl,r2 , and r1 are random values in the range [0,1]. Pbest, = (pbest!,pbest/, ...,pbestn and
an
ed Cbest = lgbest' .gbest? , ....gbest") represent the best previous position ofthe ith particle and the
es
global best position of the swarm (all particles), respectively. Sig(vj) is a sigmoid functionles where Sig(vj)E[O,lj.
ve
2]. 2.2 An Improved Binary PSO (IPSO)
:er
A.)
In this paper, we propose IPSO for gene selection. It is introduced to solve the problemsto
derived from the microarray data, overcome the limitation of the related previous worksr
[1],[2],[8], and inline with the diagnostic goal. IPSO in our work differs from the methods inis the previous works in one major part. The major difference is that we modify the existing rule
(Eq. 3) for the position update, whereas the previous works used a standard rule (Eq. 3).
Firstly, we analyse the sigmoid function (Eq. 2). This function represents a probability for
x
jd
to be 0 or 1 (P(xj
d
= 0) or P(xj
d
= I)). It has the properties as follows:
(4)
s
lim Sig(v1)=
0
v~1-+-:n (5)
if vj
d= 0 then
p(x1
= I) = 0.5 or Sig(O) = 0.5 (6)if
v;
<
0 then P(x;=
1)<
0.5 or Sig(v1<
0) < 0.5 (7)if Vi d > 0 then P(x;
=
I) > 0.5 or Sig(v; > 0) > 0.5 (8)P(X; =O)=I-P(x; =1) (9)
Also note that the value of
x;
can change even if the value of v; does not change,due to the random number
'3
in the Eq. 3. To propose IPSO, the following approaches aresuggested:
2.2.1 Modify the existing rule of position update (Eq. 3)
In order to support the diagnostic goal that needs the least number of genes for accurate
cancer classification, the rule of position update is simple modified as follows:
(10)
The value of particle velocity,
It;
in the modified formula (Eq. 10) represents thewhole of elements of a particle velocity vector, whereas the standard formula represents a
single element. Moreover,
It;
is also a positive real number. Based on this positive velocityvalue, Eq. 2, and Eq. 10, the possibility of x;J
=
1 is too small. This situation causes a smallernumber of genes is selected in order to produce a near-optimal gene subset from higher
dimensional data (microarray data).
2.2.2 A Simple Modification of the Formula of Velocity Update (Eq, 1)
In this formula, the calculation of the value of velocity is completely based or: the whole of
bits of a particle position vector, whereas the original formula (Eq. 1) is based on a single bit.
j
A(X;}e[O:
'ned at
http://ww
Firstly, we al
are then used
(11)
2.2.3 Calculation for the distance of two positions
The number of different bits between two particles relates to the difference between their
positions. For example, Gbest
=
[0011101000] and Xi = [1100110100]. The differencebetween Gbest and Xi is [-1-11'10 -11-100]. A value of 1 indicates that compared with
the best position, this bit (gene) should be selected, but it is not selected, which may decrease classification quality and lead to a lower fitness value. In contrast, a value of -1 indicates that,
compared with the best position, this bit should not be selected, but it is selected. The
selection of irrelevant genes makes the length of the subset longer and leads to a lower fitness
value. Assume that the number of 1 is
a,
whereas the number of -1 is b. We use the absolute value of (a - b), I a - b 1 to express the distance between two positions. In this example,I
a - b1=13 - 41=
1, so the distance between Gbest and Xi is Gbest - Xi=
1.PSO (BPSO).
Figure 1 sho
2.2.4 Fitness function
ige,
are
A fitness value of a particle (a gene subset) is calculated as follows:
fitness(X;)=w1 x A(X;)
+
(wz(M -R(X;))I M) (12)in which A(Xj ) E
[0)]
is leave-one-out-cross-validation (LOOCV) accuracy on the trainingset using the only genes in X;. This accuracy is provided by support vector machine
ate classifiers (SVM). R(X;) is the number of selected genes in Xj' M is the total number of
genes for each sample in the training set. WI and W zare two weights.
3. EXPERIMENTS
3.1 Data Sets and Experimental Setup
A real microarray data sets is used to evaluate IPSO, namely the leukaemia cancer data set.
The leukaemia data set contains 72 samples of the expression levels of7,129 genes. It can be
obtained at http://www.broad.mit.edulcgi-binlcancer/datasets.cgi.
Firstly, we applied the gain ratio technique to pre-select SOO-top-ranked genes. These
genes are then used by IPSO in the next process. In this paper, LOOCV is used to measure
classification accuracy of a gene subset that produced by IPSO. The implementation of
LOOCV is in exactly the same way as did by Chuang et al. [I] Two criteria following their importance are considered to evaluate the performance of IPSO: LOOCV accuracy and the
number of selected genes. A near-optimal subset that produces the highest classification
accuracy with the smallest number of genes is selected as the best subset. Several experiments
are independently conducted 10times on each data set using IPSO and the standard version of binary PSO (BPSO). Next, an average result of the 10 independent runs is obtained.
3.2 Experimental Results
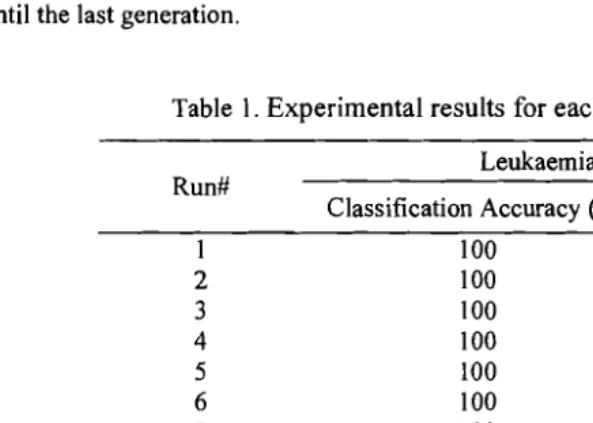
Based on the standard deviations of classification accuracy and the number of selected genes
in Table I, results that produced by IPSO were nearly consistent on the leukaemia data set.
Interestingly, all runs have achieved 100% LOOCV accuracy with less than five selected genes. This means that IPSO has efficiently selected and produced a near-optimal gene subset
from higher-dimensional data (microarray data).
Figure I shows that the average of fitness values of IPSO increases dramatically after
a few generations. The higher average produces a smaller subset of selected genes with higher
classification rate. The condition of velocity that should always be positive real numbers
provided in the initialisation method, and the new rule of position update provoke the early
convergence ofIPSO. In contrast, the average of fitness values ofBPSO was no improvement
until the last generation.
Run#
Table 1. Experimental results for each run using IPSO.
Leukaemia Data Set
Classification Accuracy (%) #Selected Genes
Classfit Accura Evaluat
I 100 4
2 100 2
3 100 4
4 100 4
5 100 3
6 100 4
7 100 4
8 100 3
9 100 4
10 100 3
#Select Genes
ote: The best result of e Selected Genes represen
Table 3. A compari
tv
Average±S.D 100±0 3.50±0.71
Note: Results of the best subsets shown in shaded cells. S.D. denotes the standard deviation, whereas #Selected Genes and Run# represent a number of selected genes and a run number, respectively.
Leukaemia Data Set
0.98
....
~ 0.96 0.94 I~PSOI1-
-BPSOif 0.92
0.9·
0.88 .jL..----~----~----~---_~---_----~
o 50 100 150 200 250 300
Generation
Figure 1. A relation between the average offitness values (10 runs on average) and the number of generations for IPSO and BPSO.
According to the Table 2, overall, it is worthwhile to mention that the classification
accuracy and the number of selected genes of IPSO are superior to BPSO in terms of the best,
average, and standard deviation results.
For an objective comparison, we compare our work with related previous works that
used PSO in their methods [1],[2],[8]. It is shown in Table 3. The averages of LOOCV
accuracy and the number of selected genes of our work were 100% and 3.5 selected genes,
respectively. The latest previous work also came up with the similar LOOCV result to ours,
Jilid 20, Bit. 4 (Disember2008) Jurnal Teknologi Maklumat
Evaluatio Classifica Accuracy #Selected Genes
te: The results of the best ork. A result in '( )' denotes OTS = A hybrid of PSO ar OGA = A hybrid ofPSO a
According'
produced the near-r position update that the optimal gene !
accuracy) for leuka
4. CONCLUSIO
In this paper, IP~
microarray data se
to the standard vel
the modified rule
each iterative, aJ
classification. For
proposed to incres
4. CONCLUSIONS
o
S.D 5.23 (21) (95.1 ) PSOGA (Li et al. [2]) 98.61224.70
100
1034
Jumal Teknologi Maklumat
216 98.61
IBPSO (Chuang et al.[I])
S.D
o
0.71 (7) (98.61) 100 3.50 PSOTS (Shen et al. [8]) Avera e2
100
(3.5) (100) The Best
IPSO [Our work]
Method IPSO The standard version of
binary PSO (BPSO) Data
Jilid 20, Bil. 4 (Disember 2008) Evaluation Classfication
L eu k
aerma
. Accuracy (%) #Selected GenesNote: The best result of each data set shown in shaded cells. S.D. denotes the standard deviation, whereas #Selected Genes represents a number of selected genes.
In this paper, IPSO has been proposed and tested for gene selection on the leukaemia micro array data set. Based on the experimental results, the performance of IPSO was superior
to the standard version of binary PSO and related previous works. This is due to the fact that
the modified rule of position update in IPSO causes a smaller number of genes is selected in
each iterative, and finally produce a near-optimal subset of genes for better cancer
classification. For future works, a combination between a constraint approach and PSO is
proposed to increase the classification accuracy.
According to Fig.
I
and Tables1-3,
IPSO is reliable for gene selection since it hasproduced the near-optimal solution from microarray data. This is due to the modification of
position update that causes the selection of a smaller number of genes. Therefore, IPSO yields
the optimal gene subset (a smaller subset of informative genes with higher classification
accuracy) for leukaemia cancer classification.
Table 3. A comparison between our method (IPSO) and other previous methods based on PSO.
but they used more than 1,000 genes to obtain the same result [I]. Overall, this work has
outperformed the related previous works in terms of LOOCV accuracy and the number of
selected genes.
Table 2. A comparison in terms of statistical results of the proposed IPSO and BPSO.
Data
Evaluation Classi fication
L eu k aerma . Accuracy #Selected (%) Genes
Note: The results of the best subsets shown in shaded cells. '.' means that a result is not reported in the related previous work. A result in '()' denotes an average result. #Selected Genes represents a number of selected genes.
ACKNOWLEDGEMENTS
This study was supported and approved by Universiti Teknologi Malaysia, Osaka Prefecture University, and Malaysian Ministry of Higher Education. The authors gratefully thank the referees for the helpful suggestions.
REFERENCES
[I] Chuang, L. Y., Chang, H. W., Tu, C. J. and Yang,
c.n.,
"Improved binary PSO for feature selection using gene expression data", Computational Biology & Chemistry, Volume 32, pp.29-38, 2008.[2] Li, S., Wu, X. and Tan, M., "Gene selection using hybrid particle swarm optimization and genetic algorithm", Soft Computing. Volume 12, pp.1039-1048, 2008.
[3] Kennedy, J. and Eberhart, R., "Particle swarm optimization", Proceedings of the 1995 IEEE International Conference on Neural Networks, Volume 4, pp.1942-1948, IEEE Press, 1995.
[4] Kennedy, J. and Eberhart, R., "A discrete binary version of the particle swarm algorithm", Proceedings of the 1997 IEEE International Conference on Systems, Man, and Cybernetics, Vo lume 5, ppAI 04-4108, IEEE Press, 1997.
[5] Knudsen, S., "A Biologist's Guide to Analysis of DNA Microarray Data", John Wiley & Sons, New York, 2002.
[6] Mohamad, M. S., Omatu, S., Deris, S. and Hashim, S. Z. M., "A model for gene selection and classification of gene expression data", International Journal of Artificial Life & Robotics, Volume II, Issue 2, pp.219-222, 2007.
[7] Mohamad, M. S., Omatu, S., Deris, S., Misman, M. F. and Yoshioka, M., "Selecting informative genes from microarray data by using hybrid methods for cancer classification", International Journal of Artificial Life & Robotics, Volume 13, Issue 2, 2008.
[8] Shen, Q., Shi, W. M. and Kong, W., "Hybrid particle swarm optimization and tabu search approach for selecting genes for tumor classification using gene expression data", Computational Biology & Chemistry, Volume 32, pp.53-60, 2008.