ABSTRACT
JERVIS, MATTHEW GABRIEL. The Application of Qualitative and Quantitative Research to Evaluate Whole Wheat Bread and Sweet Whey Powder. (Under the direction of Dr. MaryAnne Drake).
Both qualitative and quantitative data collection methods hold great importance in the research of food products and consumer perception. Qualitative research can be used to understand consumer behavior and motivation, or to develop a hypothesis and relies on non-quantifiable data. Quantitative research can be used to test a hypothesis and involves a strictly objective measurement of variables of interest. Two studies were designed to explore the use of these two diverse data collection techniques.
The first study was designed to determine children’s perceptions and attitudes
towards whole grain sliced sandwich breads to identify ideal whole grain breads for children. Focus groups, emotional response surveys, appearance liking surveys, and an adaptive choice based conjoint survey were conducted with children (n=173). From focus groups, children had an overall positive attitude towards breads, but darker colored breads, and breads with toppings and crumb particulates were disliked. Quantitative utility values from conjoint survey analysis confirmed that across elementary, middle and high school aged children, children preferred bread with a light crumb (inside of the bread), a light crust, and no topping or added textures or visual cues in the crumb. A soft crust with no topping, and a soft crumb with no crumb particles or flake crumb particles were also preferred. Children had a
topping to the loaf or slice of bread. These results demonstrated that children like soft breads with light colored crumb and crust with no fillings or toppings. Successful whole grain breads for children must have the visual appeal of a white bread.
The second study was designed to understand the impact that point of bleaching had
on the flavor and bleaching efficacy of various bleaching agents on sweet whey powder
(SWP). Colored Cheddar whey was manufactured, fat separated and pasteurized.
Subsequently, the whey (6.7% solids) was bleached, concentrated using reverse osmosis
(RO) to 14% solids and then spray-dried, or whey was concentrated prior to bleaching and
then spray dried. Bleaching treatments included: Control (CR) (no bleaching, 50°C, 60 min),
hydrogen peroxide (HP) (250 mg/kg, 50°C, 60 min), benzoyl peroxide (BP) (50 mg/kg,
50°C, 60 min), lactoperoxidase (LP) (HP 20 mg/kg, 50°C, 30 min), and external peroxidase
(EP) (2 dairy bleaching units (DBLU)/ml, 50°C, 30 min). The experiment was repeated in
triplicate. Sensory properties and volatile compounds of SWP were evaluated by a trained
panel and gas chromatography mass spectrometry, respectively. Bleaching efficacy
(norbixin destruction) and benzoic acid levels were measured using high performance liquid
chromatography. Differences in bleaching efficacy, sensory and volatile compound profiles
and benzoic acid were observed with different bleaching agents (p<0.05), consistent with
previous studies. Solids concentration impacted bleaching efficacy of HP (p<0.05) but not
other bleaching agents. SWP from whey bleached with HP or LP following RO had
increased cardboard and fatty flavors and higher concentrations of lipid oxidation compounds
compared to SWP from whey bleached prior to RO. SWP bleached with BP after RO
indicated that solids concentration impacted bleaching efficacy of HP, and influenced off
The Application of Qualitative and Quantitative Research to Evaluate Whole Wheat Bread and Sweet Whey Powder
by
Matthew Gabriel Jervis
A thesis submitted to the Graduate Faculty of North Carolina State University
in partial fulfillment of the requirements for the degree of
Master of Science
Food Science
Raleigh, North Carolina 2014
APPROVED BY:
_______________________________ ______________________________ Dr. Maryanne Drake Dr. Allen Foegeding
Committee Chair
DEDICATION
BIOGRAPHY
Matthew Gabriel Jervis was born on April 27th, 1979 to Denise Jervis and Charles Jervis. Matthew was raised in suburban Philadelphia and enjoyed exploring the back roads and backwoods of Bucks County. Matthew attended Penn State University, and graduated with a Bachelors of Science in Education in 2001. Matthew became a teacher focusing on Math and Science education for middle and elementary schools. During this time, he married Suzanne Marie Jervis on June 14th, 2003.
ACKNOWLEDGMENTS
First and foremost, I must extend my deepest appreciation to Dr. MaryAnne Drake for taking a chance on someone without a background in food science, and allowing me to prove myself in the field. My time in your lab has been in invaluable experience that I will carry with me always. Deepest thanks to Evan Miracle whose tireless work ethic and willingness to help the students in the lab was rivaled only by his enthusiasm and love for life. It’s been a great honor to work with you and an even greater honor to call you a friend. Additionally, I would like to thank Dr. Foegeding and Dr. Sanders. I could not have asked for a more supportive committee. It is a true honor to have had the chance to work with you both as leaders in the field of food science and research.
To the Drake lab, you are an amazing group of people. Thank you for the support, camaraderie and the laughs. Sitting in 331 with some of the smartest people I’ve ever met has been equally enlightening and entertaining.
To James Dewees, Justin Vernon, and Chris Thile (and brothers), thank you for the support that you provided me as I wrote and researched. You’re not aware of the level of encouragement and motivation that you provided me, but I don’t think I could have done it without you.
TABLE OF CONTENTS
LIST OF TABLES . . . vii
LIST OF FIGURES . . . viii
CHAPTER 1: THE USE OF QUALITATIVE RESEARCH METHODS IN QUANTITATIVE SCIENCE: A REVIEW . . . 1
Abstract . . . 3
Introduction . . . 5
Qualitative Approaches. . . 6
Ethnography. . . 6
Means End Chain . . . 8
Focus Groups. . . . 13
Sorting/Grouping . . . 18
Projective Mapping & Napping . . . 24
Conclusions . . . 29
References . . . 31
CHAPTER 2: DETERMINING CHILDREN’S PERCEPTIONS, OPINIONS, AND ATTITUDES FOR SLICED SANDWICH BREADS . . . 45
Abstract . . . 47
Methods . . . 51
Results and Discussion. . . . . 57
Conclusions . . . 65
References . . . 67
CHAPTER 3: THE INFLUENCE OF SOLIDS CONCENTRATION AND BLEACHING AGENT ON BLEACHING EFFICACY AND FLAVOR OF SWEET WHEY POWDER . . . . . 80
Abstract . . . 82
Introduction . . . 84
Materials and Methods . . . 87
Results and Discussion . . . 94
Conclusions . . . 99
LIST OF TABLES Chapter 1.
Chapter 2.
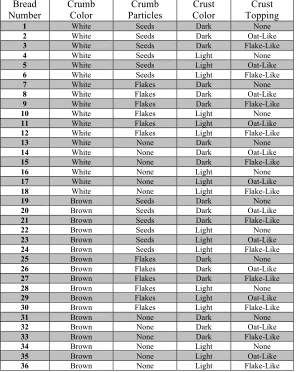
Table 2.1 All Bread Composites and Their Attributes and Levels . 73 Table 2.2 Top Focus Group Emotional Responses . . . 74 Table 2.3 Appearance Liking Scores . . . 75 Table 2.4 Attribute Importance from Conjoint Analysis . . 78 Table 2.5 Zero-Centered Utility Values for Attributes and Levels of Each
Segment from Conjoint Analysis . . . . 79
Chapter 3.
Table 3.1 Descriptions of Sweet Whey Powders (SWP) Treatments . 106 Table 3.2 Mean Mineral Compositions of Sweet Whey Powders . 107 Table 3.3 Mean color (L*, a*, and b* values) of spray dried rehydrated
sweet whey powder (SWP) bleached before or after reverse
osmosis (14% solids) . . . 108 Table 3.4 Mean sensory profiles of sweet whey powders (SWP) bleached
before or after reverse osmosis (14% solids). . . 110 Table 3.5 Selected Volatile Compounds of Sweet Whey Powders (SWP)
LIST OF FIGURES Chapter 1.
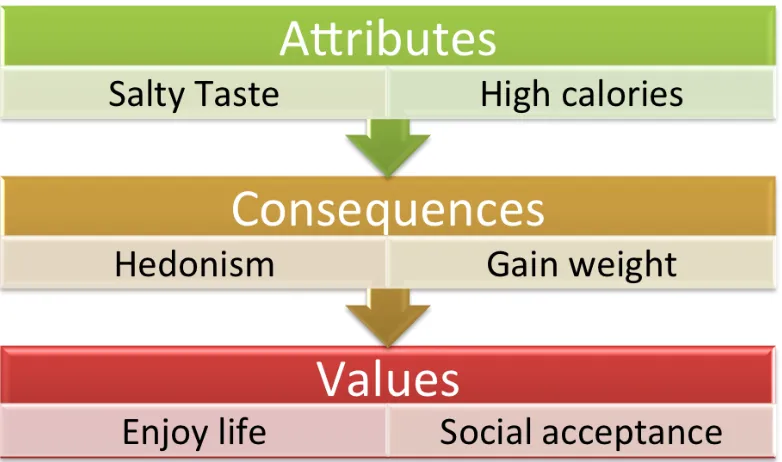
Figure 1.1 Example Means-End Chain for Potato Chips . . 40 Figure 1.2 Simplified Hierarchical Value Map of Consumer Choice of Hip
Pressure Processed Juices in Norway . . . . 41 Figure 1.3 Hierarchical Value Map of Consumer Choice of High Pressure
Processed Juice . . . . . . 42 Figure 1.4 Two-Dimensional MDS from Cheese Name Sorting Among
Consumers Experienced with European Cheeses . . 43 Figure 1.5 Two-Dimensional MDS from Chees Name Sorting Among Consumers
Not Experiences with European Cheeses . . . 44
Chapter 2.
Figure 2.1 Pictures of Crust and Crumb for Emotions and Liking Surveys and
ACBC Survey . . . 71
Figure 2.2 Thirty-six Composite Pictures for Emotions and Liking Survey 72 Figure 2.3 Explanation Image Used in Emotions Survey . . 76 Figure 2.4 Example Image Used in Emotions Survey . . . 76 Figure 2.5 Principal Component Biplot of Breads and Emotional Responses 77
Chapter 3.
Figure 3.1 Mean Percent Norbixin Destruction of Sweet Whey Powders (SWP) from Whey Bleached Before or After Reverse Osmosis
(14% solids) . . . 109 Figure 3.2 Principal Component Biplot of Sensory Profiles of Sweet Whey
Figure 3.3 Principal Component Biplot of Volatile Compound Analysis (GM-MS) of sweet whey powders (SWP) bleached before
or After Reverse Osmosis (14% Solids) . . . 112 Figure 3.4 Residual Benzoic Acid (mg/kg) of Sweet Whey Powders (SWP)
THE USE OF QUALITATIVE RESEARCH METHODS IN QUANTITATIVE SCIENCE: A REVIEW
JERVIS, M.G.1, and DRAKE, M.A.1,2
1Department of Food, Bioprocessing and Nutrition Sciences
Southeast Dairy Foods Research Center
North Carolina State University
Raleigh, NC 27695
2Corresponding author. TEL: (919) 513-4598; FAX: (919) 515-7124; EMAIL:
ABSTRACT
Qualitative research in the field of food science strives to understand consumer behavior and motivation. Often, these methods are used to develop a hypothesis, which can be tested through quantitative research. Traditionally qualitative methods can provide excellent insight to consumer behavior, but the data collected can be difficult to organize and interpret. Focus groups are the most common qualitative research tool applied to understand consumer behavior and identify possible areas of focus for product development. However ethnography and means-end chain analysis can also be applied to understand consumer behavior and personal values. Many new qualitative techniques have been developed that attempt to mimic data normally collected in quantitative research. Grouping and projective mapping allow consumers to represent similarities and differences between products and produce maps that show how consumers perceive various attributes of these products. Each method has benefits and drawbacks, and each demands a particular data analysis
methodology. Understanding these approaches is important in choosing a research method and proper interpretation of the collected data.
PRACTICAL APPLICATIONS
KEY WORDS
INTRODUCTION
Qualitative research plays a pivotal role in the progress of quantitative research. Qualitative data is collected from non-quantifiable or non-statistically derived sources. The qualitative approach seeks to examine responses in an uncontrolled, natural environment. Rather than relying on instrumental measurements, behaviors are observed by an
investigator, and recorded through notes, video/audio recordings, and/or personal interaction. These observations are analyzed with consideration given to the environment of the
observation, emotional responses that may be given, general themes discussed or observed, and implicitly intended meanings. In addition, variability in natural consumer language must be considered since similar responses can represent vastly different feelings in respondents. Qualitative data can help researchers understand complex emotional responses and can lead to understandings that may not be revealed in a quantitative study. In a broad sense, the goal of qualitative research is to understand why people react the way they do to a stimulus or experience (Maxwell, 2005; Harris et al. 2009). Qualitative methods can offer a higher degree of depth and detail than a quantitative method, at the cost of precision and
applicability to a larger population. Given the open-ended nature of qualitative study, new ideas can be fully explored and discussed outside of the rigid framework that exists in quantitative studies. Since qualitative studies typically use purposive sampling, these new ideas cannot be applied to a larger population without further quantitative studies.
qualitative data are varied and constantly evolving. Some methods, such as ethnography, are passive and involve observation of behavior in natural settings while the observed is unaware that they are being watched. Other methods are more involved and require careful planning, and execution, such as the focus group. Both of these methods allow for direct exposure to consumer derived language and can provide insight that would not be available through strictly quantitative methods. This review will examine some of the prominent qualitative data collection methods, as well as some new and novel methods with regard to their strengths, weaknesses, and applications in the field of food science.
QUALITATIVE APPROACHES
ETHNOGRAPHY
Collection of ethnographic data has no set method, but generally involves an observer making general observations about the appropriate situation while recording behaviors of interest. In a recent study of latte-style coffee beverage purchasing patterns, Jervis et al.
(2012) made observations while sitting in coffee restaurants, posing as a consumer. In that study, observations were made at different times throughout the day, at multiple coffee shops, and multiple branches of each in order to observe a general coffee-house environment, rather than focusing on one particular chain or time of day. Observations of coffee
consumers were conducted using a checklist of 18 behaviors and attributes including gender, approximate age, coffee size, and additional purchases made. In addition, free-flow
observations were made about the atmosphere such as the general conversational volume, music played and brightness, and general behavior of consumers in a location such as length of stay and typical activities that consumers engaged in. This data was analyzed for
frequency of each behavior with consideration given for the general “feel” of each location. This allowed the researchers to tell the general story of each location. This data was used to develop a follow-up conjoint survey, and to interpret the results of that survey. The most influential factor in consumer choice of latte purchase was the culture that a coffee restaurant develops. This culture includes the general volume of the environment, the music playing, table size, general demographic makeup of consumers and baristas, Wi-Fi availability, and other similar factors.
Ethnography has also been used to study sugar consumption patterns in pregnant women (Graham et al. 2013). In this case, participants were recruited to complete
done to account for the relatively small population of pregnant women that may be observed without extensive periods of waiting, and the inability to easily identify pregnant women based on visual cues alone. Participants were asked questions about their food choices during pregnancy, but were not initially aware of the goal of studying sugar consumption. Interview and survey responses were recorded, and important words and concepts were identified. Categories of responses were created and recorded in a data matrix to compare and contrast sugar consumption patterns.
Ethnography is a powerful tool to analyze purchase choice. It can be conducted without specialized tools or software, and can identify influential factors that may not be identified using quantitative methods. The conclusions of an ethnographic study may be limited based on the general subjectivity of the method, and the limited role of the observer. Observations can be difficult and time-consuming. Further, the actual population or
environment may not be readily accessible, limiting the use of ethnography. Despite these limitations, ethnography still holds great value and importance in the study of the consumer motivation and behavior, and is accessible with minimal training and resources.
MEANS END CHAIN
(ends). It is important to note, especially in the context of food and nutrition science, that these consequences may be immediate in terms of satiety or hedonism, or may be delayed in terms of nutritional delivery (Gutman, 1982; Costa et al. 2004; Santosa and Guinard, 2011). The multiple connections between the various attributes of a product, the consequences that result, and an individual’s personal values (collectively referred to as ACV) form visual chains that represent the essence of MEC. As values increase in importance to the consumer, so do the attributes that lead to that value (Gutman, 1982). A consumer may have multiple chains for a product based on the various values a product may contribute to, and they may also have incomplete chains for a product if they are inexperienced with the product, or the product is considered basic (Lind, 2007). By understanding these chains, a better
understanding of consumer decision-making processes, both conscious and unconscious, can be gained (Olson and Reynolds, 2001). Figure 1 shows an example MEC that represents a consumer’s view of potato chips.
MEC data is collected through an interviewing technique known as laddering in which consumers are asked a series of probing questions aimed at eliciting their motivations behind their choices, and the linkages (ladders) between the product attributes, the
consequences, and their values. A preliminary step in laddering involves the identification of specific product attributes by the consumer. This process can be in the form of a
After the elicitation procedure, the actual laddering interview begins. Interview questions used are typically a variation of the question, “why is this important to you…?” (de Ferran and Grunert, 2007). This method makes explicit the links between concrete product attributes and abstract motivators and values. The interviewer, depending on the product being studied and the number of subjects available, can employ either soft laddering or hard laddering techniques. Soft laddering encourages a natural and unrestrained flow to the conversation. The interview is later reviewed and the researcher constructs the links between ACVs. Alternatively, hard laddering requires the participant to manually and explicitly generate or verify the links between ACVs. Soft laddering tends to produce more MECs, and MECs of higher abstraction levels (consequences and values), which makes it ideal for complex purchase motivations. Soft laddering may also improve the probability of
uncovering a relevant MEC with a high predictive ability due to the unstructured nature of the interview (Grunert and Grunert, 1995). Hard laddering is ideal for less motivationally complex situations, and when a larger sample size is needed as it is both easier and faster to administer and analyze. Hard laddering can provide more detailed and comprehensive results with less bias than soft laddering (Costa et al. 2004). Due to the rigid structure of the interview, hard laddering may result in participants reporting false associations, and lead to lower motivation levels. Both hard and soft laddering have benefits and drawbacks, but produce similar results (Russel et al. 2004). Often the choice of methods is based on the sample size needed. Soft laddering requires a substantial time commitment to review each interview, and extract the appropriate data. Hard laddering techniques are less time
desirable when a large sample size is required, and a product is of low complexity. Regardless of the method chosen, the end products for each consumer are MECs that represent the linkages between ACVs.
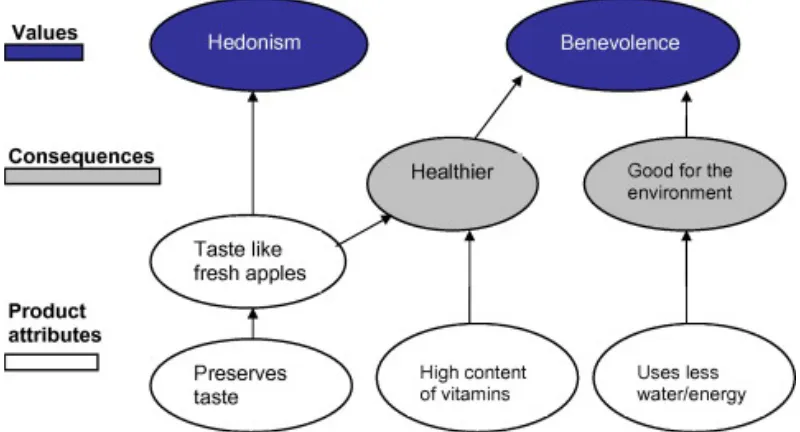
Once MECs have been collected, participant data is aggregated in a coding process that classifies that various ACVs into broader categories to accurately reflect all relevant details while balancing accuracy and manageability. Finally, the links between these new broad categories are analyzed and aggregated into a single graphical representation known as a hierarchical value map (HVM) (Figure 2). A HVM is a tree diagram that represents ACVs and their connections (Fotopoulos et al. 2003). Typically, attributes are placed at the bottom of the structure, with notation of the frequency of each attribute. This frequency is often shown by increasing and decreasing the relative size of an attribute on the map. The
opposed to a consumers who are more conservative in their purchasing behavior for orange juice.
In the realm of food product development and innovation, MEC can reveal
information regarding the key benefits a consumer expects from a food, the features (both concrete and abstract) that consumers can use to understand the key benefits of the product, and the values and goals that consumers seek to attain through a product (Gutman, 1982; ter Hofstede et al. 1998; Costa et al. 2004). It can also be used to measure particular attributes that don’t translate well to the quantitative realm. MEC has been used to study how
consumers perceive wines produced from organic grapes (Fotopoulos et al. 2003), fair trade coffee (de Ferran and Grunert, 2007), yogurts and genetically modified foods (Boecker et al.
2008), and apple juices processed using different pasteurization methods (Olsen et al. 2011). MEC would appear to be an ideal technique in the early stages of product
development but it does have limitations and drawbacks. Most notably are the high time and labor requirements, which prevent the use of larger sample sizes. In addition, due to the subjective nature of MEC methods and analysis, the predictive quality of the data may be very limited (Costa, et al. 2004). MEC also has limited use at the product development stage because consumers have not had adequate time to build appropriate perceptions of new products and how the product fits into their lives and meets their needs/values. Despite these drawbacks, MEC can serve as an invaluable tool in identifying potential values that could lead to new avenues of development for existing products.
FOCUS GROUPS
Focus groups are a popular data collection technique that relies on group interaction to elicit personal and emotional responses towards a product or concept. In contrast to an individual interview, panelists participate in a group discussion while a moderator guides the discussion around pertinent research goals. Group discussion results both a comfort and a synergy that encourages participants to express, explore and clarify their perception of the subject, which often leads to insights that may not be reported or considered in other settings (Kitzinger, 1995). Focus groups also allow for the use of authentic, personal descriptions of products in a consumer’s own words, as opposed to other methods where respondents are forced to respond using an established language. Pascall et al. (2009) reported that participants in a focus group are “caught up in the spirit of a group discussion” and can provide more information than a typical interview or survey by lowering participant inhibitions that may be natural in a one-on-one setting. This is due, in part, to the shared experience with others who can provide mutual support, affirmation and encourage a deeper level of participation (Kitzinger, 1995).
determined that smaller groups were appropriate for controversial topics, or topics that will generate a high level of discussion, while large groups are appropriate for neutral topics that will not generate as much discussion (Morgan, 1996). It is also recommended to hold smaller focus groups when working with children, or young adults. Jervis et al. (submitted) found a smaller group of 6-8 participants to be ideal when working with children ages 8-12 y, and Thompson et al. (2007) used groups of 2-5 participants with children ages 10-14 y. It is important that sessions are comfortable and conducive to open and honest discussion. To that end, seating participants in a circle helps to establish such a setting, and eliminates positions that may allow participants to avoid participation, or to take a dominant position in the group and overwhelm the conversation. Focus groups are also generally conducted in duplicate or triplicate with a similar group of respondents. A consistent set of results is ideal. Often, focus groups are repeated until results become redundant, ensuring the breadth of responses have been represented.
The dynamics of a focus group can encourage or hinder panelist participation. Thus, an experienced and professional moderator is important in a focus group in order to ensure equal participation and to make sure that the group discussion stays relevant to the intended purpose, while allowing a degree of freedom (Kitzinger, 1995; Edmunds, 1999). A
Although focus groups were initially developed for use in marketing studies, they have been used extensively in food science. Pascall et al. (2009) conducted focus group research on tamper evident packaging devices. During the focus group, participants were asked about their knowledge of current tamper evident devices, their perceptions of these devices, personal experiences, willingness to pay more for tamper evident seals, and feedback about a prototype device that changes colors as evidence of the seal breaking or being tampered with. As a result of these focus groups, the researchers were able to
determine that consumers are not as vigilant in checking tamper evident seals as they report to be, and that the prototype was seen as unnecessary, and in need of further explanation or clarification to be useful. Ramcharitar et al. (2005) used focus groups to determine consumer acceptability of muffins that contained varying levels of ground flaxseed. The researchers chose to use focus groups in order to get a view of consumer acceptance early in the development cycle and to allow for free expression of new and possibly novel ideas that could be used for further development.
Focus groups have been recently used to study consumer acceptability and behavior in regards to fish burgers (Di Monaco et al. 2009) in conjunction with a quantitative
consumer acceptance test of fish burgers. Lee and Lee (2007) used focus groups in
friendly before continuing on to chemical analysis. Childs et al. (2008) used focus groups to compile the opinions of consumers pertaining to meal replacement products with whey and/or soy proteins. The results of the focus groups were used to identify attributes and levels applied in a conjoint ballot. Focus groups were utilized in a similar experimental design by Childs and Drake (2009) to determine the perception of fat reduction in cheese. Childs and Drake (2010) later used focus groups to study how consumers perceived astringency in clear acidic whey protein beverages. More recently, Jervis et al. (submitted) used focus groups with children to determine how children perceived breads with varying attributes. Focus groups have also been applied to augment quantitative consumer studies with butter (Krause
et al. 2007), chocolate milk (Thompson et al. 2007), beef from various processing technologies (De Barcellos et al. 2010), the use of whey protein and soy protein in meal replacement bars and drinks (Childs et al., 2008), and ginseng food products (Chung et al.
2011).
were edited for clarity and responses were compared between sessions in order to identify any trends in consumer perceptions.
Focus groups produce more data than individual interviews, in a shorter time and at a lower cost. The ability to collect a wide variety of data from a group in a short amount of time at a low cost allows for faster innovation and development to take place. Aldag & Tinsley (1994) sought to determine whether focus groups or individual interviews were more efficient. Participants either took part in a focus group or an individual interview that sought to determine what factors influence general food choices. Of the 53 individuals recruited, 28 participated in a series of interviews, while 25 participated in a series of focus groups. Focus groups generated 79 total factors influencing food choices, while interviews generated in 73 factors. After examining time requirements of each data collection method, it was
SORTING/GROUPING
Sorting is a popular data collection technique in the field of psychology that has recently become more popular in the field of sensory studies (Abdi et al. 2007). Lawless (1989) was among the first to apply this technique to sensory science while investigating odor quality. Soon after, this technique was applied to vanilla beans (Heymann, 1994), drinking water (Falahee & MacRae, 1997), cheese (Lawless et al. 1995), and beer (Chollet and Valentin, 2001). The premise behind sorting is simple. Participants are presented with a group of products – usually 10 to 15 – and are then asked to place the products into groups based on perceived similarity (Nestrud & Lawless2010). Participants are allowed to create as many groups as they wish, and put as many products into a group as they wish, but each item can belong to only one group. Sorting tasks have produced reliable results with as little as 16 consumers (Lawless et al. 1995) but at least 20 is recommended in order to represent a wide spectrum of consumers (Santosa et al. 2010). Following the initial sorting activity, a follow-up step may be conducted in which the participant describing the groups, rates all of the products on a quantitative scale, or continues to divide each group into sub-groups. Each of these variants will be discussed in detail. After proper statistical analysis, a representative product space can be created that shows product relationships and can be used to interpret consumer responses and reveal underlying dimensions of the product (Chollet et al. 2011).
(MCA) and variations of MDS and MCA have been used (Abdi et al. 2007; Cadoret et al.
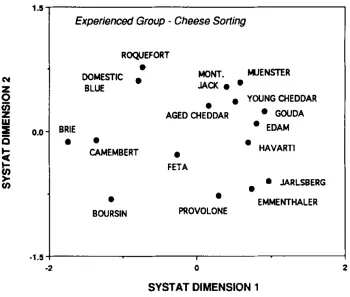
2009; Santosa et al. 2010). MDS produces a map that represents perceived similarities and differences between products as distances between points representing each product. Products that are closer together have been sorted together more often, while products that are furthest away were rarely sorted together. Figure 4 shows an example MDS map demonstrating consumer perception of cheeses (Lawless et al, 1995). This particular group was experienced with a variety of cheeses and had a deeper knowledge of cheese than the average consumer, hence the “experienced group” designation. Proximity to other cheeses represents perceived similarity/dissimilarity between them. This map may provide insight into the dimensions that consumers use to gauge similar products (Abdi, et al. 2007). Lawless (1995) reported that the only major problem with using MDS for analysis is that individual participant information is lost since their data is pooled with other participants in the creation of the similarity matrix. The loss of such data prevents the evaluation of agreement among assessors and the analysis of individual participants over multiple repetitions of the same procedure (Abdi et al. 2007). Again, various methods have been proposed that strive to eliminate this problem.
and MacRae (1997) examined variation in 13 different samples of drinking waters with a panel of 20 untrained assessors over 5 replications. The waters included bottled, distilled and tap waters along with blends of the various waters. The assessors would sort the drinking waters into groups based on similarity, and also rank the samples in order of preference. The untrained panelists performed consistently across the 5 replications, and MDS data collected from the sorting procedure differentiated the various types of water including tap, distilled and bottled waters. Tang and Heymann (2002) used sorting in a study of 10 grape jellies. Data from the sort separated the jellies into 4 distinct groups, including segregation of the jellies based on sweetening system (artificial vs. sugar vs. high fructose corn syrup), grape flavor, and texture. Saint-Eve et al. (2004) examined the interactions of flavor on texture perception of yogurts using sorting. Assessors were able to identify major differences among the products, and separate the yogurts into distinct groups based on their textural and
aromatic attributes. Using MDS on this data to produce a perceptual map showed that yogurts that were flavored with a single aroma compound were characterized as thick, while those with a mixture of aroma compounds were perceived as fluid.
Sorting has been proposed as an alternative to descriptive analysis (DA) when the time and money commitments for a trained sensory panel are prohibitive. Sorting does not require any quantitative rating, requires a minimal level of instruction, requires no training, produces little fatigue and boredom and can be conducted with a large number of samples in a relatively short timeframe (Cartier et al. 2006, Bijmolt and Wedel, 1995; Chollet et al.
Cartier et al. (2006) examined perceptions of breakfast cereals through the use of sorting as an alternative to DA in mapping sensory data. Participants were asked to group cereals based on texture and flavor. They were then asked to describe each group. Data revealed that DA and sorting produced similar results with slight variations between the two methods. Data from sorting identified one group of cereals as being
a secondary fermentation) formed a group, and the higher alcohol level beers were grouped together with hoppy beers. By comparison, the DA data the hoppy beers were grouped together and the Gueuze beers were grouped together with the beers with a high degree of alcohol. The authors determined that despite similarities, the data from traditional DA was more precise and easier to interpret while the sorting task was better able to provide global information about the basic characteristics of the beers due to the freedom of panelists to describe the groups however they chose. The groupings that are derived also have the potential for product innovation. How products are grouped together makes explicit the attributes that consumers use to categorize and classify a product. By seeking out under-represented groups, potentials for new and innovative products may be revealed.
nonmetric MDS. TFS provided better insights into the relationships between products than traditional sorting techniques, although TFS required more involved data collection and interpretation.
Hierarchical sorting is another form of sorting that seeks to improve traditional sorting methods. Participants perform an initial sorting of products, and then continue to divide the groups until the products in a group are considered homogenous, creating a hierarchical tree (Cadoret et al. 2011). This method was applied to examine consumer perceptions of 25 commercial extra virgin olive oils (Santosa et al. 2010). Data was
analyzed using the DISTATIS method, a specialized method based on MDS which takes into account the individual responses of each participant, rather than analyzing pooled results. DISTATIS produces two distinct perceptual maps. First, a consensus map is produced that represents the products based on each participant’s responses. Rather than dots representing products, the consensus map displays confidence ellipses around products, taking into account the individual responses. A second map is also produced that represents the
individual assessors, which can be used to analyze consensus, or lack thereof within a group (Abdi et al. 2007; Chollet et al. 2011).
The data produced in sorting is not as accurate or as robust as data produced from DA but be used as an alternative to DA when time, money and personnel are limited. The data is acceptable as a rapid sensory mapping technique, which can be applied to screening
differences that may arise out of different language, dialect, education levels or socio-economic status since the actual language used is not as important as the actual groups that are produced.
PROJECTIVE MAPPING & NAPPING
Projective mapping (PM), is a qualitative data collection technique which is used to create a “projection” of a product as a way to better understand a product in relationship to another product, or to better understand consumers and their reactions to products (Risvik et al. 1994). PM was first used in food science by Risvik et al. (1994) as an attempt to connect consumer research data with sensory data. It can be used to reveal overall product
differences, or can be used in conjunction with other descriptive techniques (sorting, flash profiling, DA etc.) to help determine which attributes are most important in differentiating products (Kennedy, et al. 2009). PM differs from grouping methods in that PM respondents don’t form strict groups. Rather, similarities and differences are represented by the distance between each product. Whereas in grouping, a product is either grouped with another product, or not grouped, in PM every objects distance is measured and analyzed. Thus even in clusters of products, slight differences can be represented.
dissimilarity. Participants are allowed to base the similarity on whatever attributes they choose. Like sorting methods, similarities and differences are examined, but PM adds a layer of data over typical sorting methods in that distance between every product is measured, allowing small differences between products to be detected, and allowing direct comparisons between each product. As products are placed on the provided space, a map of the products is created. The coordinates of each product is recorded and subject to data analysis. PM is a holistic approach to data collection in which product assessors consider a product as a whole, rather than assessing the sensorial attributes individually (Pagès et al. 2010). Typically, similar products are compared, such as various wines, or salty snack foods (Nestrud & Lawless, 2010).
PM has many advantages over other data collection techniques. It can show better differentiation between products than sorting (King et al. 1998), and is faster and less complex to the consumer than similarity testing and scaling (Risvik et al. 1997). PM does not require more than minimal training, when compared to a trained DA panel, but provides similar data in less time, while remaining just as consistent over replications. (Risvik et al.
1994). Need to address value in innovation vs sensory research.
specified to have rectangular orientation with a larger x-axis. Napping also specifies the use of multiple factor analysis (MFA), where traditional PM has more flexibility in data analysis. MFA is similar to PCA in that is produces a map that represents perceived similarities as distances between samples, but has the added benefit of taking into account individual respondent differences, rather than using only a group average. Napping was first proposed by Pagès (2003) in a study of 10 white wines. Two groups of trained wine professionals were asked to evaluate a series of wines. The first panel organized their samples on a map similarly to PM. The second panel evaluated the same wines using classical DA techniques. Since then, data collected from projective mapping and its variants has typically been
analyzed using MFA (Nestrud & Lawless,2010; Pagès and Husson,2001).
King et al. (1998) used PM to analyze 18 snack bars with consumers in conjunction with sorting. One group of consumers evaluated the bars using PM, while a separate group of consumers evaluated the same bars through sorting. PM and sorting were both analyzed using MDS. Both methods were able to differentiate the bars based on their use as a meal replacement bar or a snack bar. PM was able to also differentiate based on chocolate content, which implies that PM may be able to reveal information that sorting may not. Barcenas et al. (2004) used PM in a study of 8 cheeses produced from ewes’ milk. Assessors identified three distinct groupings of cheeses across three replications, each of which represented a different length of ripening. Both trained and untrained panelists assessed and organized the cheeses following standard PM procedures. The trained assessors performed better than untrained consumers, but both groups produced similar configurations.
the mapping task, assessors were asked to rate each juice for sweetness, sourness, bitterness and other relevant attributes. Analysis of the PM and scaling data for the consumer group revealed a high level of agreement between the methods, but a lower level of agreement in the culinary professionals group, which may be attributed to their developed sensoria acuity.
Pagès et al. (2010) recently proposed an approach referred to as sorted napping that combines napping and sorting. Sorted napping involves a panelist creating their nappe, and then circling products to make groups based on whatever criteria they choose. The panelists then wrote names or descriptors for each group and each product. In this study, panelists evaluated eight samples of fruit smoothies in duplicate made from various fruit
combinations. The map of the various smoothies was able to differentiate between general fruit composition of the smoothies. The grouping and word association information was able to identify specific sensory attributes such as thick and sweet, and associate these terms with the smoothies and smoothie groups.
Many other variations on PM have been utilized recently. In 2008, Perrin et al.
studied wines and combined napping with ultra-flash profiling (UFP). Immediately
available or when accurate descriptions are not necessary (Perrin et al. 2008). Partial napping (PN) was first suggested by Pagès (2003) and recently examined by Delholm et al.
(2012) in a study different types of liver pâté. PN involves identifying relevant sensory modalities for a product (appearance, flavor, aroma…) and napping specific sensory modalities separately. PN data was highly correlated with data collected from traditional DA, and faster since it required little training, and shorter sessions. Louw et al. (2013) examined brandies with two panel groups of 10-12 consumers using both PM and PN. PN provided better results while remaining reliable, reproducible and repeatable for smaller sample sets which are preferable in high alcohol content beverages due to high fatigue levels. Drake et al. (2009) used a combination of home usage test, group discussion, and PM with 12 cottage cheese consumers, a technique called QMA (qualitative multivariate analysis) to identify drivers of liking for cottage cheeses. These results were comparable to those obtained from a traditional preference mapping study with DA and a 100 consumer CLT.
It is recommended that PM be limited to 10-20 samples as fatigue and adaptation can distort results (Schifferstein, 1996; Tang and Heymann, 2002). It should also be noted that by itself, PM does not actually characterize a product, which would need to be done through or in conjunction with DA and/or instrumental data (Pagès 2003; 2005).
CONCLUSIONS
quantitative methods cannot through open ended techniques such as focus groups and means-end chain analysis. Although not a substitute for quantitative methods, qualitative methods can be used to enhance quantitative studies and with time or financial limitations, can be used as a substitute. Methods such as focus groups, ethnography and means-end chain can be used to better understand consumer desires and can provide data that can be used to refine an existing product, or produce a new product to meet those consumer needs. Other methods like grouping, sorting and projective mapping can be analyzed by using multidimensional scaling to produce perceptive maps. These powerful tools show perceived similarities and differences between products and the appropriate magnitude. These methods can serve as a faster and less expensive substitution for classical profiling, a preliminary approach to clarify or augment quantitative consumer tests, or can be used in the beginning stages of product development, to guide developers. Traditional qualitative research methods such as the focus group have proven their worth in scientific research. Novel approaches such as projective mapping have great potential in understanding consumer perceptions, and simplifying future research methods.
ACKNOWLEDGEMENTS
Funding provided in part by the Dairy Research Institute (DRI) (Rosemont, IL). The use of tradenames does not imply endorsement or lack of endorsement by those not
REFERENCES
ADBI, H., VALENTIN, D., CHOLLET, S., CHREA, C., 2007. Analyzing assessors and products in sorting tasks: DISTASIS, theory and applications. Food Qual. Pref. 18,
627-640.
AGAR, M., 1996. The Professional Stranger. P. 1-12, Academic Press, London, U.K. ALBERT, A., VAREAL, P., SALVADOR, A., HOUGH, G., FISZMAN, S., 2011.
Overcoming the issues in the sensory description of hot served food with a complex texture. Application of QDA, flash profiling and projective mapping using trained panels with different degrees of training. Food Qual. Pref. 22, 463-473
ALDAG, L., TINSLYE, A., 1994. A comparison of focus group interviews to in-depth interviews in determining food choice influences. J. Agric. Food Info. 2(3), 89-96. BARBOUR, R.S., KITZINGER, J., 1999. Developing focus group research. Chap. 1, p 8-9,
Sage Publications, Thousand Oaks, CA.
BARCENAS, P., PÉREZ, F.J., ALBISU, M., 2004. Projective mapping in sensory analysis of ewes milk cheeses: A study on consumers and trained panel performance. Food Res. Int. 37, 723-729.
BIJMOLT, T., WEDEL, M., 1995. The effects of alternative methods of collecting similarity data for multidimensional scaling. Int. J. Res. Mark. 12, 363-371.
CADORET, M., LÊ, S., PAGÈS, J., 2009. A factorial approach for sorting task data (FAST). Food Qual. Pref. 20, 410-417.
CADORET, M., LÊ, S., PAGÈS, J., 2011. Statistical analysis of hierarchical sorting data. J. Sens. Stud. 26, 96-105.
CARTIER, R., RYTZ, A., LECOMTE, AL, POBLETE, E., KRYSTLIK, J., BELIN, E., MARTIN, N., 2006. Sorting procedure as an alternative to quantitative descriptive analysis to obtain a product sensory map. Food Qual. Pref. 17, 562-571.
CHILDS, J.L., DRAKE, M.A., 2009. Consumer perception of fat reduction in cheese. J. Sens. Stud. 24, 902-921.
CHILDS, J.L., DRAKE, M.A., 2010. Consumer perception of astringency in clear acidic whey protein beverages. J. Food Sci. 75(9), s513-s521.
CHILDS, J.L., THOMPSON, J.L., LILLARD, J.S., BERRY, T.K., DRAKE, M.A., 2008. Consumer perception of whey and soy protein in meal replacement products. J. Sens. Stud. 23, 320-339.
CHOLLET, S., VALENTIN, D., 2001. Impact of training on beer flavor perception and description: Are trained and untrained subjects really different. J. Sens. Stud. 16,
601-618.
CHUNG, H.S., HONG, H.D., KIM, K., CHO, C.W., MOSKOWITZ, H.R., LEE, S.Y., 2011. Consumer attitudes and expectations of ginseng food products assessed by focus groups and conjoint analysis. J. Sens. Stud. 26(5), 346-357.
COSTA, A.I.A., DEKKER, M., JONGEN, W.M.F., 2004. An overview of means-end theory: potential application in consumer-oriented food product design. Trends Food Sci. Tech. 15, 403-415.
COURCOUX, P., QANNARI, E.M., TAYLOR, Y., BUCK, D., GREENHOFF, K., 2012. Taxonomic free sorting. Food Qual. Pref. 23, 30-35.
DE BARCELLOS, M.D., KÜGLER, J.O., GRUNERT, K.G., WEZEMAEL, L.V.PÉREZ-CUETO, F.J.A., UELAND, Ø, VERBEKE, W., 2010. Eurpoean consumers’ acceptance of beef processing technologies: A focus group study. Innov. Food. Sci. Emerg. 11(4), 721-731.
DE FERRAN, F., GRUNERT, K.G., 2007. French fair trade coffee buyers’ purchasing motives: An exploratory study using means-end chains analysis. Food Qual. Pref.
18, 218-229.
DELHOLM, C., BROCKHOFF, P.B., MEINERT, L., AASLYNG, M.D., BREDIE, W.L.P., 2012. Rapid descriptive sensory methods – Comparison of free multiple sorting, partial napping, napping, flash profiling and conventional profiling. Food Qual. Pref.
26, 267-277.
DI MONACO, R., CAVELLA, S., MASI, P., SEVI, A., CAROPRESE, M., MARZANO, A., CONTE, A., DEL NOBILE, M.A., 2009. Blue fish burgers: nutritional
DRAKE, S.L., LOPETCHARAT, K., DRAKE, M.A., 2009. Comparison of two methods to explore consumer reference for cottage cheese. J. Dairy Sci. 92, 5883-5897.
EDMUNDS, H., 1999. The focus group research handbook. Chap. 4, p. 69-86, NTC Business Books, Lincolnwood, Il.
ELLIOTT, R., JANKEL-ELLIOTT, N., 2003. Using ethnography in strategic consumer research. Qual. Market Research: An Int. J. 6, 215-223.
FALAHEE, M., MACRAE, A.W., 1997. Perceptual variation among drinking waters: The reliability of sorting and ranking data for multidimensional scaling. Food Qual. Pref.
8, 389-394.
FERN, E.F., 2001. Advanced focus group research. Chap. 4, p. 73-95, Sage Publications, Thousand Oaks, CA.
FOTOPOULOS, C., KRYSTALLIS, A., NESS, M., 2003. Wine produced by organic grapes in Greece: using means-end chains analysis to reveal organic buyers’ purchasing motives in comparison to the non-buyers. Food Qual. Pref. 14, 549-566. GRAHAM, J.E., MAYAN, M., MCCARGER, L.J., BELL, R.C., 2013. Making
compromises: A qualitative study of sugar consumption behaviors during pregnancy. J. Nutr. Educ. Behav. 45, 578-585.
GRUNERT, K.G., GRUNTERT, S.C., 1995. Measuring subjective meaning structures by the laddering method: theoretical considerations and methodological problems. Int. J. Res. Mark. 2, 366-371.
HARRIS, J.E., GLEASON, P. M., SHEEHAN, P.M., BOUSHEY, C., BETO, J.A., BRUEMMER, B., 2009. An introduction to qualitative research for food and nutrition professionals. J. Am. Diet. Assoc. 109, 80-90.
HEYMANN, H., 1994. A comparison of free choice profiling and multidimensional scaling of vanilla samples. J. Sens. Stud. 9, 445-453.
JERVIS, M.G., JERVIS, S.M., GUTHRIE, B., DRAKE, M.A. Determining children’s perceptions, opinions and attitudes for sliced sandwich breads. J. Sens. Stud. Submitted.
JERVIS, S.M., LOPETCHARAT, K., DRAKE, M.A. 2012. Application of ethnography and conjoint analysis to determine key consumer attributes for latte-style coffee
beverages. J. Sens. Stud. 27, 48-58.
KENNEDY, J., HEYMANN, H., 2009. Projective mapping and descriptive analysis of milk and dark chocolates. J. Sens. Stud. 24, 220-233.
KITSAWAD, K., GUINARD, J.X., 2014. Combining means-end chain analysis and the Portrait Value Questionnaire to research the influence of personal values on food choice. Food Qual. Pref. 35, 45-48.
KITZINGER, J., 1995. Qualitative research. Introducing focus groups. Br. Med. J. 311,
299-302
KRAUSE, A.J., LOPETCHARAT, K., DRAKE, M.A., 2007. Identification of the
characteristics that drive consumer liking of butter. J. Dairy Sci. 90, 2091-2102.
KRUEGER, R.A., CASEY, M.A., 2000. Focus groups: A practical guide for applied research (3rd Ed). Sage Publications, Thousand Oaks, CA.
LAWLESS, H.T., 1989. Exploration of fragrances categories and ambiguous odors using multidimensional scaling and cluster analysis. Chem. Senses. 14, 217-230.
LAWLESS, H.T., SHENG, T., KNOOPS, S., 1995. Multidimensional scaling of sorting data applied to cheese perceptions. Food Qual. Pref. 6, 91-98.
LEE, C.M., LEE, S.Y., 2007. Consumer insights on healthy breakfast cereal – a focus group research. J. Sens. Stud. 22, 417-432.
LIND, L.W., 2007. Consumer involvement and perceived differentiation of different kinds of pork – a Means-End Chain analysis. Food Qual. Pref. 18, 690-700.
LINDLOF, T.R., TAYLOR, B.C., 2002. Qualitative communication research methods, 2nd ed. P. 16, Sage Publications, Thousand Oaks, CA.
LUTCHMEDIAL, M., RAMLAL, R., BADRIE, N., CHANG-YEN, I., 2004. Nutritional and sensory quality of stirred soursop (Ammona muricata L.) yoghurt. Int. J. Food Sci. Nutr. 55(5), 407-414.
LOUW, L., MALHERBE, S., MAES, T., LAMBRECHTS, M., VAN RENSBURG, P., 2013. Validation of two Napping ® techniques as rapid sensory screening tools for high alcohol products. Food Qual. Pref. 20, 192-201.
MORGAN, D.L., 1992. Designing focus group research. Chap 1. p. 177-193, Sage Publications, Thousand Oaks, CA.
MORGAN, D.L., 1996. Focus Groups. Annu Rev Sociol. 22, 129-152.
NESTRUD, M.A., LAWLESS, H.T., 2008. Perceptual mapping of citrus juices using projective mapping and profiling data from culinary professionals and consumers. Food Qual. Pref., 19, 431-438.
NESTRUD, M.A., LAWLESS, H.T., 2010. Perceptual mapping of apples and cheeses using projective mapping and sorting. J. Sens. Stud. 25, 390-405.
OLSON, J.C., REYNOLDS, T.J., 2001. Understanding consumer decision making: the means-ends approach to marketing and advertising strategy. Chap 1. p. 3-20, L. Erlbarum Associates, Mahwah, NJ.
OLSEN, N.V., MENICHELLI, E., GRUNERT, K.G., SONNE, A.M., SZABÓ, BÁNÁTI, D., NÆS, T., 2011. Choice probability for apple juice based on novel processing techniques: Investigating the choice relevance of means-end-chains. Food Qual. Pref.
22, 48-59.
PAGÈS, J., HUSSON, F., 2001. Inter-laboratory comparison of sensory profiles: Methodology and results. Food Qual. Pref. 12, 297-308.
PAGÈS, J.,2003. Collection and analysis of perceived product inter-distances using multiple factor analysis: Application to the study of 10 white wines from the Loire Valley. Food Qual. Pref. 16, 642-649.
PASCALL, M. A., LEE, K., FRASER, A., HALIM, L., 2009. Using focus groups to study consumer understanding and experiences with tamper-evident packaging devices. J. Food Sci. Ed. 8, 53-59.
PERRIN, L., SYMONEAUX, R., MAÎTRE, I., ASSELIN, C., JOURJON, F., PAGÈS, J., 2008. Comparison of three sensory methods for use with the Napping ® procedure: Case of ten wines from Loire valley. Food Qual. Pref. 18, 1-11.
RAMCHARITAR, A., BADRIE, N., MATTFELDT-BEMAN, M., MATSUO, H., RIDLEY, C., 2005. Consumer acceptability of muffins with flaxseed (linum usitatissimum). J. Food Sci. 70(7), 504-507.
RISVIK, E., MCEWAN, J.A., COLWILL, J.S., ROGERS, R., LYON, D.H., 1994.
Projective mapping: A tool for sensory analysis and consumer research. Food Qual. Prefer. 5(4), 273-269.
RISVIK, E., MCEWAN, J.A., RODBOTTEN, M., 1997. Evaluation of sensory profiling and projective mapping data. Food Qual. Prefer. 8(1), 63-71.
RUSSEL, C.G., BUSSON, A., FLIGHT, I., BRYAN, J., VAN PABST, J.A., COX, D.N., 2004. A comparison of three laddering techniques applied to an example of complex food choice. Food Qual. Pref. 15, 569-583.
SAINT-EVE, A., KORA, E.P., MARTIN, N., 2004. Impact of olfactory quality and
chemical complexity of the flavouring agent on the texture of low fat stirred yogurts assessed by three different sensory methodologies. Food Qual. Pref. 15, 655-668. SANTOSA, M., ABDI, H., GUINARD, J.X., 2010. A modified sorting task to investigate
SANTOSA, M., GUINARD, J.X., 2011. Means-end chains analysis of extra virgin olive oil purchase and consumption behavior. Food Qual. Pref. 22, 204-316.
SCHIFFERSTEIN, H.N.J., 1996. Cognitive factors affecting taste intensity judgments. Food Qual. Pref. 7, 167-175.
SINGER, J.B., 2009. Ethnography. Journalism Mass Comm. 86(1), 191-198.
SONNE, A.M., GRUNERT, K.G., OLSEN, N.V., GRANLI, B.S., SZABÓ, E.S, BANATI, D., 2012. Consumers’ perceptions of HPP and PEF food products. Brit. Food J.
114(1), 85-107.
STEWART, B., OLSON, D., GOODY, C., TINSLEY, A., AMOS, R., BETTS, N.,
GEORGIOU, C, HOER, S., IVATURI, R., VOICHICK, J., 1994. Converting focus group data on food choices into a quantitative instrument. J. Nutr. Educ. 26, 34-36. TANG, C., HEYMANN, H., 2002. Multidimensional sorting, similarity scaling, and
free-choice profiling of grape jellies. J. Sens. Stud. 17, 493-509.
TER HOFSTEDE, F., AUDENAERT, A., STEENKAMP, J.B.E.M, WEDEL, M., 1998. An investigation into the association pattern technique as a quantitative approach to measuring means-end chains. Int. J. Res. Mark. 15, 37-50.
THOMPSON, J.L., GERARD, P.D., DRAKE, M.A., 2007. Chocolate milk and the Hispanic consumer. J. Food Sci. 72(9), s666-s675
Figure 2: Simplified Hierarchical Value Map of consumer choice of high pressure
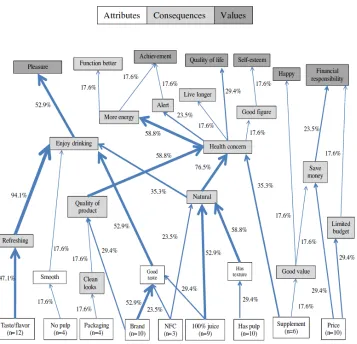
Figure 3: Hierarchical Value Map of consumer choice of high pressure processed
Figure 4: Two-dimensional MDS from cheese name sorting among consumers
Figure 5: Two-dimensional MDS from cheese name sorting among consumers not
DETERMINING CHILDREN’S PERCEPTIONS, OPINIONS, AND ATTITUDES FOR SLICED SANDWICH BREADS
JERVIS, M.G.1, JERVIS, S.M.1, GUTHRIE, B.2, and DRAKE, M.A.1,3
1Department of Food, Bioprocessing and Nutrition Sciences
North Carolina State University
Raleigh, NC 27695
2Cargill Global Food Research
Wayzata, MN 55391
3Corresponding author. TEL: (919) 513-4598; FAX: (919) 515-7124; EMAIL:
ABSTRACT
The objective of this study was to determine the ideal whole grain bread product for children (8-17y). Focus groups (3 focus groups, n=23), emotional response and appearance liking surveys (n=172), and an adaptive choice based conjoint survey (n=173) were
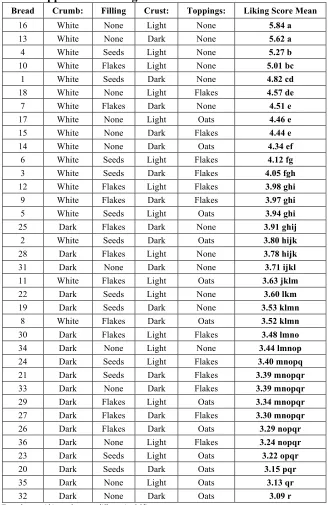
conducted with children. Across elementary, middle and high school aged children, children preferred bread with a light crumb (inside of the bread), a light crust, and no topping or added textures or visual cues in the crumb. Children had generally negative feelings for breads with dark colored crumb and crust, but had generally positive feelings for breads with light colored crumb and crust. Breads with white crumb were liked more than bread with dark crumb, regardless of crumb particles, crust or crust topping. Crust color had no impact on overall appearance liking score. These results demonstrate that regardless of age, children like soft breads with light colored crumb and crust with no fillings or toppings.
PRACTICAL APPLICATIONS
Increased consumption of whole grain breads is an effective technique in decreasing obesity in American children. Aside from reduction of obesity, health benefits of increased whole grain intake include reductions in cardiovascular disease, type II diabetes and certain cancers. Although these health concerns are not usually concerns with children, eating habits developed in childhood can carry over to adulthood. Children’s likings of bread products have an inverse relationship with whole grain vs. refined grain content. This study
both visual appearance and taste is an important step towards increased whole grain consumption by children and a decrease in obesity rates in children.
KEY WORDS
INTRODUCTION
In data collected from the years 2005-2008, 16.2% of US children ages 2-19 y were classified as obese based on their weight and the weight of their peers (USDHHS, 2013). The obesity rate in children increased nearly 22% from 2000-2010 (USDHHS, 2013). Both government and commercial initiatives have been implemented in an effort to reduce the obesity of rates of children and adults, and improve general health (Kraak et al. 2009; Adachi-Meija et al. 2011). The Healthy People 2020 initiative organized by the US government includes a targeted 10% reduction in obesity rates to 14.6% as the goal for the year 2020 (USDHHS, 2013).
children (Leon et al, 1999; Marshall et al. 2006). With these facts in mind, an important step towards increased whole grain consumption by children would be to produce a whole grain bread product that retains some of the visual characteristics of white, refined flour breads in order to remain visually appealing.
Conjoint analysis is a reliable method of measuring children’s food preferences and the importance of the varying attributes of a food product. In order to conduct conjoint analysis on products that may not be commercially available, the use of pictures or models in place of actual product is required. Recently, Olsen et al. (2012) demonstrated that using conjoint analysis with pictures of buns and juice yielded results consistent with visual
hedonic preference measures and product choices in children. Guthrie et al. (2000) conducted a study with 3-5 year olds and reported that tasting a food resulted in the most reliable results (r=0.81), followed closely by judging based on pictures on a computer screen (r=0.75). Jarmillo et al. (2006), Calfas et al. (1991), and Vereecken et al. (2010) all demonstrated that testing food preferences of children using images in place of actual product was a reliable method as long as children were familiar with the foods.
The relationship between foods and the emotions that they elicit is a recently researched concept. It is particularly important as a way to distinguish between foods with similar liking scores. Recent work has shown that emotions analysis can be conducted with the actual food product or with images of a food (Cardello et al. 2012). Richins (1997) showed that an emotions questionnaire was reliable when surveying across a large number of products. The reliability of emotional responses to food was verified by Cardello et al.
responses to products other than food (Chrea et al. 2009, Richins, 1997). Emotional
responses of children to images of food have yet to be researched in depth. The importance of children as consumers and decision makers in food purchase and consumption warrants further research into the emotional responses of children when presented with a visual stimulus of a food product.
The goal of this study was to use determine the perceptions and attitudes of children towards a range of different bread composite pictures that represented possible whole grain bread products that could be mass produced. Focus groups were conducted initially in order to develop an appropriate lexicon of emotions and responses of children towards various foods. An emotions and liking survey was used to assess children’s emotional responses towards various sandwich breads. Finally, adaptive choice based conjoint (ACBC) was applied to determine what drives liking of bread in children and to create an ideal whole wheat bread with visual appeal. Pairing the results of a conjoint study of sliced sandwich breads, which can identify the attributes of a sandwich bread that children find important, and the emotional responses of children towards various bread products can help manufacturers produce a whole grain bread product that children will feel comfortable with and enjoy eating.
METHODS
emotional response survey in which they were shown 36 composite bread images. Emotional responses and overall liking of each bread picture were evaluated. After completion of the ACBC survey, an age and language appropriate adaptive choice based conjoint (ACBC) survey was developed and conducted to determine the utilities of various composite whole and refined grain breads and their individual attributes.
Participants
Focus Groups
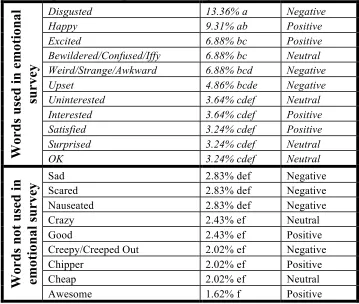
as positive, neutral or negative. The highest frequency words were chosen to use in the conjoint and emotions surveys.
Picture Generation
Pictures representing selected, bread attributes and their respective levels were created using methods developed by Jervis et al. (submitted). Composite bread pictures were created using the same procedures. These levels and composite breads are shown in Figures 1 and 2 and fully detailed in Table 1.
Emotion and Liking Surveys
12 emotions words were presented in alphabetical order (King et al. 2010). If the respondent chose, other, they were able to enter their emotional response. The emotional responses presented in the CATA section were chosen from focus group responses and were
appropriate to the entire age range of respondents. These responses also reflected positive, neutral and negative responses. Desmot and Shiffereson (2008) determined that food experiences were mainly associated with positive emotions. As such, the EsSense Profile includes primarily positive emotional responses, and only three negative. Due to our smaller number of emotional responses used, we felt it important to reflect different levels and aspects of negative responses. Children were then asked to evaluate their overall liking of the appearance of the composite bread product picture using a modified version of the Peryam-Kroll hedonic scale for children (Peryam-Kroll, 1990), where 1=super bad and 7=super good. Children took approximately 10-15 minutes to complete this survey. After evaluating all 36 pictures, children were presented with a screen with an affirmation message assuring them that they were doing well, and allowed to take a 5 minute break before proceeding to the conjoint survey.
Adaptive Choice Based Conjoint
made it,” “high fiber,” “soft,” “all natural,” or “no artificial ingredients or preservatives”). Levels for all attributes were derived from Jervis et al. (submitted).
The ACBC study began with a build your own (BYO) activity where children were presented with each level of each attribute and asked to build the best bread possible. Following the BYO section, children were presented with ten screening tasks in which three product concepts were presented. Each product concept was created based on the responses to the BYO activity. Two or three attributes were permitted to vary from the BYO levels chosen for each product concept. For each product concept, one level for each attribute was displayed for each attribute, and pictures used to represent the crust and middle of the bread (crumb) to create a composite bread product. Children responded to each product concept by choosing from the responses “I’d eat it” or “I would not eat it.” Throughout the survey, five questions were presented in which participants chose any unacceptable levels, and four questions were presented where children chose must have levels (Orme, 2010; Jervis et al.
2012,). Following the screening task, participants were presented with a tournament activity in which a maximum of 20 product concepts were used with a minimum of three concepts for each choice task (Orme, 2010; Jervis et al. 2012). At the conclusion of the survey,
participants were thanked and received a $60 gift card. Statistical Analysis
analysis of variance (ANOVA) with Fisher’s least significant difference (LSD) as the post hoc test (XLSTAT).
Individual utility scores from the conjoint were extracted using Hierarchical Bayesian estimation (HB). The utility scores were rescaled using a zero-centered differences method (Orme, 2010; Jervis et al. 2012). The zero-centered scores are used in order to facilitate comparisons and to standardize all of utility scores within any given attribute. The zero-centered utility scores were then analyzed across school age using two-way ANOVA using Fisher’s LSD as the post hoc test (XLSTAT). Importance scores were determined by first calculating the range of utility scores for each attribute. The range was then divided by the total utility range and multiplied by 100 (Orme, 2010). Importance scores across school age were compared using two-way ANOVA and Fisher’s LSD as the post hoc test (XLSTAT). All statistical analysis was carried out at a 95% significance level.
RESULTS & DISCUSSION Focus Groups