PREPARATION, MODIFICATION AND CHARACTERIZATION OF ACTIVATED CARBONS FOR BATCH ADSORPTION STUDIES ON THE
REMOVAL OF SELECTED METAL IONS
MOHAMMAD ADIL
A thesis submitted in fulfilment of the requirements for the award of the degree of
Master of Science (Chemistry)
Faculty of Science Universiti Teknologi Malaysia
ACKNOWLEDGEMENT
I would like to thank my supervisor Professor Dr. Alias M. Yusof for giving me the opportunity to work on his project as well as for his valuable guidance, support and untiring patience. I would also acknowledge the financial support by his research grant (VOT 74029 and 74513).
I am grateful to Associate Professor Dr. Noor Aini Bt. Abdul Rashid for her constant vigilance and valuable suggestions throughout this study. I would also express my appreciation to all other faculty members and staffs in the Chemistry Department of UTM for their enormous help with my study. I would also extend my sincere appreciation to other faculties and institutions related to my job with them.
I thank all of my friends, colleagues and laboratory personnel who extended their time, expertise, generous advice, criticism, technical assistance and encouragement during my research. I like to acknowledge everyone, but I am to be constrained to a few in mentioning names as Mr. Ayob Jabal, Mr. Hanan Basri, Mr. Azmi M. Rais, Mrs. Z. Ain Jalil, Mr. Hj. Yasin bin. M. Sirin, Miss. Nurul H. Sapiren, Mr. M. Nazri Zainal, Mr. Dinda Hairul, Mr. Hamzah, Mr. Abdul Kadir, Mrs. Mek zum, Mr. Abdur Rahim, Mrs. Mariam Hassan, Mr. Azani b. Ishak of Chemistry Department and Chia Chai Har, Tan See Hua, Lee Kian Keat and Ng Shi Hooi who indebted me most for their assistance in pursuing laboratory work.
I am thankful to the authorities of Bangladesh Chemical Industries Corporation (BCIC) and Chittagong Urea Fertilizer Limited (CUFL), for granting continual periods of study leave which made this study possible. A deep and sincere gratitude are due to Mr. Abdul Hafiz (Secretary, BCIC), Mr. M. Shahjahan (General Manager, Construction), Mr. M. Mostafa Faruque (General Manager), Mr. M. Salahuddin (General Manager, Operation), Mr. Syed M. Ilias Chowdhury (Plant In-charge, Ammonia), Mr. Abu Jamal Sarkar (Additional Chief Chemist), Mr. AJM Ataul Karim (Additional Chief Chemist), Mr. Ruhul Amin (Plant In-charge, Urea), Mr. Shishir K. Dutta, Mr. Mesbah Saklaein and to all of my colleagues and staffs there, for their support and encouragement during my study at UTM in Malaysia.
ABSTRACT
ABSTRAK
TABLE OF CONTENTS
CHAPTER TITLE PAGE
THESIS STATUS DECLARATION SUPERVISOR’S DECLARATION
TITLE PAGE i
DECLARATION ii
DEDICATION iii
ACKNOWLEDGEMENT iv
ABSTRACT v
ABSTRAK vi
TABLE OF CONTENTS vii
LIST OF TABLES xii
LIST OF FIGURES xvi
LIST OF SYMBOLS xxii
LIST OF ABBREVIATIONS xxiii
LIST OF APPENDICIES xxv
1 INTRODUCTION 1
1.1 Research Background 1
1.1.1 Water Purification 2
1.2 Heavy Metals 5
1.2.1 Pollution and Remediation Approaches 5
1.3 Activated Carbon 13
1.3.2.1 Surface Functional Groups 16
1.3.3 Preparation 20
1.3.3.1 Processing of Lignocellulosic Materials
23
1.3.3.2 Utilization of Oil Palm and Coconut Shells as Carbon Precursor
27
1.4 Adsorption of Metal Ions onto Activated Carbon 30
1.5 Adsorption Equilibrium Models 41
1.5.1 Langmuir Adsorption Model 42
1.5.2 Freundlich Adsorption Model 43
1.6 Aims and Objectives 45
1.6.1 Objectives 46
1.7 Scope and Limitations 46
2 MATERIALS AND METHODS 47
2.1 Chemicals and Reagents 47
2.2 Instruments 48
2.3 Preparation of Activated Carbon 48
2.3.1 Raw Material Preparation 49
2.3.2 Activation and Washing 50
2.4 Modification of Activated Carbon 51 2.5 Characterization of Activated and Composite
Carbon
53
2.5.1 Yield Determination 54
2.5.2 Surface Porosity Characterization (N2
Adsorption-Desorption)
54
2.5.3 Surface Morphology (SEM and EDX) 55 2.5.4 Fourier Transform Infrared Spectroscopy
(FTIR)
55
2.5.5 Boehm’s Titration 55
2.5.6 Determination of pH at Point of Zero Charge (pHZPC)
2.5.7 Thermogravimetric Analysis (TGA) 57
2.5.8 Leaching Test of Fe 57
2.6 Adsorption Studies 58
2.6.1 Test and Standard Metal Ion Solutions 58 2.6.2 Adsorption Equilibrium Studies: Metal
Cations
60
2.6.2.1 Selection of Prepared Activated Carbons for Metal Cations
60
2.6.2.2 Single Solute Adsorption 61 2.6.2.3 Binary Solute Adsorption 62 2.6.2.4 Ternary Solute Adsorption 62 2.6.2.5 Reuse of Cation-Exhausted
Activated Carbon
62
2.6.3 Adsorption Equilibrium Studies: Cr(VI) 63
2.6.4 Adsorption Equilibrium Studies: As(III) and As(V)
64
2.6.5 Adsorption Dynamics: Cu(II), Ni(II), Pb(II) and Cr(VI)
64
2.6.6 Determination and Uptake of Species of Metal/Metalloid
65
3 RESULTS AND DISCUSSION: ADSORBENT
DEVELOPMENT
67
3.1 Preparation 67
3.1.1 Activated Carbon 67
3.1.2 Carbon-Hydrated Iron Oxide (C-HFO) Composite
68
3.2.1.5 Effect of Activation Temperature 80 3.2.2 Surface Functional Groups 82
3.2.2.1 Fourier Transform Infrared (FTIR) Spectroscopy
83
3.2.2.2 Boehm’s Titration 84
3.2.2.3 Determination of pHZPC of
activated carbon (pH Drift Method)
86
3.2.3 Thermogravimetric Analysis (TGA) of activated carbon
87
3.3 Characterization of C-HFO Composites 87 3.4 Leaching Test of Fe from C-HFO Composites 92
4 RESULTS AND DISCUSSION: APPLICATION OF ADSORBENTS
94
4.1 Application of Prepared Adsorbents 94 4.1.1 Selection of Prepared Activated Carbon 95
4.2 Adsorption Equilibria 97
4.2.1 Single Solute Adsorption Equilibria: Metal Cations
98
4.2.1.1 Single Solute Adsorption Equilibria: Cu(II)
98
4.2.1.2 Single Solute Adsorption Equilibria: Ni(II)
103
4.2.1.3 Single Solute Adsorption Equilibria: Zn(II)
107
4.2.1.4 Single Solute Adsorption Equilibria: Pb(II)
110
4.2.2 Binary Solute Adsorption Equilibria: Competitive Adsorption of Cu(II) and Ca(II) (Cu-Ca) and Evaluation of Mechanism
115
Competitive Adsorption of Cu(II), Ni(II) and Pb(II) (Cu-Ni-Pb)
4.2.4 Reuse of Cation-Exhausted Activated Carbon
128
4.2.5 Adsorption Studies: Cr(VI) 130
4.2.5.1 Selection of Prepared Adsorbents 130
4.2.5.2 The Effect of pH 132
4.2.5.3 Effect of Initial Concentration and Data Fitting to Models
134
4.2.6 Adsorption Studies: Arsenic 137
4.3 Adsorption Dynamics 142
4.3.1 Adsorption Dynamics of Cu(II) on PSW-P-ad-500
144
4.3.2 Adsorption Dynamics of Ni(II), Pb(II) and Cr(VI) on PSW-P-ad-500
146
4.4 Summary of Thesis 150
5 CONCLUSIONS AND SUGGESTIONS FOR
FUTURE STUDY
152
5.1 Conclusions 152
5.2 Problems Encountered in Present Study 155 5.3 Recommendations for Further Studies 156
REFERENCES 157
LIST OF TABLES
TABLE NO. TITLE PAGE
1.1 A survey of recent literatures on the production of
activated carbons from various lignocellulosic precursors
23
1.2 Proximate analysis of solid oil palm residues (Husain, Zainac and Abdullah, 2002)
29
1.3 Ultimate analysis of solid oil palm residues (Mahila et al., 2001)
30
1.4 Proximate and ultimate analyses of coconut shell (Banerjee, et al.,1976)
30
2.1 Preparation variables of various activated carbons activated either in a muffle (M) or in a tube furnace (T)
51
2.2 The operating parameters of FAAS in the determination of metal cations
66
3.1 The contents of Fe, oxygen, Na/Ca and C in the prepared composites and in their parent activated carbons
69
3.2 Yield, BET surface area, average pore width, total pore volume and pore-types of various activated carbons
71
3.3 Contents of phosphorous (P) in some of the selected activated carbons as determined by EDX
71
3.4 Base neutralization capacity and quantification of acidic groups on surfaces of some of the prepared activated carbons by Boehm’s titration method
85
3.5 The pHZPC of some activated carbons obtained from pH
drift method
86
technique
3.7 The BET surface area, average pore width, total pore volume and pore-types of C-HFO composites and their parent activated carbons
88
3.8 Properties of Virgin GAC and Fe-GAC obtained from Norit Americas Inc. (Reed, Vaughan and Jiang, 2000)
92
4.1 Cu(II) uptake capacity of various activated carbons in a single solute solution while initial solution (adsorbate) concentration and pH were kept constant at 292 ± 6 mg.L-1 and 6 respectively with a constant adsorbent concentration of 2 g.L-1
96
4.2 Langmuir and Freundlich model parameters for the adsorption of Cu(II) in single-solute solution while initial concentrations were varied, < 5 - < 120 mg.L-1
101
4.3 Langmuir and Freundlich model parameters for the adsorption of Ni(II) by various activated carbons at initial pH 5 while initial concentrations were varied from 6 to 227 mg.L-1 and adsorbent concentration was kept constant at 2 g.L-1
105
4.4 The initial and equilibrium concentrations, and fractions removal of Ni(II) by various activated carbons in the low concentration solution at a constant initial pH 5
107
4.5 Langmuir model parameters for the adsorption of Zn(II) by various activated carbons at initial pH 5 while initial concentrations were varied from 19 to 310 mg.L-1 and adsorbent concentration was kept constant at 2 g.L-1
110
4.6 Langmuir and Freundlich model parameters for the adsorption of Pb(II) at initial pH 5 and at varying concentrations, < 50 - < 600 mg.L-1
112
4.7 The initial and equilibrium concentrations, and fractions removal of Pb(II) by various activated carbons in the low concentration range at pH 5
4.8 Langmuir and Freundlich parameters for the adsorption of Pb(II) on PSW-P-ad-500 for initial pH 3 at varying
concentrations, 50.6 ± 0.6-583 ± 2 mg.L-1
115
4.9 The Langmuir model parameters of Cu(II) and Ca(II) for the adsorption in binary solution at an initial pH 5, while initial concentrations of Cu(II) and Ca(II) were varied as 23.6 ± 0.1 to 117.5 ± 0.7 and 23.8 ± 0.2 to 120 ± 1 mg.L-1 respectively
117
4.10 Langmuir and Freundlich parameters for the adsorption of Cu(II) on PSW-P-ad-500 at a constant initial pH 4.5 while initial solution concentrations were varied from < 25 to < 700 mg.L-1 keeping adsorbent concentration 2 g.L-1
120
4.11 The Langmuir model parameters of Cu(II) and Ca(II) for the adsorption in binary solution at initial pH 3 while initial concentrations of Cu(II) and Ca(II) were varied as 26-151 and 20-109 mg.L-1 mg.L-1 respectively
122
4.12 Langmuir and Freundlich model parameters for the isotherms of Ni(II), Pb(II) in ternary and Cu(II) in single and ternary solutes solutions at initial pH 5
124
4.13 The initial and equilibrium concentrations, adsorption capacities and fractions removal of Cu(II), Ni(II), Pb(II) in the single and ternary solutes solutions by the best-selected carbon, PSW-P-ad-500 at initial pH 5 and at adsorbent concentration of 2 g.L-1
125
4.14 Langmuir model parameters for the adsorption-desorption of Cu(II)
130
4.15 The adsorption capacities of various adsorbents in the removal of Cr(VI) while initial pH was obtained without adjustment as 4.79 and adsorbent concentration was maintained as 2 g.L-1
132
4.16 Langmuir and Freundlich model parameters for the adsorption of Cr(VI) on PSW-P-ad-500 while initial concentrations were varied from 40 - < 200 mg.L-1 at an
optimum pH 3, keeping adsorbent concentration constant at 2 g.L-1
4.17 The initial and equilibrium concentrations, and fractions removal of Cr(VI) by various activated carbons in the low concentration at an optimum pH 3
136
4.18 Aqueous and solid phase equilibrium concentration of adsorbents (adsorption capacity) while adsorbate concentration was 1 mg.L-1, pH 7 and adsorbent
concentration 0.2 g.L-1 (Reed, Vaughan and Jiang, 2000)
139
4.19 Experimental adsorption equilibrium capacity, qe and kinetic model parameters for the adsorption of Cu(II) at constant initial concentration, < 50 mg.L-1 and at pH 5, while contact time was varied from 0.5 to 72 h
146
4.20 Experimental adsorption equilibrium capacity, qe and kinetic model parameters for the adsorption of Ni(II), Pb(II) and Cr(VI)
LIST OF FIGURES
FIGURE NO. TITLE PAGE
1.1 The periodic table showing classification of metals based on Lewis acidity as: Class A-hard metals (black), Class B-soft metals (light grey), Class AB-borderline (dark grey) (IUPAC, 2002)
11
1.2 Structures of carboxyl, phenolic hydroxyl and quinone type carbonyl groups
18
1.3 Structures of lactones, acid anhydrides and cyclic peroxide
18
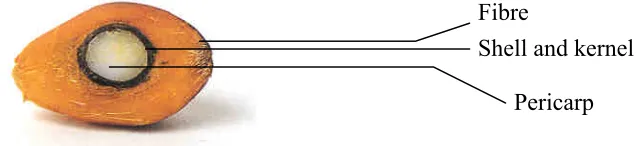
1.4 A cross section of masocarp of oil palm fruit bunch showing fibre, shell, kernel and pericarp
28
1.5 Process flow diagram of palm oil extraction showing the production of crude oil and wastages such as shells, kernel and fibres
29
2.1 A flow diagram of activated carbon preparation 49 2.2 A flow diagram of modification of activated carbons 52 3.1 N2 adsorption-desorption isotherms of various activated
carbons prepared from oil palm and coconut shell precursors under various process conditions
70
3.2 N2 adsorption-desorption isotherms of activated carbons derived from oil palm (A) and coconut shell (B)
precursors
73
3.3 Yield of various activated carbons as a function of precursor pretreatment such as non-pretreated (NP),
H2SO4 pretreated (SAP) and H3PO4 pretreated (PAP) conditions
3.4 BET surface area of various activated carbons as a function of precursor pretreatment such as non-pretreated (NP), H2SO4 pretreated (SAP) and H3PO4 pretreated (PAP) conditions
75
3.5 BET surface areas of various activated carbons derived from different charge states such as wet (PSW-P-500), apparently/semi-dried (PSW-P-ad-500) and completely dried (PSW-P-ed-450)
77
3.6 Total pore volumes of activated carbons derived from different charge states, as wet (PSW-P-500), semi-dried (PSW-P-ad-500) and dried (PSW-P-ed-450)
77
3.7 SEM micrograph of an activated carbon obtained from semi-dried feedstock of oil palm shell precursor, namely PSW-P-ad-500
78
3.8 N2 adsorption-desorption isotherms of two activated carbons, derived from smaller (1.18-0.6 mm) and larger (2.36-1.18 mm) particle sizes, namely PSWfg-P-450 and PSW-P-ed-450
79
3.9 The development of surface areas of various activated carbons prepared under different activation temperatures
80
3.10 FTIR spectrums of some of the prepared activated carbons, namely, 500, CPW-P-500 and PSW-P-ad-500
83
3.11 Graphs of equilibrated pH (pHf) vs. initial pH (pHi) by some of the prepared activated carbons for determining the pHZPC from the crossover point
86
3.12 SEM micrographs of composites of HFO-1 (A) and C-HFOCa-1 (B) obtained from parent activated carbon PSW-P-500 using different bases, such as NaOH and Ca(OH)2
89
from parent activated carbon CPW-P-500 while
magnification factor is different as 200X (A) and 800X (B)
3.14 SEM micrographs of C-HFO-3 obtained from parent activated carbon PSW-P-ad-500 while magnification factor is different as 250X (A) and 1200X (B)
91
4.1 Langmuir adsorption isotherms of Cu(II) at initial pH 3 (A) and pH 5 (B) by various activated carbons while initial solution concentrations were varied from < 5 to <120 mg.L-1
99
4.2 Langmuir adsorption isotherms of Cu(II) by prepared activated carbons for initial pH 3 (A) and pH 5 (B) and by a commercial activated carbon for initial pH 3 and pH 5 (C) while initial concentrations were varied, < 5 - < 120 mg.L-1
100
4.3 Freundlich adsorption isotherms of Cu(II) at pH 3 (A) and at pH 5 (B) while initial solution concentrations of Cu(II) were varied, < 5 - < 120 mg.L-1
101
4.4 Langmuir (A, B, C) and Freundlich (D) adsorption isotherms of Ni(II) at initial pH 5 by various activated carbons while initial solution concentrations were varied as 6 - 227 mg.L-1
104
4.5 Langmuir non-linear (A) and linear (B) isotherms of Zn(II) by CAC at initial pH 5 while solution
concentrations were varied, 19 - 250 mg.L-1
108
4.6 Langmuir non-linear isotherms of Zn(II) at initial pH 5 by prepared activated carbons, PSW-P-500 (A), CPW-P-500 (B) and PSW-P-ad-500 (C) while initial solution
concentrations were varied, 19 – 310 mg.L-1
109
4.7 Langmuir linear isotherms of Zn(II) at initial pH 5 by various prepared activated carbons while initial solution concentrations were varied from 19 to 310 mg.L-1
4.8 Langmuir non-linear (A) and linear (B and C) adsorption isotherms of Pb(II) at initial pH 5 by various activated carbons while initial concentrations were varied as < 50 - < 600 mg.L-1
111
4.9 Freundlich adsorption isotherms of Pb(II) at initial pH 5 by various activated carbons while initial concentrations were varied as < 50 - < 600 mg.L-1
112
4.10 Langmuir non-linear (A) and linear (B) adsorption isotherms of Pb(II) at initial pH 3 by the best-selected activated carbon, PSW-P-ad-500 while initial solution concentrations were varied from 50.6 ± 0.6 to 583 ± 2 mg.L-1
114
4.11 Freundlich adsorption isotherms of Pb(II) at initial pH 3 by activated carbon, PSW-P-ad-500 while initial solution concentrations were varied from 50.6 ± 0.6 to 583 ± 2 mg.L-1
115
4.12 Langmuir non-linear and linear isotherms of Cu(II) (A and B) and Ca(II) (A and C) while Cu(II) ions were adsorbed from single (Cu), binary (Ca-Cu) and ternary (Cu-Ni-Pb) solutions and Ca(II) from binary solution (Ca-Cu) by PSW-P-ad-500 at initial pH 5 and at varying initial concentrations, < 25 - ≤ 120.mg.L-1
116
4.13 The proposed interactions of Cu(II) and Ca(II) cations (Lewis acids) onto the surfaces of activated carbon where SO− and SOH (Lewis bases) represent the deprotonated surface functional groups on activated carbon. The vertical bars are depicted as solution-solid interface
118
4.14 Langmuir non-linear (A), linear (B) and Freundlich (C) isotherms of Cu(II) by the carbon PSW-P-ad-500 at constant initial pH 4.5 while initial solution
concentrations were varied from < 25 to < 700 mg.L-1 keeping adsorbent concentration constant at 2 g.L-1
119
of Cu(II) and Ca(II) for the adsorption in binary solute solution while concentration of Cu(II) and Ca(II) were varied as 26-151 and 20-109 mg.L-1 respectively keeping initial pH and adsorbent concentration constant, at pH 3 and 2 g.L-1 respectively
4.16 Langmuir non-linear (A), linear (B) and Freundlich (C) isotherms of ternary solute, Cu(II), Ni(II) and Pb(II), by the best selected carbon, PSW-P-ad-500 at initial pH 5, while their initial concentrations were varied as < 25 -
≤ 600 mg.L-1. (Ni samples were analysed for initial concentration range, < 25 to 305 ± 2 mg.L-1)
123
4.17 Langmuir non-linear and linear adsorption-desorption isotherms of Cu(II), while adsorbed at varying
concentration, < 25 to < 700 mg.L-1
129
4.18 Adsorption capacity of Cr(VI) by various selected adsorbents while pH were varied from 3 to 8 keeping initial concentration constant at about 40 mg.L-1
133
4.19 Langmuir non-linear (A), Linear (B) and Freundlich (C) adsorption isotherms of Cr(VI) by activated carbons, CAC and PSW-P-ad-500, at initial pH 3 while initial concentrations were varied from 40 - < 200 mg.L-1
135
4.20 Adsorption equilibrium capacities of a HFO composite and its counter activated carbon for the species of As(V) and As(III), while adsorptions were carried out in the solutions of As(V) and As(III) with constant initial concentrations, 1.641 and 2.170 mg.L-1 and with constant initial pH, at 5.5 and 7.6 respectively
138
4.21 An illustration of selective bond formation of dispersed hydrated iron oxide with As(V) and As(III) species in aqueous phase predominantly through Lewis acid-base interaction
141
4.22 Graph to check kinetics data of Cu(II) with first order kinetic model
4.23 Graph of pseudo-second order kinetic model for the adsorption of Cu(II) at constant initial concentration, < 50 mg.L-1 and at pH 5
145
4.24 A graph of adsorption capacity vs. contact time for the adsorption of Cu(II) at constant initial concentration, < 50 mg.L-1 and at pH 5
145
4.25 Graphs of pseudo-second order kinetic model for the adsorptions of Ni(II), Pb(II) and Cr(VI) at constant initial concentrations, < 45, 95 ± 1 and 77 ± 1 mg.L-1
respectively, while the initial pH of solutions of Ni(II) and Pb(II) were adjusted to 5 and that of Cr(VI) to 3
147
4.26 Graphs of adsorption capacities vs. contact time for the adsorption of Ni(II) (A), Pb(II) (B) and Cr(VI) (C)
148
4.27 A comparison in the rate constants of various metal ions for the adsorption onto acid activated carbon, PSW-P-ad-500
149
4.28 A comparison in adsorption capacities (qe) of various metal ions while qe obtained from adsorption equilibrium data for kinetics studies for the adsorption onto acid activated carbon, PSW-P-ad-500
LIST OF SYMBOLS
°C - Degree Celsius
C0 - Initial concentration
Ce - Equilibrium concentration
cm - Centi meter
dm - Deci meter
g - Gram
L - Liter
m - Meter
M - Molar
mA - Mili ampere
meq - Mili equivalent
mg - Mili gram
min - Minute
mL - Mili Liter
mm - Mili meter
mM - Mili Molar
nm - Nano meter
q or qt - Metal uptake at any time, t
qe - Metal uptake at equilibrium
t - Tonne
y - year
Å - Angstrom
µg - Micro gram
µm - Micro meter
LIST OF ABBREVIATIONS
AAS - Atomic absorption spectrophotometer
Av - Average
B.C. - Before Christ
BET - Brunauer, Emmett and Teller CAC - Commercial activated carbon DDW - Distilled deionized water
Dia - Diameter
DPC - 1,5-Diphenylcarbazide EDL - Electric double layer
EDX - Energy dispersive X-ray analysis
EFB - Empty fruit bunches
EPA - Environment Protection Agency
Et - Ethyl
FAAS - Flame atomic absorption spectroscopy FTIR - Fourier transform infrared spectrophotometer GAC - Granular activated carbon
h - hour
HFO - Hydrated iron oxide
HSAB - Hard and Soft Acids and Bases
ICP-MS - Inducedly coupled plasma mass spectrophotometer IUPAC - International Union of Pure and Applied Chemistry Max - Maximum
MOX - Malaysian Oxygen
NOM - Naturally occurring organic matter
QC - Quality control
rpm - Revolution per minute
RSD - Relative standard deviation SCF - Surface complex formation
SD - Standard deviation
SEM - Scanning electron microscope SOC - Synthetic organic chemicals SOCs - Synthetic organic compounds
TGA - Thermogravimetric analysis
USA - United States of America
USEPA - United States Environment Protection Agency
UV - Ultra violet
LIST OF APPENDICES
APPENDIX TITLE PAGE
A National Drinking Water Quality Standards, 2000 of Malaysia for some species of metals and metalloids
166
B EDX Spectrums of Some Selected Activated and Modified Carbons
167
C Summary Report of N2
Adsorption-Desorption Data and BJH Pore size distribution Graph
170
D FTIR Spectrums of Some of the Selected Activated Carbons
174
E Quantification of Acidic Groups on the Surface of Some Selected Activated Carbons as meq Base per Gram Carbon
175
F TGA Thermograms of Some of the Selected Activated Carbons
176
G FAAS Determined Fe Content in Samples of Leached Water Contacted with C-HFO-1 Composite Adsorbent at pH 4.5
186
H FAAS Determined Adsorption Equilibrium Data of Various Metal Cations in Single, Binary and Ternary Solutes Solutions by Various Activated Carbons at Varying Initial Concentration and pH
I UV-Vis Spectrophotometer Determined Adsorption Equilibrium Data of Cr(VI) in Single Solute Solution By Various
Activated Carbons and C-HFO Composite Adsorbents
203
J ICP-MS Determined Adsorption
Equilibrium Data of As(III) and As(V) for the Adsorption in a Single Point Initial Concentration By a Typical Prepared Activated Carbon and its modified ones, namely, PSW-P-500 and C-HFO-1 respectively
208
K Adsorption Kinetics Data of Cu(II), Ni(II), Pb(II) and Cr(VI)
209
L Presented Papers and Expected Publications from This Study
CHAPTER 1
INTRODUCTION
1.1 Research Background
monitoring around the year, it is very hard to say whether the quality of drinking water is safe for health.
This is why regulations are imposed on permissible levels of contaminants in drinking water from the potential health risks exposure to these. To minimize human contributing pollution to a lower level, laws are also enforced to treat wastewater before discharge. Among various pollutants in drinking and wastewaters, inorganic species of metals and metalloids are major, and difficult to remove because of their smaller size, very low concentration and competition with non-toxic inorganic species. The present concern over the presence of inorganic species necessitates a cost effective, eco-friendly treatment process to remediate these contaminants from drinking water and wastewater. Therefore, it is not surprising that current research trend is focusing on the utilization of local raw materials such as agricultural wastes, as low cost eco-friendly materials, in treating drinking and wastewaters preferentially to remove inorganic toxic species. As Malaysia is moving rapidly towards the concept of healthy drinking water, her huge wastes from agricultural sector, such as oil palm kernel and coconut shells, are needed to be selected as a promising precursor in the removal of ionic- and non-ionic inorganic toxic species.
1.1.1 Water Purification
the ancient water purification systems, muddy waters were settled in tanks or settling basins.
These early methods of water treatment, no doubt, were crude and imperfect, but these can be regarded as the beginnings of water purification on which modern art of water treatment technology is built. The necessity of treatment of public supply water was overlooked until the end of the nineteenth century, when cholera epidemics in England showed that infected water supplies were responsible for public disease. Over 53, 000 people died during this cholera epidemic in London in between 1848-1849 (Stevens, 1974). It was soon realized that drinking water should be free from disease causing organisms or toxic substances.
The impurities in water can be classified into three major groups such as i) suspended and colloidal matters, ii) dissolved substances and iii) biological contaminants. Suspended matters and colloidal particulates are responsible for making the water turbid. Coagulation, sedimentation and filtration are the processes usually employed to decrease the turbidity of water. Dissolved substances and some time odour and colour are resulted from the presence of inorganic and organic constituents. Dissolved impurities especially inorganic ones are difficult to remove. In the early days, lime and soda were used in the reduction of dissolved hard ions those causes the hardness of water. Activated carbon was used in controlling taste and odour. Oxidizing agents followed by filters were used to reduce iron and manganese. Recent technology, in addition to chemical precipitation and adsorption, uses ion exchange sorption, membrane separation technique, desalination, electrodialysis etc. for the purification of dissolved contaminants in water.
Although the ion exchange phenomenon in clay and soil was reported in the beginning of the nineteenth century, its use for large scale water softening had begun only in the beginning of the twentieth century. At the beginning, natural and synthetic aluminium silicates were used for softening waters. The limitations of siliceous ion exchangers became more and more evident as commercial exploitation of these substances was attempted. Substitution was made by sulphonated coal as cation exchangers. Attachment of sulphonic acid groups on the surface of coal, lignite and peat by sulphonation reaction was a distinct contribution to the development of ion exchange resins. In 1935, Adams and Holmes (cited by Kunin, 1958) observed the ion exchange properties in the synthetic resins of phenol-formaldehyde. Further studies resulted in the synthesis of cation exchange resins containing strongly acidic sulphonic acid groups while condensing phenols and formaldehyde in the presence of sodium sulphite. Anion exchange resins were prepared in an analogous manner by the condensation polymerization of amines with formaldehyde. Since 1940, the synthesis of ion exchange resins has made spectacular advances having high cation and anion exchange capacity over the entire pH range and durable physical properties.
Today’s municipal water treatment plant still uses conventional processes including screening, coagulation, sedimentation, and chlorination. Although modern water conditioning technology can solve almost all water quality problems, still the technology is not reachable to the majority of the world population because of high treatment cost. The modern water treatment plants are economically feasible in large scale operation and such big plants are usually installed in highly populated urban areas. As a consequence, majority of people residing in rural areas not only develop tolerances for drinking water of poor taste, odour or appearance but also belief that their water supply requires no treatment. On the other hand, tap water may be contaminated either from the corrosion of the pipelines or from the sources whether ground or surface. This is why, not only the rural and small community people, sometime urban people using supply water are still in scarcity of quality drinking water. In such cases, it is strictly advised to treat the water before drinking it.
individuals of the world population can benefit using this process in home water conditioning unit. The successful solution to this challenge largely depends upon the manufacturing of proper adsorbents followed by subsequent utilization in house hold filtering unit. The later work consists of three steps of investigations: i) bench-scale adsorption studies in a batch or column in laboratory using synthetic solution of mg.L-1 level, ii) medium-scale adsorption studies in a pilot plant using actual drinking water, iii) full-scale treatment evaluation in a modular unit.
1.2 Heavy Metals
The classification of some elements as heavy metals does not have a rigorous scientific basis or a chemical definition. But they have widespread usage among professionals and laymen for over the past two decades. They constitute a group name for the transition and post-transition metals along with metalloids, arsenic and selenium, that has been associated with contamination and potential toxicity or eco-toxicity (SenGupta, 2002; IUPAC, 2002). No relation can be drawn with specific
gravity and toxicity. Even then, they are so called only because of their significantly heavier specific gravity, usually greater than five though exceptions remain, in comparison to sodium, calcium and other light alkali and alkali-earth metals.
1.2.1 Pollution and Remediation Approaches
environmental pollution has been blamed on many different things and one of the major things is the pollution due to metals or their species in the environment.
The presence of heavy metals, strictly speaking ‘the species of heavy metals’, in the environment is of increasing major, worldwide concern for the last few decades. The toxicity and threat of heavy metal species to human life and environment came into the limelight in 1970s especially after the disclosure of mercury poisoning by the Minamata disaster in Japan (Kadirvelu et al., 2004). Since then, World Health Organization (WHO) set up various permissible limits on the discharge of heavy metals into the environment. According to WHO (cited by Rivera-Utrilla and Sanchez-Polo, 2003), aluminium, chromium, magnesium, iron, cobalt, nickel, copper, zinc, cadmium, mercury and lead are the most toxic metals. Toxic metal pollution can be a much more serious and insidious problem, as these are intrinsic components of the environment. At high concentrations, all the metal species are toxic to both animals and plants. Heavy metals are continually released into the aquatic environment from natural processes, such as volcanic activity and weathering of rocks, as hidden pollutant. Arsenic, another hidden common trace inorganic contaminant in drinking water, is extremely detrimental to human beings.
Leaching from geological formations is a major natural source of arsenic in the ground water. Thus the presence of toxic elements or ionic/nonionic species particularly in ground water makes the so-called safer water unsafe at least in some part of the world and those are not affected, still in risk. Metals are also released into environment from a wide spectrum of anthropogenic sources such as smelting of metallic ores, industrial fabrication and commercial application of metals, agro-chemicals, pesticides as well as burning of fossil fuels. These metals are redistributed in the biosphere and dispersed in the air, soil, water and consequently in human beings through food chain bio-magnification causing chronic ailments.
thyroid and adrenals, and in the central nervous system. These chemicals and metals together result in a chronic toxic overload condition in our bodies. As these toxins build up, they block the receptor sites for essential minerals, so that minerals such as iron, calcium and magnesium cannot be utilized and absorbed. This causes enzyme dysfunction, nutritional deficiencies, hormonal imbalances, neurological disorders, damages brain chemistry, and can even lead to auto-immune disorders, cancer, and other debilitating chronic conditions. As early as 1974 in Florence, Italy, at the Congress of the World Health Organization, attention was drawn to the fact that 60-80% of the environmental toxins, which includes heavy metals, contribute to many diseases like neuro-dermitis, autoimmune disorders, allergies etc.
For short- and long-term toxic effects, the maximum permissible concentrations of heavy metals in drinking water as well as in municipal and industrial discharges are closely regulated in most of the countries through legislation. Drinking water quality standards for some species of metals/metalloids, according to the National Drinking Water Quality Standards, 2000 of Malaysia, are presented in Appendix A. Ultimately, as heavy metal regulations for both drinking water and wastewater are becoming stricter, the conventional means of water treatment becomes either costly or inefficient.
Precipitation, sedimentation, coagulation, oxidation, filtration, sorption and membrane processes are generally employed to reduce heavy metal ions from the contaminated water. No doubt, the toxicity effects of these elements are largely a function of concentration. The widely used treatment method for the removal of heavy metal ions from wastewater is chemical precipitation using hydroxide, carbonate or sulphide or some combination of these chemicals. The most common processes use hydroxide precipitation, because the theoretical minimum solubility of metal hydroxides is low and the treatment cost is lower when lime is used.
Iron coprecipitation/adsorption is another well accepted process for the removal of heavy metal ions from water and wastewater. In this process, ferric salt, such as FeCl3 or Fe2(SO4)3, is added to water to form an amorphous precipitate of
iron oxyhydroxide, (Fe2O3.H2O). The dissolved and suspended trace
Flocs grow until they get heavy enough to settle down. The settled precipitate is then separated out from water, leaving a purified effluent. The process depends on reaction pH, adsorbate and adsorbent concentrations as well as the presence of competing cations and anions. Depending on pH, this process is also capable of removing oxyanions of arsenic, chromium and selenium from water and wastewater. The proposed mechanism of coprecipitation/adsorption of heavy metal ions on hydrous iron oxide surface can be presented by the following reactions (Benjamin, Hayes and Leckie, 1982), where oxide surface of iron, depicted by SO , acts as weak acid or base while gain or lose a proton.
Protonation of surface oxide:
SO + H = SOH (1.1)
SOH + H = SOH2+ (1.2)
Cation adsorption on protonated surface oxide:
Mn+ + mH2O = M(OH)mn-m + mH+ (1.3a)
SOH + M(OH)mn-m = SO.M(OH)mn-m-1 + H+ (1.3b)
(The system pH decreases as the reactions go forward)
Anion adsorption on hydro-oxylated surface:
SOH + mH+ = SOHm+1m+ (1.4a)
SOHm+1m+ + An- = SOHm+1Am-n (1.4b)
(The system pH increases as the above reactions go forward)
Here, M and A represent cationic and anionic adsorbate, respectively. The above equations, (1.3a) and (1.3b), reveal that protons are released into the system when an uncomplexed hydrated metal cation is adsorbed and equations (1.4a) and (1.4b) depict that protons are removed from the system during the adsorption of anions. These equations thus describe that increasing the concentration of deprotonated, SOH/SO− and protonated, SOH2+ surface oxide sites, increases the
pH. But the limitation of the process of precipitation and coagulation/flocculation is that these are effective in removing some metal ions in drinking water to mg.L-1 levels but not always to µg.L-1 levels. This process also generates huge sludge. All of above, the removal of dissolved trace toxic substances or heavy metal ions is targeted at the point of use. Because it is considered a monetary burden, especially in the developing countries, to treat water at an early stage, when only 1% of water supplied to households is consumed by humans. Therefore, it is rational that adsorption processes are substituting precipitation methods.
Ion exchange sorption and membrane processes such as reverse osmosis are capable of reducing metal concentrations to very low levels. But these are expensive and subject to operation problems such as fouling (Reed, Vaughan and Jiang, 2000). Thus, to mitigate the present problem of lowering the heavy metal contamination to the permissible level, an introduction of cost-effective, eco-friendly highly efficient sorption technology is needed to impose as down stream treatment process preferably to be used at the point of use or in house hold filtering unit. The term high efficiency is used to mean that the process would be selective towards the target species and capable of treating them to a safe level. To meet the cost-effective criteria, the process should be based on locally available low cost material and unlike ion exchange synthetic polymeric resin, should be eco-friendly. Thus the majority of people especially rural people might benefit from the innovative adoption of existing knowledge of advanced water treatment.
selectivity towards target heavy metal ions makes the commonly used cation exchangers uneconomical and unfavourable.
Any elemental species with a net positive charge behaves as a Lewis acid (Shriver, Atkins and Langford, 1991). Most of the heavy metal cations such as Cu2+, Hg2+, Pb2+, Ni2+, Cd2+ and Zn2+ being transition-metal ions exhibit fairly strong Lewis-acid characteristics due to the presence of incomplete d-orbital. Their electron clouds are readily deformable by the induction effect of electric field of other species. They favour to form fairly strong complexes with Lewis bases, organic and inorganic ligands, in the aqueous phase through inner sphere complexes by coordinated with donor electrons. Heavy metal cations thus can serve as good electron accepters. In other words, they are relatively ‘soft’ cation.
In contrast, cations of light metals, such as alkali and alkali-earth metals, having the inert gas configuration are not good electron acceptors and hence poor Lewis acids. Their electron clouds are not readily deformable by the electric field of other species. Thus they are less polar and commonly referred to as ‘hard’ cations. They form only outer sphere complexes with aqueous-phase ligands containing primarily oxygen donor atoms through columbic force of attraction. Hence, the simple ion exchange sorption-desorption processes are applicable to remove, preferentially, these hard ions. Pearson (1968) first showed that most cations are Lewis acids and anions are Lewis bases, while he expressed their strengths and affinity to acid-base-complexation in his famous principle of ‘hard and soft acids and bases’ (HSAB) using the property of ions as ‘soft’ and ‘hard’.
as Class A and Class B, the term Class AB is conveniently introduced for the borderline metals throughout this thesis. Figure 1.1 shows the periodical table classifying metals as Class A- hard, Class B- soft and Class AB- borderline metals (IUPAC, 2002).
1
Class A
Hard
Class AB
Border line
Class B
Soft
H 2 13 14 15 16 17
Li Be B C N O F
Na Mg 3 4 5 6 7 8 9 10 11 12 Al Si P S Cl
Fe(III) Cu(II) K Ca Sc Ti V Cr Mn
Fe(II) Co Ni Cu(I) Zn Ga Ge As Se Br
Rb Sr Y Zr Nb Mo Te Ru Rh Pd Ag Cd In Sn Sb Te I
Pb(IV) Cs Ba † Hf Ta W Re Os Ir Pt Au Hg Ti
Pb(II) Bi Po At
Fr Ra # Rf Db Sg Bh Hs Mt 110
Figure 1.1: The periodic table showing classification of metals based on Lewis
acidity as: Class A-hard metals (black), Class B-soft metals (light grey), Class AB-borderline (dark grey) (IUPAC, 2002).
Although the term ‘heavy metals’ is used by the legal regulations, it has no sound terminological or scientific basis in the interpretation of toxicity and has never been defined by authoritative body like IUPAC- International Union of Pure and Applied Chemistry. Since no relationship can be drawn between density and toxicity or eco-toxicity, a classification based on their chemical properties is put forward in this work to abandon the classification of some metal ions as heavy metals and to
†Lanthanide La Ce Pr Nd Pm Sm Eu Gd Tb Dy Ho Er Tm Yb Lu
follow the guideline of IUPAC. A theoretical basis of classification of metals as Class A and Class B has been introduced by Klopman (cited in IUPAC, 2002) depending on the calculated orbital electronegativity of cations or anions. Metals with calculated orbital electronegativities above 1.45 all belong to Class A, while those have the orbital electronegativity below -1.88 are all Class B.
Hard cations prefer hard (oxygen) donor ligands and form mainly ionically bound complexes. As the bonding of hard cation and hard ligand is mostly ionic in nature, metal ions are displaceable and mobile. Soft cations generally exhibit higher affinity toward nitrogenous and sulphurous species having donor lone-pair electrons. Thus soft cations are able to form strong inner-sphere complexes with these donor atoms. The higher atomic number p-block metals show strong affinity for soft ligands such as sulphide or sulphur donor and form highly covalent complexes from which they are difficult to displace. Thus they are relatively immobile in the environment. In living organisms, they are not readily excreted and tend to accumulate with resultant toxicity in protein molecule containing thiol group (-SH). The borderline metals generally form relatively stable complexes with both hard and soft donor ligands, but the exact order of stability is not easily determined. First row
d-block transition metal ions fall mainly into this group and show widely variable coordination chemistry.
The basis of this principle has widely been used in the synthesis of chelating ion exchangers with various types of covalently attached functional groups for separating hard and soft cations. It is thus possible to utilize the Lewis acid-base interaction for the high selective uptake of heavy metal cations by the sorption process on chelating cation exchangers. As the composition of the functional groups of simple cation exchange resins changes from hard oxygen donor atoms, carboxylate groups, to relatively soft nitrogen donor atoms, such as bispicolylamine: -CH2-N.(CH2-C5H9N)2, the affinity of soft cations is greatly enhanced over the hard
The synthesis of polymeric chelating cation exchange resins involves a major step of covalent attachment of organic functional groups onto the parent polymer beads which makes the preparation difficult and costly. Moreover, sorption of metal ions onto chelating ion exchangers is kinetically slow due to the slower intraparticle diffusion of metal ions through the rigid structure and tortuous pathways within exchangers (SenGupta, 2002). Hence the present problem demands the replacement of the chelating/polymeric cation exchangers with renewable naturally occurring low-cost materials those contain carboxylate, carbonyl, phenolic groups and those exhibit moderate to high affinity toward heavy metal ions.
1.3 Activated Carbon
Activated carbon is a processed carbon material. Due to highly developed internal surface area and porosity, porous carbon materials or activated carbons have been used for thousands of years and have now become extremely versatile adsorbents. The adsorptive properties of carbon were well known long before the terms active and activated had been developed or doped.
The major applications of activated carbon are the removal of species by adsorption from liquid or gas phase, to effect the purification or recovery of chemicals (Girgis et al., 2002), storage of natural gas of vehicles, catalysis supporter and electric double-layer capacitors (Yang et al., 2004). Although activated carbon is an inexpensive and widely used adsorbent, its commercial application in water treatment, till now, is limited to remove taste and odour. Granular activated carbon (GAC) or powered activated carbon (PAC) is used in water treatment especially in the developed countries. It is also used in high-tech application for the removal of synthetic organic compounds (SOCs), volatile organic compounds (VOCs), and naturally occurring organic matter (NOM).
been shown by many researchers (Dastgheib and Rockstraw, 2001; Toles et al., 1999; Johns et al., 1998; Toles et al., 1998; Toles et al., 1997) that lignocellulosic agricultural wastes, particularly nutshells, are very good precursors for the production of granular activated carbons having suitable surface active sites for the removal of heavy metal ions from aqueous solutions. Since the ions of heavy metals, Class B and Class AB, have the stronger affinity toward donor sulphur and nitrogen atoms, simultaneous/stepwise activation and functionalization of the precursor or the surface of activated carbons by these donor atoms can improve largely the removal capacity of these metal ions (Gomez-Serrano et al., 1998; Krishnan and Anirudhan, 2002; Krishnan and Anirudhan, 2003; Yantasee et al., 2004). The utilization of such modified activated carbons would be very promising
for the removal of particular, especially Class B, metal/metalloid species.
1.3.1 Historical Aspect of Carbon
The application of powdered charcoal goes back to prehistoric times. The use of charcoal in medicine was reported in an Egyptian papyrus as early as 1550 B.C. (Hassler, 1974). A Swedish chemist Karl Wilhelm Scheele, an apothecary by profession, was the first to discover the adsorptive properties of charcoal in 1773 when an experiment, consisted of the adsorption of gases, was conducted. The power of charcoal in removing colour from solution was first observed by the Russian academician Lovits in 1785. A few years later in 1794, wood char was employed to purify cane sugar in England. During the nineteenth century, much research had done to develop decolourizing carbons from various source materials such as bone, blood, cocoanut, flour, tar etc. with a special preference to be used in sugar industry. The chemicals generally used in these preparations were potash, magnesium carbonate, phosphate etc. In 1862, Lipscombe manufactured a carbon for the treatment of drinking water.
process metallic chlorides were used as activating agent whereas in another process carbon dioxide was used as selective oxidizing agent. Elevated carbonization temperature was applied for activation with carbon dioxide.
In 1909, a plant was built for the first time to manufacture powdered activated carbon on industrial scale following Ostrejko’s patents. In 1911, the same plant produced new kinds of activated carbon from peat by activation with steam. In 1915 during World War I, preparation of granular activated carbon was developed by Germany as filtering material in gas masks to protect the soldiers against chlorine gas used by the German soldiers. Coconut shell was emerged then as promising raw material for the production of granular activated carbon.
During the past decades, activated carbons have been produced from a variety of raw materials by employing different processes. Manufactured carbons have been found numerous applications in the industry. Although many of ancient preparations make the basis of today’s industrial process, they were not then developed on a commercial scale. The reason is assumed in the difficulties in process engineering as well as in the lack of knowledge in diversifying its application.
1.3.2 Structure of Activated Carbon
Activated carbons are highly porous materials with surface areas of up to 3000 m2.g-1. The surface area of a typical activated carbon is about 1000 m2.g-1. These high surface areas are the result of development of mainly micro- and mesopores while a little contribution is also come from macropores. According to the IUPAC classification, pores having the radii less than 2 nm are called micropores whereas pores having the size of radii in between 2 to 50 nm are identified as mesopores. Macropores are defined as pores having the radii size above 50 nm.
crystalline characteristics, even though they may not show certain features, such as crystal angles and faces, usually associated with the crystalline state. The existence of submicroscopic dimensions in so called amorphous carbons makes the micro-crystal structure known as micro-crystallites. It was evident that amorphous carbon consists of graphitic flat plates in which the carbon atoms are arranged in a hexagonal lattice, each atom, except those at the edge, is held by covalent linkages to three other neighbouring carbon atoms. The crystallites formation is the result of the stacking of two or more of these plate-structures with an interlayer distance of 3.6 Å (Hassler, 1974).
The diamagnetic anisotropy is the highest in activated carbon among known materials. The structure of delocalized π-electrons is similar to that of aromatic hydrocarbons. Each basal layer can be considered a unique macromolecule. The various basal layers in the lattice, having delocalized electron structures, are markedly separated from one another. The relatively large distance between layers and the weak forces that hold the layers together make it possible for atoms, ions or molecules to enter the interlayer spaces. The adsorbates make room for themselves if necessary by forcing the sheets farther apart (Cini, Pantani and Sorace, 1980).
1.3.2.1 Surface Functional Groups
The adsorption of acids and bases on carbon was found to be controlled by the concentration of surface-oxygen. This finding led to study the effect of oxygen in contact with carbon at different temperatures and pressures. It was observed that graphite, carbon black, and activated carbon can adsorb molecular oxygen. Elevated temperature is needed to remove once chemisorbed oxygen.
900°C in air, steam, or carbon dioxide. Amphoteric properties are found in carbons prepared between 500 to 800°C. The activated carbons prepared at low activation temperature, below 500-600°C, adsorb OH- ions primarily are called L-carbons. Those activated carbons are prepared at above 500-600°C and adsorb H+ ions are called H-carbons.
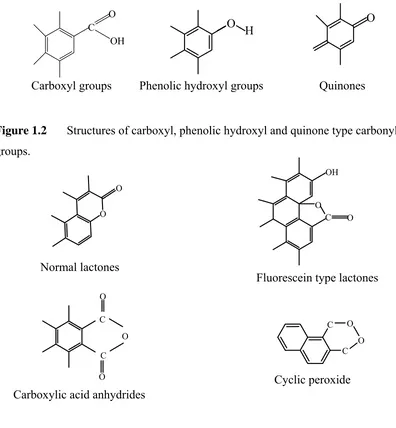
Almost every type of functional group in organic chemistry has been suggested to be present on activated carbons surface. The ones suggested most often acidic functional groups are: carboxyl, phenolic-hydroxyl, and quinone-type carbonyl groups (Figure 1.2) while other suggested groups are ether, peroxide and ester groups in the forms of normal lactones and fluorescein-like lactones, carboxylic acid anhydrides and the cyclic peroxide (Figure 1.3). On the other hand, proposed basic surface groups include chromene andpyrone.
Typical identification reactions of organic chemistry were employed by Boehm (2002) to characterize oxygen chemisorbed on carbon as comprising four types of acidic surface groups:
1) a strongly acidic carboxyl group which is neutralized by NaHCO3, Na2CO3,
NaOH, and NaOC2H5,
2) a more weakly acidic carbonyl group which is neutralized by Na2CO3 or
stronger bases such as NaOH and NaOC2H5; but not by NaHCO3,
3) a phenolic hydroxyl group which is neutralized by NaOH and NaOC2H5,
4) a carbonyl group which is neutralized by NaOC2H5 only.
Figure 1.2 Structures of carboxyl, phenolic hydroxyl and quinone type carbonyl
groups.
Figure 1.3 Structures of lactones, acid anhydrides and cyclic peroxide.
Chemically bound oxygen on the edges localizes electrons in surface states and withdraws them from the π electron system of the basal planes. Depletion of electrons by oxygen creates an increase in the population of positive holes in the conduction band of the π electron system and thus reduces the non-polar nature with an ultimate reduction in adsorption capacity of aromatic compounds. This is consistent with the concept of dispersion forces.
The motion of electrons in an atom or molecule would lead to a rapidly oscillating dipole moment while at any instant experiences the lack of symmetry of the electron distribution about the nuclei. When this atom or molecule approaches in close proximity to a non-polar solid surface, each instantaneous dipole induces an
Normal lactones
O O
O OH
C O
Fluorescein type lactones
Carboxylic acid anhydrides
C
O
C O
O
C O
C O
Cyclic peroxide Carboxyl groups
C OH O
Phenolic hydroxyl groups O
H
appropriately oriented (so that attraction could occur) dipole moment in a molecule on the surface. The interaction of these instantaneous dipoles with their counter induced ones produces an instantaneous attraction between adsorbate and adsorbent. The dispersion forces between the phenol’s π electron system and the π band of the graphitic planes of the carbon are responsible for adsorption. Removal of electrons from the π band of the carbon by chemisorbed oxygen may interfere with and weaken the adsorptive forces resulted from the permanent polarity in the surface.
Since the polarity of carbon arises with the introduction of surface oxygen, the adsorption of metal ions on carbon surface seems to be favoured accordingly. The acid-base and metal removal behaviour of several commercial activated carbons have been modelled successfully by the Surface Complex Formation (SCF) model (Corapcioglu and Huang, 1987; Reed and Matsumoto, 1991). This model basically uses the law of mass action to describe ion interactions with hydrous solid surface.
According to this model (SCF), the surface of the hydrous solid acquires a surface charge due to various surface groups or sites and thus develops an electric double layer (EDL) around the charged particle. It has been assumed that all surface sites are capable of binding and releasing protons equally for which the solid can be modeled as a single, weak diprotic acid. Using this assumption, the surface functional groups can be described by the following surface reactions:
SOH2+ SOH + Hs+ (1.5)
+ Hs+ SO
-SOH (1.6)
where, the symbol ( SO-) represents the active surface site attached on
interface.
number of weak monoprotic acids rather than a single diprotic acid by many researchers. There are two types of monoprotic acid sites to consider:
A positively charged site,
Pi OH
2+ PiOH0 + Hs+ (1.7)
And a negatively charged site,
Ni OH0 Ni O- H s+
+ (1.8)
where, ‘i’ is an index to differentiate between sites and Hs+ is the activity of proton at
the solid surface.
This model enables to measure the acidity constants for the above two types of equations (equations 1.7 and 1.8). It is assumed that the sites that release and bind protons are also responsible for removing metal cations. We have seen that the surface acidity of activated carbons play an important role in adsorbing positively charged species. In addition, many researchers established the ability of activated carbons in removing heavy metal ions. Therefore, it is hoped that the use of granular activated carbon in removing heavy metal ions (class AB and class B) will become more common in near future.
1.3.3 Preparation
The development of pores and their size-distributions mainly depends upon the precursor type and the process of preparation. Acid treatment can be performed after activation to control the ash content in the resulted carbon. The process, activation of carbonaceous material, comprised of either physical or chemical activation method. Based on the required properties of the activated carbon, the proper raw material and most importantly the activation process are utilized. Low temperature activation processes are adopted in presence of air or oxidizing materials to prepare carbon having acidic characteristic to remove preferably metal cations.
Physical activation consists of controlled or partial gasification of carbonaceous raw material. This uses gaseous flow, at high temperature, of mild oxidizing agents such as steam and CO2 or a combination of these. Partial
gasification eliminates unorganized carbon and non-carbon volatile matters as respective oxides. The process usually carried out in two steps: thermal carbonization of carbonaceous precursor in presence of an inert gas (such as N2)
atmosphere followed by activation of the resulting char in a mild oxidizing gaseous (CO2 and steam) atmosphere. The use of catalyst (e.g. K-, Na-salts) for the partial
gasification of carbon is a variation of physical activation.
Chemical activation process consists of impregnation followed by carbonization. The impregnation process is applied in order to achieve a good contact of a solid with a solution containing activating chemical, such as ZnCl2,
H3PO4, or KOH etc. to be deposited on the surface. Carbonization is carried out by
heating at a relatively low temperature under the atmosphere of nitrogen. Chemical activation is generally applied to uncarbonized feedstock containing cellulosic materials while activation is based on the dehydration of the feedstock. The more extensive impregnation produces weaker cellular structure and a large development of mesoporosity. A combination of both, physical and chemical, processes may also be practiced.
porosity in the resulting char. The free valancies of released carbons are satisfied to group them into organized crystallographic formations known as elementary graphitic crystallites. The mutual arrangement of these crystallites is irregular, so that free interstices remain between them and, apparently, as the result of deposition and decomposition of tarry substances, these become filled or blocked by disorganized carbon (Wigmans, 1989). Therefore, the resulting carbonized product needs activation to enhance its adsorption capacity. Activation process further develops the porosity and creates some ordering of the structure to generate a highly porous solid as the final product. Chemical impregnation of lignocellulosic carbon precursor results degradation of the cellulosic material while carbonization produces dehydration. The former results in charring and aromatization of the carbon skeleton whereas the latter creates the pore structure (Smisek and Cerny 1970).
The common feature of all substances used in the chemical activation process is that they are dehydrating agents that influence pyrolytic decomposition and inhibit formation of tar. As a result, higher yield is obtained with a high bulk density suitable for use in column. It is believed that dehydration, due to impregnation, proceeds by the partial dissolution of biopolymers together with the cleavage of either bonds between the lignin and cellulose, followed by recombination reactions in which layer structural units are formed, which ultimately derived a rigid crosslinked solid (Molina-Sabio et al., 1995). Then, in the next step, thermal treatment of the impregnated feedstock modifies the morphology and dimensions of the cellular units existing before impregnation. There is first an expansion of the cellular structure at impregnation state, then a subsequent contraction during carbonization at a temperature above 450°C (Caturla et al., 1991).
Coals are widely used as conventional feed stock for the manufacture of activated carbons and the process usually followed is physical activation: carbonization at about 600-650°C to prepare char, followed by partial gasification of carbon, called activation, using steam or carbon dioxide at 800-950°C to develop pore structure (Jagtoyen et al., 1992).
different cellulosic and lignocellulosic materials to prepare high surface area activated carbons. Phosphoric acid is used to provide oxidation environment. The phosphoric acid activation process was independently developed in America and Europe by Hudson and Urbain respectively.
Although a good number of works have been found regarding preparation of activated carbon from oil palm kernel shell, the publications regarding preparation variables and application in removing metal ions from aqueous solution are still rare. So it would be our prime focus to utilize oil palm shell as low cost local raw materials for the preparation and modification of activated carbon and subsequent adsorption studies for the removal of metal ions. As huge amounts of coconut shells are also produced as agricultural wastes, focus would also be given to utilize them as precursor as well as to study their suitability in removing metal ions.
1.3.3.1 Processing of Lignocellulosic Materials
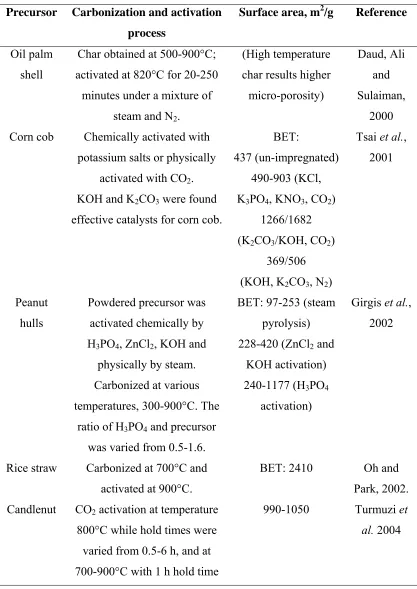
A summary of the processing of lignocellulosic precursors to obtain activated carbons, reported in recent literatures, is presented in Table 1.1.
Table 1.1: A survey of recent literatures on the production of activated carbons
from various lignocellulosic precursors.
Precursor Carbonization and activation process
Surface area, m2/g
Reference
Coconut shells
H3PO4 impregnation; carbonization
under air at 300-550°C.
BET: 1360 Laine et al.
1989 Peach
stones
ZnCl2 impregnation:
heat treated; carbonized in N2 at 500-800°C,
in CO2 at 825 or 875°C.
BET: 1000-2000,
2700-3000
Table 1.1: Continued.
Precursor Carbonization and activation process
Surface area, m2/g
Reference
Coconut shell
Physical activation:
CO2, CO2 + K-phosphate catalyst;
carbonization at 800°C.
BET: 696- 1341 Laine and Yunes, 1992 Oil palm shell Activated using steam, CO2,
H3PO4.
BET: 1000 Asiah,
1993 Olive stones Physical activation: CO2 and water
vapour; carbonization at 750-825°C.
- Rodríguez
-Reinoso,
et al., 1995 Peach stones H3PO4 impregnation, sink 2 h at
85°C; carbonization under N2 at
450°C, hold time 4 h.
BET: 338-1323
Molina-Sabio et al., 1995 Oil palm shell Impregnated with varying amounts
of ZnCl2 and carbonized at 500°C.
BET: 1500 Hussein et al., 1996 Rice straw,
sugarcane bagasse, soybean
hull, peanut, pecan and walnut
shells
Carbonized at 750°C in N2 for 1 h;
activated with CO2/steam at
850/800°C for 5-15 h followed by oxidative treatment using air + N2
at 300°C or chemical oxidation at 23°C. 85-721 Johns, Marshall and Toles, 1998 Almond, pecan, English walnut, black walnut and
macadamia nut shells
H3PO4 impregnation, pre-heat
treatment at 170°C, carbonization at 450°C in N2 or air for 1-2 h
followed by oxidation in air at 300°C those prepared in N2.
991-1693 Toles, Marshall and Johns,
Table 1.1: Continued.
Precursor Carbonization and activation process
Surface area, m2/g
Reference
Pecan shell Char preparation followed by
activation using steam, CO2 or
H3PO4. Physical activation was
carried out at 850°C in N2
followed by oxidation at 370-410°C. Chemical activation was
carried out by impregnating for 24 h in air and then pre-heat treated and carbonized at 170
and 450°C respectively.
618-1561 Johns, Marshall and Toles,
1999
Almond shells Pyrolysis at 700-800°C;
activation with steam/CO2 at
800°C, hold time 2/4 h.
425-673 and 197-560
Toles et al., 2000
Pecan shell Air and H3PO4, pre-heat
treatment 160-215°C, carbonization temperature: 160,
300-500°C.
27-1017 Dastgheib and
Rockstraw, 2001 Coconut shells and
palm seeds
Combining ZnCl2 and CO2
activation; carbonized at 800°C, hold time 2-3 h.
937-2450 Hu and
Srinivasan, 2001 Oil palm stone Impregnation with ZnCl2, H3PO4
or KOH for 24 h followed by carbonization in N2 for 2 h at
temperature up to 600°C; after cooling activated with CO2 at
700-900°C for 1 h.
ZnCl2: 1837
H3PO4: 1563
KOH: 1408 Physical activation: 892 Guo and Lua, 2000
Oil palm stone Activation using CO2 at
650-950°C for 0.3-3 h.
942-1410 Lua and
Table 1.1 : Continued.
Precursor Carbonization and activation process
Surface area, m2/g Reference
Oil palm shell
Char obtained at 500-900°C; activated at 820°C for 20-250
minutes under a mixture of steam and N2.
(High temperature char results higher micro-porosity)
Daud, Ali and Sulaiman,
2000
Corn cob Chemically activated with
potassium salts or physically activated with CO2.
KOH and K2CO3 were found
effective catalysts for corn cob.
BET:
437 (un-impregnated) 490-903 (KCl, K3PO4, KNO3, CO2)
1266/1682 (K2CO3/KOH, CO2)
369/506 (KOH, K2CO3, N2)
Tsai et al., 2001
Peanut hulls
Powdered precursor was activated chemically by H3PO4, ZnCl2, KOH and
physically by steam. Carbonized at various temperatures, 300-900°C. The
ratio of H3PO4 and precursor
was varied from 0.5-1.6.
BET: 97-253 (steam pyrolysis) 228-420 (ZnCl2 and
KOH activation) 240-1177 (H3PO4
activation)
Girgis et al., 2002
Rice straw Carbonized at 700°C and
activated at 900°C.
BET: 2410 Oh and
Park, 2002. Candlenut CO2 activation at temperature
800°C while hold times were varied from 0.5-6 h, and at 700-900°C with 1 h hold time
990-1050 Turmuzi et
Table 1.1 : Continued.
Precursor Carbonization and activation process
Surface area, m2/g Reference
Palm shells Precursor was impregnated with 5-40 % H2SO4 at 25°C for
24 h, and then evaporated at 110°C. Carbonized in N2
atmosphere at 300-700°C. For comparison, char was prepared
at 300-700°C for 2 h and then activated using CO2
500-900°C for 2 h.
1014-1062 Guo et al.,
2005
Apricot Soaked by impregnating agent (72 h) and then dried at 70°C. H3PO4 (25-75 %) activation at
400 and 600°C; ZnCl2
activation at 600 and 700°C varying the ratio of ZnCl2 and
precursor. Also activated using steam at 900°C.
211-728 Youssef et
al., 2005
1.3.3.2 Utilization of Oil Palm and Coconut Shells as Carbon Precursor
Although coals are being used as principal precursor, the renewable agricultural solid wastes have potential prospects over conventional materials because of high carbon but low ash contents (Guo and Lua, 2002). Malaysia is the largest producer of palm oil product. Figure 1.4 shows the cross section of masocarp of oil palm fruit bunch. This country produces 8.5 million tonnes of oil per annum. Since the oil is extracted from fresh fruit bunches it generates large amounts of
around the kernel and the empty fr