Thermal Comfort Survey in Office Buildings in Bandung, Indonesia
S.A. Damiati1, S.A. Zaki2*, S. Wonorahardjo3, M.S. Mat Ali2, H.B. Rijal4
1
Malaysia-Japan International Institute of Technology, Universiti Teknologi Malaysia, adsiti2@live.utm.my
2* Malaysia-Japan International Institute of Technology, Universiti Teknologi Malaysia, sheikh.kl@utm.my 3
School of Architecture Planning and Policy Development, Institut Teknologi Bandung, titus@ar.itb.ac.id
4
Department of Restoration Ecology & Built Environment, Tokyo City University, Japan, rijal@tcu.ac.jp
The comfort state of office building’s occupants is crucial since its related to the worker’s productivity. This comfort temperature of people from tropical climate might be different from temperate climate area. This study aimed to investigate thermal comfort and adaptive behaviour of occupants in office buildings with different ventilation modes: air-conditioned, mixed-mode, and free running. On February and March 2015, approximately 400 responses has been obtained through field surveys in three office buildings Bandung, Indonesia. The results has shown quite different comfort range between occupants in three ventilation modes: 24.7 oC, 26.3 oC, and 27.5 oC operative comfort temperature for FR, CL, and MM accordingly.
Keywords: Thermal comfort, Ventilation mode, Tropical climate, Office building
Introduction
Preserving thermal comfort is particularly a challenge in office buildings, where
the buildings are not only exposed to solar heat from the sun, but also gained
significant internal heat caused by occupancy. In other hands, the trade-offs between
energy consumption and occupant comfort has been quite dilemmatic. Aside from the
usual air conditioning system, there have been alternative solutions offered to be
applied in building ventilation system, such as natural ventilation and mixed mode
ventilation. The latter system claimed to have advantages over the former, such as:
reduced heating, ventilation and cooling (HVAC) energy consumption, reduced health
symptoms due to higher outdoor air ventilation rates, higher occupant satisfaction due
to improved comfort, and increased flexibility due to the use of distributed mechanical
systems and controls.
Even in the same office space, it is not an easy task to maintain an optimum
temperature setting, since each of occupants has different thermal sensation and
behavior. Many studies (Meester et al., 2013; Hiller, 2012; Tanner & Henze, 2014) has
been done and proved that occupant behavior has remarkable impact on their thermal
comfort. Several activities could be identified as attempts to maintain comfort state,
It is also important to know that the comfort expectations of a tropical population
and people from temperate or cold climate are different. A recent study in Brazilian
climate context (Vecchi et al., 2014), which varies considerably from tropical to
temperate climate, indicated that it is possible to find significant percentages of thermal
acceptability data outside of the zone proposed by ASHRAE 55 (2013) adaptive model.
From other previous field studies in the United Kingdom (Humphreys et al., 2013), India
(Indraganti, 2011), and Singapore (Yang et al., 2013), it is noted that temperatures well
above 30°C are not considered uncomfortable in some cases, while it normally would
considered as uncomfortable in many other places.
This study therefore would attempt to: 1) analyse occupants‘ comfort temperature
in office buildings with free running mode (FR), mixed mode (MM), and mechanical air conditioning for cooling (CL) in Bandung, Indonesia; 2) investigate occupants‘ adaptive
behaviour in maintaining thermal comfort; and 3) compare the comfort temperature
results with related standards.
Investigation Method
Investigated buildings
The survey had been conducted on February and March 2015, in three office
spaces in Bandung, Indonesia. Climate in Bandung is cooler than most of other
Indonesian cities and is classified as humid, due to its elevation. The average
temperature is 23.6°C throughout the year (Bureau of Statistics, 2003). Two of the
office spaces were located inside of ITB campus area, while the other one was located
inside of CIMB tower, a private bank company in urban area of Bandung. The detail of
all investigated office is shown on Table 1.
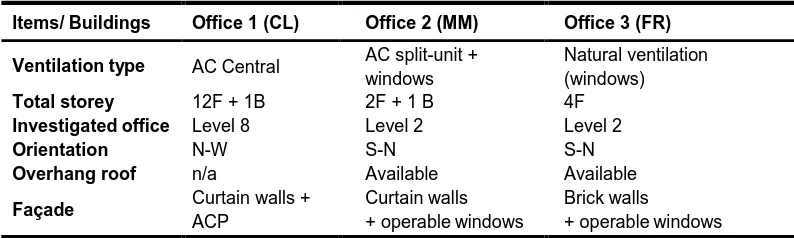
Table 1 Investigated buildings
Items/ Buildings Office 1 (CL) Office 2 (MM) Office 3 (FR)
Ventilation type AC Central AC split-unit +
windows
Natural ventilation (windows)
Total storey 12F + 1B 2F + 1 B 4F
Investigated office Level 8 Level 2 Level 2
Orientation N-W S-N S-N
Overhang roof n/a Available Available
Façade Curtain walls +
ACP
Curtain walls + operable windows
Brick walls
+ operable windows
AC: Air Conditioning, F: Floor, B: Basement, N: North, S: South, E: East, W: West, ACP: Aluminium Composite Panels
Thermal measurements
Since thermal comfort affected by physical and personal parameters, both were
measured simultaneously in this study. There was no interference or control over the
thermal environment, since this study aims to investigate occupant response to typical
every 10 seconds using digital thermo recorders (resolution 0.05°C, accuracy
±0.25 °C: 0°C to 50°C). This instrument comes with two external data channels. One
of these channels attached to TMC-HD1 external air temperature sensor tipped with a
40 mm black sphere to measure globe temperature. Outdoor temperatures were also
recorded using the same instrument, equipped with solar-radiation shield, located
outside of the investigated building. Simultaneously, air velocity was measured in 10
second intervals using hot wire anemometer attached with an omnidirectional probe
(resolution 0.01 m/s, accuracy ± 0.0125 m/s: 0.10 to 30.0 m/s).
Each equipment and sensor was set up in a retort stand, attached to a clamp,
approximately 1.1 meters height above floor level. These retort stands were placed around 1 meter radius of the occupants’ working place. Surface temperatures were
measured from each cardinal directions inside of the room, using the IR-300 infrared
thermometer (resolution 0.1°C, accuracy ±0.3°C: -55°C to 220°C).
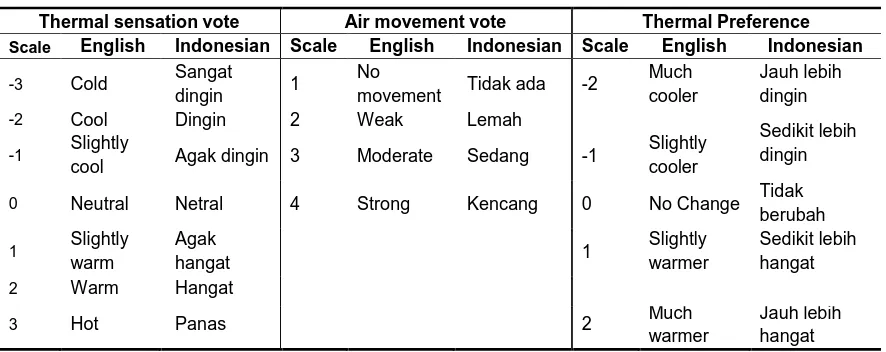
Thermal comfort survey
Personal parameters such as occupants’ clothing insulation value and thermal
perceptions were surveyed through questionnaires. Thermal Sensation Vote (TSV) in
this study uses the ASHRAE-55 seven point scale (ASHRAE, 2010), which was
translated to local language for each surveys in Indonesia, as shown in Table 2.
Another scale used in this study was the 4-point air movement vote and 5-point thermal
preference.
476 questionnaires were distributed to three groups of occupants in different office
spaces Bandung, and 400 responses were collected. There were 16, 20, and 18
subjects from offices B1, B2, and B3 respectively. Each respondent voted 6 to 10 times
throughout the study. Physical thermal environment parameters were measured during
three to five working days in each location. At the measured days, the questionnaires
were distributed every morning (10:00-11:00) and afternoon (14:00-15:00). Physical
data from each instrument during these hours was taken as an average value for each
Table 2 Scale and translation
Thermal sensation vote Air movement vote Thermal Preference
Scale English Indonesian Scale English Indonesian Scale English Indonesian
-3 Cold Sangat
dingin 1
No
movement Tidak ada -2
Much cooler
Jauh lebih dingin
-2 Cool Dingin 2 Weak Lemah
Sedikit lebih dingin
-1 Slightly
cool Agak dingin 3 Moderate Sedang -1
Slightly cooler
0 Neutral Netral 4 Strong Kencang 0 No Change Tidak
berubah
1 Slightly
warm
Agak
hangat 1
Slightly warmer
Sedikit lebih hangat
2 Warm Hangat
3 Hot Panas 2 Much
warmer
Jauh lebih hangat
Calculation of mean radiant and operative temperature
Mean radiant temperature (Tmrt) and operative temperature (Top) are derived from
air temperature (Ta), globe temperature (Tg), and air velocity (Va). This study uses the
globe thermometer method and calculates Tmrt using Equation (1) (ASHRAE, 2005).
(1)
refers to emissivity of the globe, taken as 0.95 for a black globe, and D
diameter of the globe which is 0.04 meter. Top is a combination of air temperature and
mean radiant temperature, a weighted average value of both to express their joint
effect. The weighting factors are radiative and convective heat transfer coefficients at the occupant’s clothed surface. At indoor condition when air speeds around 0.10 m/s,
Top is approximated with Equation (2) (Nicol et al., 2012).
(2)
Results
Physical parameters
The results from field survey were then compiled and the mean values from each
parameter were obtained, as seen on Table 3. The average outdoor temperature was
between 26.3°C (FR) and 28.7°C (MM). The lowest average temperature was in CL
mode, 25.5°C; while indoor air temperature in FR and MM were quite similar, 26.7°C
and 26.5°C accordingly. Globe temperatures were quite similar with air temperature in
all offices; only slightly higher than air temperature for CL and MM, while the average
globe temperature in FR was similar with air temperature. Relative humidity (RH) in CL
and MM were lower than total average, which is 56%, while in FR mode it is slightly
than 0.20 m/s, even in FR mode. Average clothing insulation was quite similar in all
office, with overall average of 0.57 clo.
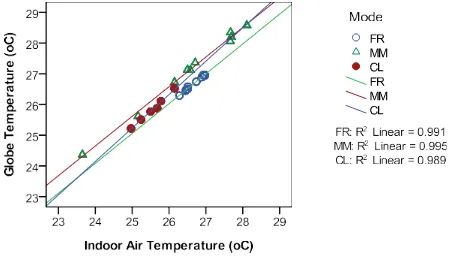
Air temperature was correlated with other temperature index, and they were all
have significantly high correlation values in all three modes, as seen on Table 4. The
scatter plot on Figure 1 showed that air temperature and globe temperature were
similar in FR, while in other modes globe temperature seems to be higher.
Table 3 Average value of objective and subjective evaluation
Mode Variable Tout (°C)
Ta
(°C)
Tg
(°C) RH (%)
Va
(m/s)
Icl
(clo) TSV TA TP AMV AMA
Mean 26.3 26.7 26.7 62 0.07 0.58 1.0 0.7 -0.3 1.8 0.5
FR N 159 159 159 159 159 159 159 158 159 159 158
S.D. 0.8 0.2 0.2 2 0.01 0.14 1.4 0.7 0.9 0.8 0.9
Mean 28.7 26.5 27.1 54 0.17 0.59 -0.1 0.7 -0.1 2.1 0.5
MM N 150 150 150 150 150 150 150 150 150 150 150
S.D. 1.6 1.3 1.3 4 0.03 0.15 1.3 0.7 0.8 0.7 0.8
Mean 27.6 25.5 25.8 47 0.14 0.52 -0.2 1.0 -0.1 2.2 0.9
CL N 91 91 91 91 91 91 91 91 91 91 91
S.D. 1.0 0.4 0.4 3 0.03 0.13 1.2 0.3 0.7 0.5 0.5
Mean 27.5 26.4 26.6 56 0.12 0.57 0.3 0.8 -0.2 2.0 0.6
Total N 400 400 400 400 400 400 400 399 400 400 399
SD 1.6 1.0 0.9 7 0.05 0.14 1.4 0.6 0.8 0.7 0.8
CL: Cooling, FR: Free-running, MM: Mixed-mode, Tout: Outdoor air temperature, Ta: Indoor air temperature, Tg: Globe
temperature, RH: Indoor relative humidity, Va: Air velocity, Icl: Clothing insulation value, TSV: Thermal sensation vote, TA:
Thermal acceptance, TP: Thermal Preference, AMV: Air movement vote, AMA: Air movement acceptance, N: Number of sample, S.D.: Standard deviation
Table 4 Correlation of Ta with Tg, Tmrt, and Top
Mode Items Ta: Tg Ta: Tmrt Ta: Top
FR r 1.00 0.98 1.00
N 159 159 159
MM r 1.00 0.98 1.00
n 150 150 150
CL r 1.00 0.98 0.99
N 91 91 91
CL: Cooling, FR: Free-running, MM: Mixed-mode, Ta: Indoor air temperature (°C), Tg: Globe temperature (°C), Tmrt: Mean
radiant temperature (°C), Top: Operative temperature (°C), r: Correlation coefficient, N: Number of sample. Note: all
correlation coefficients are significant (p<0.001)
Thermal sensation
The occupants were asked about both thermal sensation vote and thermal
preference. These two scales have to be corresponding between each other, then
comparison of results from both scale in this study as seen on Figure 2. It showed as
the occupants vote for warm sensation, they will prefer cooler condition, and vice versa.
Table 3 shows that average thermal sensation vote were in cool side of 7-point
ASHRAE scale for 2 buildings: -0.2 (S.D.=1.2) in CL and -0.1 (S.D.=0.8) in MM; while
FR mode average result was on warm side of the scale: 1.0 (S.D.=1.4). However, all
average results of TP scale were negative, which means occupants from all buildings
seems to prefer cooler condition in average.
100
80
60
40
20
0
-3 -2 -1 0 1 2 3
Thermal Sensation Vote (TSV)
Prefer cooler
Prefer warmer
Figure 2 Relation of TSV and TP scale for all modes
To clarify thermal comfort zone, TSV results from this study were analysed using Probit regression method (Finney, 1971) for each modes. It started with ordinal regression with Probit as the link function and globe temperature as covariate. The results from MM mode are shown in Table 6. Mean temperature in the table was calculated by dividing the constant by regression coefficient. Using the following function for each P, then plotting it into proportions, the area of each comfort votes of TSV are divided by curves in Figure 3.
Probability = CDF.NORMAL (quant, mean, S.D.) (3)
Where the “quant” is globe temperature (o
C); the mean and S.D. are given in Table 5.
Table 5 Equation of probit analysis using globe temperature on TSV
Equation* Mean
(oC) S.D. N R
2 SE
P(≤-3) = 0.574 Tg - 12.35 21.5 P(≤-2) = 0.574 Tg - 14.03 24.4 P(≤-1) = 0.574 Tg - 15.41 26.8
1.743 150 0.32 0.079
P(≤0) = 0.574 Tg - 16.40 28.6
P(≤1) = 0.574 Tg - 17.01 29.6
P(≤2) = 0.574 Tg - 17.50 30.5
P(≤-3) is the probit of proportion of the votes that are -3 and less, P(≤-2) is the probit of the proportion that are -2 and less, and
so on; S.D.: standard deviation of the cumulative normal distribution; N: number of sample; R2: Cox and Snell R2; S.E.: standard error of the regression coefficient; * regression coefficient is significant (p < 0.001).
Pe
rc
e
ntag
e
(
%
(a) (b)
Figure 3 Proportion of TSV or comfortable over globe temperatures in mixed mode (MM)
The highest line (blue triangle points) was defining area of probability for TSV -3
(cold) and TSV -2 (cool), and so on until the lowest line for TSV 3 (hot) based on
ASHRAE 7-scale. Using TSV -1, 0, and 1 as represents of comfortable, the Probits
was transformed into proportions, a bell-curve of Figure 3b. The proportion of people
comfortable at the optimum is high, a bit over 80%. The temperature range which over
80% are comfortable is around 26 to 28 °C.
Comfort temperature
The climatic data range results of field survey were quite narrow, so it would be
unreliable to use the regression method for calculating comfort temperature. Therefore this study will use Griffiths’ method to calculate comfort temperature based on TSV
(Griffiths, 1990; Nicol et al., 2012; Humphreys et al., 2013; Damiati et al., 2015)
Here Tci indicates comfort temperature (oC), based on Ta which is indoor air
temperature (oC). C is thermal sensation vote on a scale where 0 is neutral condition.
indicates the constant rate of thermal sensation change with room temperature. In
this case 0.5 is used as the constant, as applied by Humphreys et al. (2013) at 7-point
thermal sensation scale.
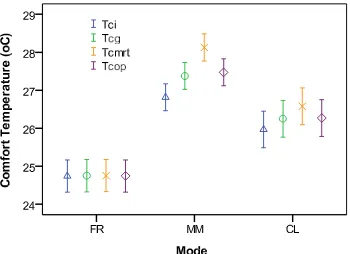
From this equation, comfort temperatures were obtained for each modes in 4
thermal index: Ta, Tg, Tmrt and Top. Figure 4 showed that the 4 temperature index has
similar results in FR mode. CL and MM has similar pattern with comfort air temperature
as the lowest value, comfort mean radiant temperature slightly higher, while globe and
mean radiant temperature were quite similar to each other, a middle value of the other two indexes. Each average temperature of occupants’ comfortable state for each scale
we use in questionnaire were also analysed, as seen on Table 6.
The results corresponded quite well with Griffith’s method, where comfort air
temperatures were 26.0°C, 24.7°C, and 26.8°C for CL, FR, and MM.
Figure 4 Comfort temperature in FR, MM, and CL ventilation modes
Table 6 Griffith's comfort temperatures and mean temperature for the given votes
Mode Variable Griffith’s method
TSV = 0 TP = 0
OC = 5 or 6
n Mean S.D. n Mean S.D. N Mean S.D. n Mean S.D.
Ta 159 24.7 2.7 42 26.7 0.2 65 26.7 0.2 87 26.7 0.2
FR Tg 159 24.8 2.7 42 26.7 0.2 65 26.7 0.2 87 26.7 0.2
Tmrt 159 24.8 2.7 42 26.7 0.2 65 26.7 0.2 87 26.7 0.2
Top 159 24.7 2.7 42 26.7 0.2 65 26.7 0.2 87 26.7 0.2
Ta 150 26.8 2.2 45 26.7 1.2 71 26.4 1.4 105 26.6 1.3
MM Tg 150 27.4 2.2 45 27.3 1.2 71 26.9 1.3 105 27.1 1.2
Tmrt 150 28.1 2.2 45 28.0 1.1 71 27.7 1.3 105 27.9 1.2
Top 150 27.5 2.2 45 27.4 1.2 71 27.0 1.3 105 27.2 1.2
Ta 91 26.0 2.3 35 25.5 0.4 60 25.5 0.4 81 25.6 0.4
CL Tg 91 26.2 2.3 35 25.8 0.4 60 25.8 0.4 81 25.8 0.4
Tmrt 91 26.6 2.3 35 26.1 0.5 60 26.2 0.5 81 26.2 0.5
Top 91 26.3 2.3 35 25.8 0.4 60 25.8 0.5 81 25.9 0.5
CL: Cooling, FR: Free-running, MM: Mixed-mode, Ta: Indoor air temperature (°C), Tg: Globe temperature (°C),
Tmrt: Mean radiant temperature (°C), Top: Operative temperature (°C), TSV: Thermal sensation vote, TP: Thermal
preference, OC: Overall comfort, N: Number of sample, S.D.: Standard deviation.
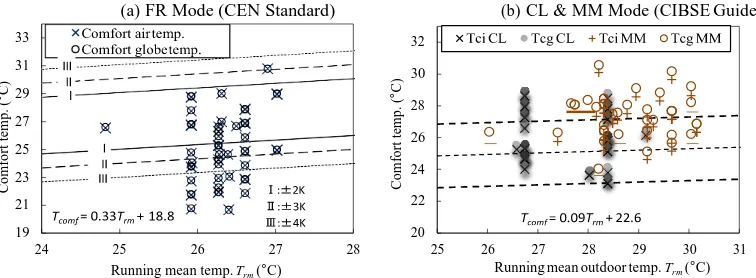
Comparison to related standards
Since the field measurements of this study were conducted daily, the results of FR
mode were compared with Equation (5) from CEN EN15251 which predicts comfort
temperature zones in free-running mode based on daily running mean temperature
(CEN, 2007).
(5)
Where is comfort temperature (oC), and is daily running mean
temperature (oC). The comfort air temperature and comfort globe temperature in this
study was plotted based on mean outdoor temperature during field measurement
hours. As seen on Figure 6a, the results of FR mode fell mostly within the comfort
I
(a)FR Mode (CEN Standard)
33 31 29 27 25 23 21 19
24 25 26 27 28
Running mean temp. Trm (°C)
(b)CL & MM Mode (CIBSE Guide)
32 30 28 26 24 22 20
25 26 27 28 29 30 31
Running mean outdoor temp. Trm (°C)
Figure 5 Comparison with the adaptive model
Meanwhile there is no international adaptive standards to define comfort
temperature zones in mechanically cooled buildings, because outdoor air infiltrations
are assumed to be minimized. There is still a correlation found between outdoor and
indoor air temperature in HVAC buildings, although not as significant as in free-running
modes. Therefore comfort zones for CL and MM mode were plotted using Equation (6)
from the CIBSE guidelines, specified for cooled buildings (Humphreys & Nicol, 2006).
(6)
On Fig. 6b, equation (6) was plotted in dotted lines, along with upper and lower
limits which were using ±2K from the original equation. The results from this study fell
within and above the CIBSE comfort zone. Some of higher comfort temperature
compared to the guidelines might be caused by regional differences, since CIBSE was
developed on European countries database.
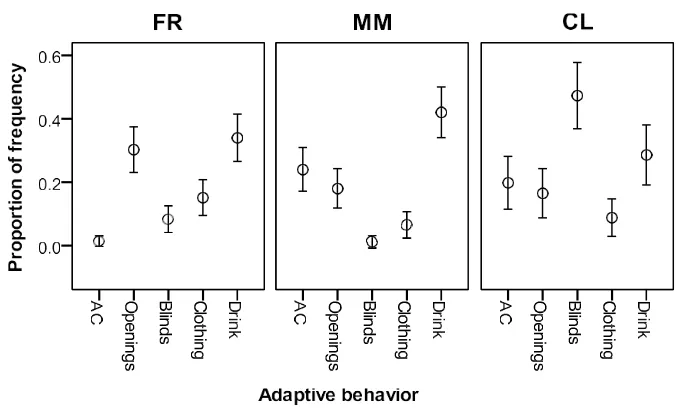
Adaptive behavior
Based on direct observation and questionnaire results on Figure 5, the occupants
tend to adapt in thermal environment condition mainly by using window blinds in CL
mode. This might be affected by the all glass curtain walls façade. While in FR mode,
most occupants adapt by drinking beverages and opening windows or doors. In MM
mode, most occupants also adapt by drinking water; another option was using AC and
Figure 6 Occupants' adaptive behaviour in FR, MM, and CL ventilation modes
Discussions
The results from this study in CL mode is slightly higher than previous studies,
where comfort temperature was estimated at 24.2°C for air-conditioned mode in
Singapore (de Dear et al., 1991). FR mode has quite low comfort temperature
compared to previous study by Rijal et al. (2015) where comfort temperature in
free-running buildings during summer in Kanto region of Japan was 26.8°C (Rijal et al.,
2015). Meanwhile MM corresponds with another study in Malaysia by Daghigh et al. (2009) where comfort temperature was estimated 26.6–27.6°C for air conditioned
mode with window-opening arrangements. This might be an additional evidence of
overcooling issue in mechanically cooled buildings, especially in tropical climate
regions.
Conclusions
The field study in three ventilation modes of office buildings in Bandung leads to
these conclusions:
Using Griffith’s method, the operative comfort temperature in the offices are 24.7
oC (S.D.=2.7 oC), 26.3 oC (S.D.=2.3 oC), and 27.5 oC (S.D.=2.2 oC) for FR, CL, and
MM accordingly.
Some adaptation method which most of occupants used to maintain their thermal
comfort in investigated buildings were operating window blinds (CL mode),
drinking beverages, opening windows or doors, and using AC (in CL and MM
mode).
Compared to related standards, the comfort temperatures in MM and CL were a bit higher than CIBSE guide; while in FR mode most of the results are within the
Acknowledgements
We would like to thank all people who participated in the survey, also
management staffs of CIMB Niaga and ITB. First author developed this paper during
the stay at Tokyo City University as a researcher, on attachment program funded by
JAIF. This research was financially supported by Grant-in-Aid from AUN/SEED Net
Collaborative Research Program (4B155) from JICA.
References
ASHRAE. (2005). ASHRAE Handbook: fundamentals (SI). Atlanta, GA: American Society of Heating, Refrigerating and Air-Conditioning Engineers, Inc.
ASHRAE. (2010). ANSI/ASHRAE Standard 55-2010. Atlanta, Atlanta: American Society of Heating, Refrigerating and Air-Conditioning Engineers, Inc.
Bureau of Statistics. (2003). Bandung Dalam Angka (Bandung in Numbers).
CEN. (2007). Indoor Environmental Input Parameters for Design and Assesment of Energy Performance of Buildings: Addressing indoor air quality, thermal environment, lighting,
and acoustics. Standard EN15251. Brussels: Comite European de Normalisation. Cena, K., & de Dear, R. (2001). Thermal comfort and behavioural strategies in office buildings
located in a hot-arid climate. Journal of Thermal Biology, 26(4-5), 409–414.
Damiati, S. A., Zaki, S. A., Wonorahardjo, S., Wong, N. H., & Rijal, H. B. (2015). Comfort Temperature in Air Conditioned Office Buildings: Case Study of Indonesia And Singapore. In Malaysia-Japan Joint International Conference 2015 (MJJIC2015). Ube, Yamaguchi. de Dear, R. J., Leow, K. G., & Foo, S. C. (1991). Thermal comfort in the humid tropics: Field
experiments in air conditioned and naturally ventilated buildings in Singapore. International Journal of Biometeorology, 34, 259–265.
De Meester, T., Marique, A. F., De Herde, A., & Reiter, S. (2013). Impacts of occupant behaviours on residential heating consumption for detached houses in a temperate climate in the northern part of Europe. Energy and Buildings, 57, 313–323.
Finney, D. J. (1971). Probit Analysis. Cambridge, UK: Cambridge University Press.
Griffiths, I. (1990). Thermal comfort in buildings with passive solar features: Field studies. Report to the Commission of the European Communities, EN3S-090.
Hiller, C. (2012). Influence of residents on energy use in 57 Swedish houses measured during four winter days. Energy and Buildings, 54, 376–385.
Humphreys, M. A., & Nicol, J. F. (2006). Chapter 1, Environmental Criteria for Design. In Environmental Design: CIBSE Guide A. London, UK: CIBSE.
Humphreys, M. A., Rijal, H. B., & Nicol, J. F. (2013). Updating the adaptive relation between climate and comfort indoors; new insights and an extended database. Building and Environment, 63, 40–55.
controls and hindrances. Renewable Energy, 36(4), 1182–1189.
Nicol, F., Humphreys, M. A., & Roaf, S. (2012). Adaptive thermal comfort : principles and practice. London ; New York: Routledge.
Rijal, H., Humphreys, M., & Nicol, F. (2015). Adaptive Thermal Comfort in Japanese Houses during the Summer Season: Behavioral Adaptation and the Effect of Humidity. Buildings, 5(3), 1037–1054.
Tanner, R. A., & Henze, G. P. (2014). Stochastic control optimization for a mixed mode building considering occupant window opening behaviour. Journal of Building Performance Simulation, 7(6), 427–444.
Vecchi, R. De, Sorgato, M. J., Pacheco, M., & Cândido, C. (2014). Application of the adaptive model proposed by ASHRAE 55 in the Brazilian climate context : raising some issues, 15251(April), 10–13.
Yang, W., Wong, N. H., & Jusuf, S. K. (2013). Thermal comfort in outdoor urban spaces in Singapore. Building and Environment, 59, 426–435.