J58890UC L107 PG-5E677
585-229-808, Issue 1 November 1998
DEFINITY
Performance Management
Release 2.0
November 1998 Page 2
0
Contents
About This Book 8
Introduction 9
User Document Set 10
DEFINITY Performance Management User Guide 11
Audience 12
Format Conventions 13
Lucent Resources 17
Project Provisioning Package 17
Technical Support Center (TSC) 18
NetCare Network Consulting Group 19
Year 2000 Compliance 20
1 NMS Overview 21
Introduction 22
System Requirements 24
NMS Capabilities 26
NMS Command Procedures 27
Access the NMS 28
November 1998 Page 3
2 NMS Submap Administration 33
Introduction 34
Set Auto-Discovery Passwords 36
Set up Auto-Discovery 38
Select Network Submap 40
Generic Submap 42
USA Submap 43
Custom Submap 45
Connections 47
View Types of Connections 48
Identify Connection Status 50
View the Status of a Connection 53
Verify Static Connection Status 56
Modify NMS Submaps 61
3 NMS Alerts 62
Introduction 63
Identify NMS Alerts 64
November 1998 Page 4
4 Performance Management Overview 74
Introduction 75
System Requirements 77
Supported Products 78
Access Performance Management 79
Exit Performance Management 81
5 Basic Screen Components 82
Introduction 83
Screen Components 84
Main Window 88
About Panes 90
Menu bar 92
Nodes 94
Alert Indicators 95
Managed Nodes 97
Command Buttons 97
Status Bar 98
November 1998 Page 5
6 Specify Collection Parameters 99
Introduction 100
Specify Default Data Collection Hours 101
Specify Collection Hours for a Specific Managed Node 104
Specify Default Data Types 107
Specify Data Types for a Specific Managed Node 109
Specify Default Data Storage Duration 112
Specify Data Storage Duration for a Specific Managed
Node 115
7 Administer Reports 118
Introduction 119
Getting Started 120
Create a New Report 124
Define Data Fields 126
Options from a Displayed Report 131
Print a Report 134
Select Managed Nodes 139
Create and Modify a Trunk Group List 143
Specify Report Interval 147
November 1998 Page 6
Set up Report in Table Format 154
Set up Report in Chart Format 157
Define Destination of Report Output 163
Run a Report 167
Display Report Output 170
View a Report on a Browser 173
8 Event Log 177
Introduction 178
Using the Event Log 180
Resolve an Event 185
9 Set Alerting Parameters 186
Introduction 187
About Alert Levels 188
Set Global Alerting Parameters 190
November 1998 Page 7
10 Maintenance and Error Recovery 201
Introduction 202
Error Recovery 203
System Notification of Errors 205
Process Trace 206
Event Types Exception and Error 207
Message Type SWERR 208
Delete Managed Node from Database 209
November 1998 Page 8
0
About This Book
Chapter Contents
• Introduction 9
• User Document Set 10
– DEFINITY Performance Management User Guide 11 – Audience 12
– Format Conventions 13 • Lucent Resources 17
About This Book Introduction
November 1998 Page 9
Introduction
This chapter contains helpful information about the documentation and the Lucent resources available to customers for the DEFINITY Network Management
Release 2.0 products, which include:
• DEFINITY Proxy Agent • DEFINITY Fault Management
• DEFINITY Performance Management
• DEFINITY Network Management Common Software
The User Document Set sectioncontains the complete list of installation guides and user guides that are delivered on CD-ROM. This section also includes an overview of this book, the target audience for this book, and the format conventions used in the procedures.
The Lucent Resources section includes essential information about the Project Provisioning Package which contains:
• System requirements for hardware and software • Ordering information
• Installation options • Custom services
• Lucent and customer responsibilities
About This Book User Document Set
November 1998 Page 10
User Document Set
The User Document Set for Release 2.0 is delivered on a separate CD-ROM. The CD-ROM contains all the installation and user guides for the DEFINITY
Network Management Release 2.0 products, including:
• DEFINITY Proxy Agent Installation Guide • DEFINITY Proxy Agent User Guide
• DEFINITY Fault Management Installation Guide • DEFINITY Fault Management User Guide
• DEFINITY Performance Management and Common Software Installation Guide
• DEFINITY Performance Management User Guide
The installation guides for the products specifically cover the procedures to install and set up the software so that the product is ready to use. Generally, only an experienced network manager should install and set up the software.
The user guides for the products describe the functions, screen, and procedures to operate and manage the software. Once the software is set up, then users should refer to the user guides to operate and administer the product.
Installation procedures
The insert on the CD-ROM contains the procedures to install the guides. The
About This Book
DEFINITY Performance Management User Guide
November 1998 Page 11
Main Menu After you install the guides, you can access the books from the Main Menu. The Introduction section on the Main Menu contains procedures for navigating between the books and searching for specific information.
The Comments section contains an evaluation form. You are encouraged to submit the form with your suggestions for improvement and comments on the useful elements of the documentation.
DEFINITY Performance Management User Guide
The DEFINITY Performance Management User Guide Release 2.0 contains the explanation and procedures to manage the day-to-day operations of the software and related external devices.
The user guide is divided into two sections:
• Section 1 Network Management Systems (NMS) includes chapters 1 through 3. For an overview of the chapters, refer to Chapter 1, "NMS Overview".
About This Book Audience
November 1998 Page 12
The chapters in the NMS overview are laid out by functions and are organized by the primary tasks to operate the software, including:
• Login and access procedures • System help and navigation features
• Administration procedures to add, change, and delete data
• Operational procedures to manage the software features and functions The user guide is an essential resource for users who are unfamiliar with the purpose and operation of the product.
Audience
The user guide is particularly helpful to those that use Performance Management as part of their routine duties. The guide is also intended for:
Customers, including: • Network managers • System administrators • Technicians
Lucent personnel, including:
• Service providers and technicians • Sales teams
About This Book Format Conventions
November 1998 Page 13
Format Conventions
The format conventions used in this book are visual cues to help users identify the type of action they should take to execute the steps in the procedures.
The use of the format conventions are consistent throughout all the books in the
User Document Set for this release. Table 1. Format Conventions
Convention Description
Bold text Indicates that you should type the bold text exactly as shown.
Example: Type display status
About This Book Format Conventions
November 1998 Page 14
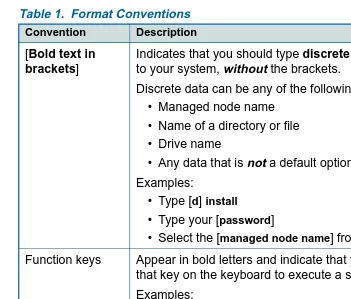
[Bold text in
brackets]
Indicates that you should type discrete data that is specific to your system, without the brackets.
Discrete data can be any of the following: • Managed node name
• Name of a directory or file • Drive name
• Any data that is not a default option Examples:
• Type [d] install
• Type your [password]
• Select the [managed node name] from the Help list. Function keys Appear in bold letters and indicate that you should press
that key on the keyboard to execute a specific action. Examples:
• Press Enter (also refers to the Return key) • Press Tab
• Press Esc Table 1. Format Conventions
Convention Description
About This Book Format Conventions
November 1998 Page 15
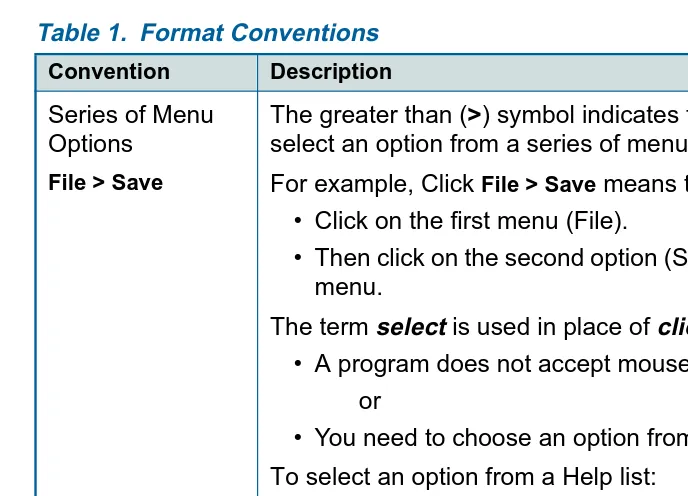
Series of Menu Options
File > Save
The greater than (>) symbol indicates that your should select an option from a series of menus.
For example, Click File > Save means that you should: • Click on the first menu (File).
• Then click on the second option (Save) from the second menu.
The term select is used in place of click if: • A program does not accept mouse commands.
or
• You need to choose an option from a Help list. To select an option from a Help list:
• Use the arrow keys or TAB key to move the cursor to the option on the list.
• Then press ENTER to select the option. Table 1. Format Conventions
Convention Description
About This Book Format Conventions
November 1998 Page 16
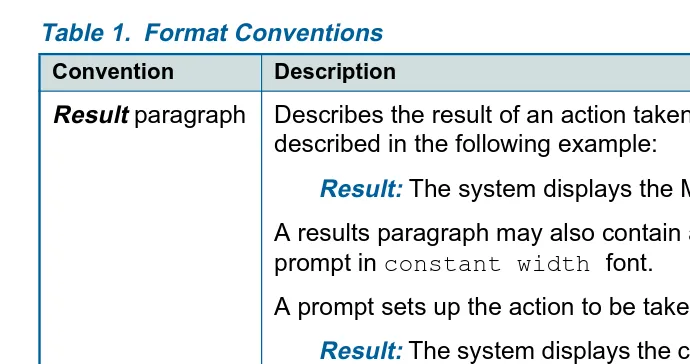
Result paragraph Describes the result of an action taken in a step, as described in the following example:
Result: The system displays the MAIN MENU. A results paragraph may also contain a message or a prompt in constant width font.
A prompt sets up the action to be taken in the next step. Result: The system displays the command window that
contains the prompt: Do you wish to continue? y/n
Table 1. Format Conventions
Convention Description
About This Book Lucent Resources
November 1998 Page 17
Lucent Resources
Lucent Technologies provides customers with a variety of planning, consulting, and technical services.
The account executives are the customers’ primary source to obtain information and explore custom options to meet the customers’ specific business needs. The sections below briefly describe the services that are available to customers.
Project Provisioning Package
The Project Provisioning Package for this release contains the specific recommendations and specifications to plan and install the DEFINITY Network Management products.
A copy of the Project Provisioning Package is posted on the DEFINITY Solutions website. You can access the website at:
http://www.bcs.lucent.com/sales_market/definity/sysmgmt/dfm.htm
Customers can also request a copy of the package from their account executive. The package is intended to clarify the responsibilities of the customer and Lucent during the installation project. The package contains the following information:
• Installation options (see below) • Connectivity diagrams
• Ordering information
About This Book
Technical Support Center (TSC)
November 1998 Page 18
• Installation schedule and responsibilities • Platform acceptance test
• Post installation verification and acceptance
The Provisioning Package also contains detailed explanations of the three (3) implementation options that are available to customers:
1 Customer installation of the NMS platform and DEFINITY Network Management products.
2 Lucent Technologies Technical Support Center (TSC) installation of the DEFINITY Network Management products.
3 Lucent Technologies NetCare® Network Consulting Group installation of a complete turn-key system for the Network Management System (NMS). Options two and three are further explained in the sections below.
Technical Support Center (TSC)
The Technical Support Center (TSC) is part of the Technical Support Organization (TSO).
You can call the Technical Support Organization (TSO) at the toll-free number below and follow the prompts to reach the TSC:
TSO 1-800-242-2121
About This Book
NetCare Network Consulting Group
November 1998 Page 19
Both the customer and TSC perform the Post Installation Verification and Acceptance Test of Performance Management.
Time and materials charges
If customers choose to install the DEFINITY Network Management products themselves, then the TSC is not responsible for the installation of the product software.
If the customers do not install and set up the system according to the guidelines in the Project Provisioning Package, then the TSC will bill the customers for support on a time and materials basis.
NetCare Network Consulting Group
The NetCare® Network Consulting Group is part of the Professional Services Organization. NetCare is available to work with customers to design and build a turn-key Network Management System.
Customers can select all or any combination of the NetCare services summarized below:
• Plan and design a custom network system
• Purchase and configure the Network Management System (NMS)
• Install and integrate the DEFINITY Network Management software products on the NMS platform
About This Book
Year 2000 Compliance
November 1998 Page 20
Year 2000 Compliance
The Business Communication System (BSC) part of Lucent Technologies makes the following statement with respect to any product manufactured and sold by Lucent BCS in connection with a product’s operation in the year 2000.
Any product or version/release of a product that is introduced as generally available on or after September 30, 1996, will be year 2000 compliant or Lucent BSC will make it year 2000 compliant at our cost.
Any other product, depending on the specific product and its release or version, will fit into one of the following categories:
• The product is year 2000 compliant.
• If the product is not year 2000 compliant, Lucent BCS will provide an upgrade path to a generally available release that is year 2000 compliant at a
reasonable cost to the customer.
• If the product is not year 2000 compliant, and no upgrade path to a generally available release that is year 2000 compliant is available, Lucent BCS will evaluate whether there are potential modifications to the product that will make it year 2000 compliant, and if Lucent BCS determines that such modifications are economically practical, Lucent BCS will offer such modifications to the customer at a reasonable cost.
November 1998 Page 21
1
1NMS Overview
Chapter Contents
• Introduction 22• System Requirements 24 • NMS Capabilities 26
• NMS Command Procedures 27 • Access the NMS 28
1 NMS Overview
Introduction
November 1998 Page 22
Introduction
The Network Management System (NMS), and the DEFINITY Proxy Agent, along with DEFINITY Performance Management, facilitate centralized management of DEFINITY systems. To maintain this centralized management, Performance Management complies with Simple Network Management Protocol (SNMP). While the DEFINITY Proxy Agent is SNMP compliant, it operates remotely and connects to multiple managed nodes concurrently.
SNMP Information Exchange
SNMP specifications define how Performance Management and DEFINITY systems exchange information. The information exchange works like this:
1 Proxy Agents receives a call to request data.
2 Proxy Agents receive data from managed nodes.
3 Proxy Agents manage the information with a Management Information Base (MIB).
4 Proxy Agents use SNMP protocol to translate the information into data that the NMS can read.
5 Proxy Agents forward alert and threshold data to the NMS.
1 NMS Overview
Introduction
November 1998 Page 23
NMS Submaps On these maps, the NMS creates icons that represent managed nodes and Proxy Agents and also creates lines to represent connections between each Proxy Agent and its associated managed nodes. The NMS has the capability to produce three different submap options to depict a DEFINITY system. This allows you to organize managed nodes by geographic location or in a customized fashion as well as with one all-encompassing, generic map.
The icons on these submaps change colors to identify alarm states for Proxy Agents and alerts for managed nodes. The lines change colors to indicate changes in the connection states between Proxy Agents and their associated managed nodes.
ThIs chapter contains the following information: • Descriptions of NMS capabilities
• Commands used to access information in the NMS • Steps to access the NMS
1 NMS Overview
System Requirements
November 1998 Page 24
System Requirements
Introduction The Project Provisioning Package for this release contains the specific
recommendations and specifications to plan and install the Performance Management software.
The package also defines the terms and conditions for the three installation options:
• Customer installation
• Technical Support Center (TSC) installation services
• NetCare® Network Consulting Group installation of a complete turn-key
system
Refer to "Lucent Resources" on page 17 for more information.
Hardware Requirements
You should work with your Lucent account executive to determine the hardware requirements that your organization needs to meet its business and performance specifications.
Software Requirements
The DEFINITY Performance Management application operates with the following software:
• DEFINITY Proxy Agent, Release 2.0
1 NMS Overview
System Requirements
November 1998 Page 25
Supported Systems
Release 2.0 of Performance Management only supports DEFINITY G3 PBX releases G3V4 through DEFINITY ECS release R6
Network Management Products
The DEFINITY Performance Management 2.0 product only supports the network management products listed below:
• DEFINITY Proxy Agent 2.0 • DEFINITY Fault Management 2.0
NMS Platforms The DEFINITY Performance Management 2.0 product supports the following Network Management System (NMS) platform:
1 NMS Overview
NMS Capabilities
November 1998 Page 26
NMS Capabilities
Introduction The Network Management System (NMS) provides an overall view of DEFINITY systems. The NMS platform that Performance Management uses is OpenView. This section contains brief descriptions of the chapters that discuss NMS capabilities.
NMS Submap Administration
Chapter 2, "NMS Submap Administration" describes the 3 submap options available on the NMS. This chapter also contains procedures that are necessary to set up maps on the NMS.
NMS Alert Notification
Chapter 3, "NMS Alerts" describes Proxy Agent alarm states and managed node alert states. This chapter also identifies alert notification methods available at the NMS level and contains procedures that are necessary to access alert
1 NMS Overview
NMS Command Procedures
November 1998 Page 27
NMS Command Procedures
Introduction Each icon or connection line on an NMS submap provides access to information about managed nodes or connections. In addition, each icon provides access to one of the following applications:
• Proxy Agent
1 NMS Overview
Access the NMS
November 1998 Page 28
Access the NMS
To access the NMS, do the following:
1 Log in to NMS.
2 At a UNIX editor prompt, type $OV_BIN/ovw& and press Enter. Result: The system opens the NMS application
3 Double-click a DEFINITY icon.
1 NMS Overview
Screen Components
November 1998 Page 29
Screen Components
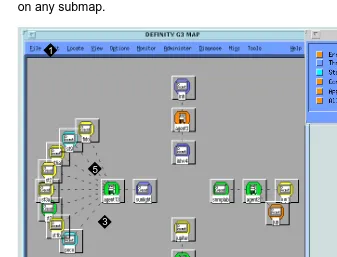
The following example is a generic submap with screen components that display on any submap.
Figure 1. DEFINITY Generic Submap
1 Platform-specific Menu Bar 2 Application Alert Event Log 3 Proxy Agent Icon
4 Managed Node Icon 5 Connection Line
1
3
4 5
1 NMS Overview
Screen Components
November 1998 Page 30
Menu Bar To access submenus for DEFINITY equipment, click a DEFINITY managed node icon. Then, click Performance > DEFINITY
Result: The system displays the DEFINITY submenu.
The selections that are available on this submenu vary based upon the graphical element you selected. Items that are not available display in grey.
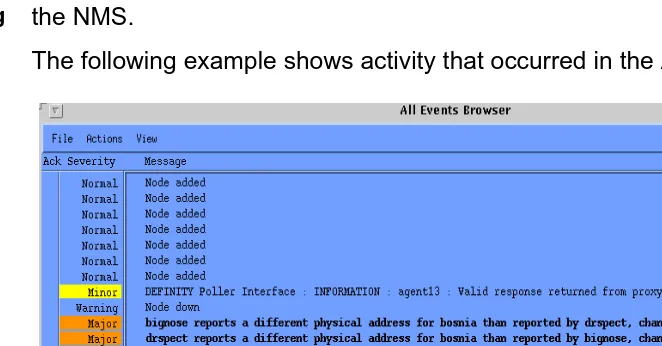
Application Alert Event Log
The Application Alert Event Log contains a running record of actions that occur on the NMS.
The following example shows activity that occurred in the All Events category.
1 NMS Overview
Screen Components
November 1998 Page 31
Proxy Agent Icon
When you select a Proxy Agent Icon, DEFINITY submenu options reflect commands that are available for that Proxy Agent. You can also double-click the Proxy Agent icon to initiate a telnet session to the Proxy Agent application. You can also select the Proxy Agent Icon. Then, press the third mouse button to display a menu that contains commands available for the Proxy Agent.
Managed Node Icon
When you select a managed node Icon, DEFINITY submenu options reflect commands that are available for that managed node. You may also double-click a managed node icon to start the Performance Management application.
You can also select a managed node icon. Then, press the third mouse button to display a menu that contains commands available for the DEFINITY managed node.
Connection Line
When you select a connection line, the DEFINITY submenu options reflect commands that are available for that connection. You may also double-click the connection line to display the Connection Status screen.
1 NMS Overview
Exit from the NMS
November 1998 Page 32
Exit from the NMS
To exit from the NMS, complete the following steps:
1 Close all programs associated with the NMS.
2 At the main window, click Map > Exit.
November 1998 Page 33
2
2NMS Submap Administration
Chapter Contents
• Introduction 34• Set Auto-Discovery Passwords 36 • Set up Auto-Discovery 38
• Select Network Submap 40 • Connections 47
2 NMS Submap Administration
Introduction
November 1998 Page 34
Introduction
The Network Management System (NMS) provides graphical user interface (GUI) capabilities that allow you to view alarms for Proxy Agents and alerts for managed nodes. You can view the connection status between Proxy Agents and their associated managed nodes.
The NMS creates three network submaps to display this information. These submaps include:
• Generic • USA • Custom
This chapter contains the following NMS submap procedures: • Select Submap options
• Modify submap information on the Proxy Agent
2 NMS Submap Administration
Introduction
November 1998 Page 35
Auto-Discovery Using the Auto-Discovery feature, the NMS performs the following functions to translate data from the Proxy Agent into these submaps:
• Searches for Proxy Agent and managed node data
• Adds Proxy Agent icons and managed node icons to designated DEFINITY submaps
• Shows connections between Proxy Agents and managed nodes
2 NMS Submap Administration
Set Auto-Discovery Passwords
November 1998 Page 36
Set Auto-Discovery Passwords
The default installation setting for Fault Management grants access to Auto-Discovery for all users. Users who have access to Auto-Discovery can modify NMS read/write submaps.
If you wish to restrict Auto-Discovery access, you must assign Auto-Discovery passwords. Anyone who has root level access can restrict individual or group access to Auto-Discovery.
Procedure To set auto-discovery passwords, do the following:
1 To administer Auto-Discovery passwords, type the following and press
Return:
/opt/OV/OneVision/DG3Poll/AD_Passwds
Result: The system displays the Auto-Discovery passwords administration file.
2 In the first field, type one of the following options in upper case and press the
Spacebar:
• L for an individual user • G for groups of users
3 In the second field, type one of the following in lower case and press Return: • individual [unixlogin id]
• group [unix group id]
2 NMS Submap Administration
Set Auto-Discovery Passwords
November 1998 Page 37
!
SECURITY ALERT:
2 NMS Submap Administration
Set up Auto-Discovery
November 1998 Page 38
Set up Auto-Discovery
To set up NMS submaps, you must activate Auto-Discovery. Activating Auto-Discovery allows the NMS to create submaps from information that was transmitted from Proxy Agents.
Setting up Auto-Discovery on a public network differs from the process of setting up Auto-Discovery on a private network. This section contains procedures for both network types.
Public Networks
If you have a public network, perform the following procedure to set up Auto-Discovery. This procedure activates Auto-Discovery for the first time and during any active, network session.
To activate Auto-Discovery, click Performance > DEFINITY > Execute Auto-Discovery
2 NMS Submap Administration
Set up Auto-Discovery
November 1998 Page 39
Private Networks
If you have a private network, you must complete the following steps to ensure that the Proxy Agent and NMS can communicate effectively. The entries you type in the NMS must exactly match the entries that you typed in the Proxy Agent.
1 From the menu bar in the Network Management System, click Options > SNMP Configuration.
Result: The system opens the SNMP Configuration window. Existing managed nodes appear at the top portion of the screen.
2 Turn off the USE PROXY TO ACCESS TARGET button, if it is selected.
3 Type information in the fields below. Do not change any other fields.
• Target — Proxy Agent [host name or IP address] The name that resides in the host file.
• Community — [communityname] The name you administered for the private network on the Proxy Agent Change Network Managers Screen. • Set Community — [g3pa] Identical to the Set Community data
administered on the Proxy Agent Change Network Managers Screen.
4 Click ADD. Then, click OK.
5 To activate Auto-Discovery, click Performance > DEFINITY > Execute Auto-Discovery
2 NMS Submap Administration
Select Network Submap
November 1998 Page 40
Select Network Submap
The NMS provides three submap options that allow you to organize your DEFINITY system in three different ways. You can organize your DEFINITY systems in the following ways:
Note: For information on modifying submaps and the Location File, go to "Modify NMS Submaps" on page 61.
NMS Submap Options
• Generic submap. The Generic submap is the system default. This submap provides point-to-point connections and displays an overview of your DEFINITY system.
• USA submap. The USA submap allows you to organize your DEFINITY system by geographic location in the United States. The USA submap allows you to drill down to state submaps.
• Custom submap. The custom submap allows you to organize your DEFINITY system according to your specific business needs. The Custom submap allows you to place icons on a user-specified submap.
This section provides the following information about submaps: • Advantages for using each submap
2 NMS Submap Administration
Select Network Submap
November 1998 Page 41
Root Level Icons
The system displays the Root map when you log in to the NMS. Icons
representing NMS submaps display on this screen. The example below shows DEFINITY submap icons that appear on the Root map.
2 NMS Submap Administration
Generic Submap
November 1998 Page 42
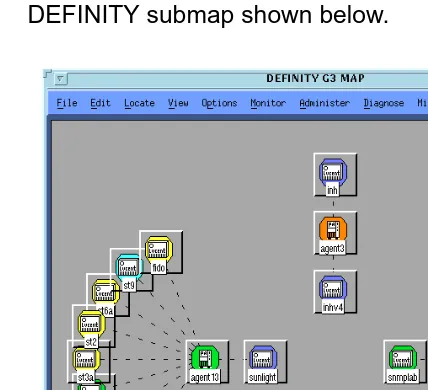
Generic Submap
The generic submap uses a point-to-point layout to display an overview of all Proxy Agents and their associated managed nodes. The generic submap icon resides on the open map and at the root level of the NMS.
You double-click the DEFINITY generic submap icon on the Root map to open the DEFINITY submap shown below.
2 NMS Submap Administration
USA Submap
November 1998 Page 43
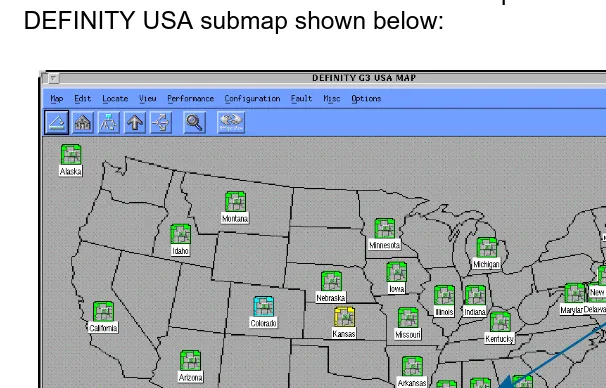
USA Submap
The USA submap allows you to view your DEFINITY system by geographic location. Managed nodes and Proxy Agent objects appear on the state that you administered in the Proxy Agent.
You double-click the DEFINITY USA submap icon on the Root map to open the DEFINITY USA submap shown below:
Figure 5. Example of a DEFINITY USA submap
2 NMS Submap Administration
USA Submap
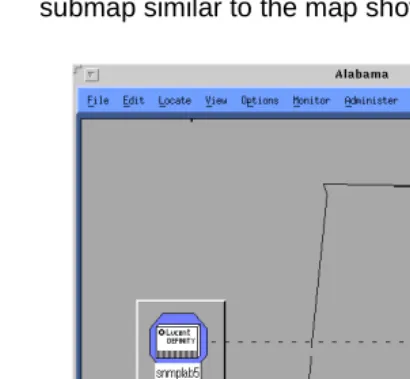
November 1998 Page 44
State submap You double-click a managed node icon on a USA submap to display a state submap similar to the map shown below.
2 NMS Submap Administration
Custom Submap
November 1998 Page 45
Custom Submap
Custom submaps allow you to manage the DEFINITY system at a more specific level than the other submaps. For example, you can organize information according to business territories or according to the type of DEFINITY systems that you manage.
2 NMS Submap Administration
Custom Submap
November 1998 Page 46
2 NMS Submap Administration
Connections
November 1998 Page 47
Connections
Introduction The NMS allows you to view two types of connections and to view the status of each connection. The two types of connections that you can administer are: static or dynamic. The status of each of these connections reflects the activity of that connection.
From the NMS, you can connect managed nodes to Proxy Agents, disconnect managed nodes from Proxy Agents, and verify the status of a connection. This section contains:
• Graphical depictions of connections as they appear on network submaps • Descriptions that contrast the differences between static and dynamic
connections
2 NMS Submap Administration
View Types of Connections
November 1998 Page 48
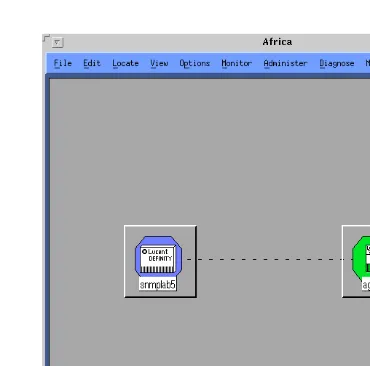
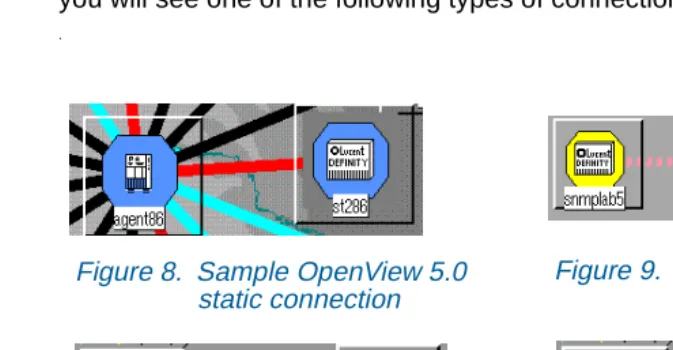
View Types of Connections
To view connection types, you must go to a DEFINITY submap. At the submap, you will see one of the following types of connections:
.
Connection types
The Proxy Agent now supports both static and dynamic connections to managed nodes.
You can assign up to 150 dynamic connections on the MANAGED NODES screen. The Proxy Agent only supports 30 active connections at a given time. The 30 active connections can be a combination of static and dynamic connections.
Figure 8. Sample OpenView 5.0 static connection
Figure 9. Sample OpenView 5.0 dynamic connection
Figure 10. Sample OpenView 4.11
2 NMS Submap Administration
View Types of Connections
November 1998 Page 49
Static connections
A static connection maintains a continuous communication link between the Proxy Agent and the managed node.
We recommend that you select the static connection to monitor critical managed nodes for 24 hours per day, 7 days per week.
Dynamic connections
A dynamic connection maintains a temporary communication link between the Proxy Agent and the managed node.
We recommend that you select the dynamic connection to monitor less critical
managed nodes on an as-needed basis.
Any Simple Network Management Network Protocol (SNMP) request or alarm on a managed node will initiate a dynamic connection. The dynamic connection will stay up as long as the Proxy Agent is actively processing SNMP requests and then time-out after a specified period.
2 NMS Submap Administration
Identify Connection Status
November 1998 Page 50
Identify Connection Status
Each connection line appears in one of six colors that represent the six status options for connections. If you do not wish to use the system default colors, you may assign a custom color by modifying values in the $APP_DEF/OVw file. The table below describes connection status.
Table 2. NMS connection status
Status on OpenView Default
Color
Connection Status
OVw*warningStatusLineColor Cyan Off OVw*marginalStatusLineColor Yellow Init
OVw*downStatusLineColor Red Down
OVw*downStatusLineColor Red Other
OVw*upStatusLineColor Black Up
2 NMS Submap Administration
Identify Connection Status
November 1998 Page 51
Connect a Managed Node
OpenView allows you to establish connections between a Proxy Agent and a managed node with the following steps:
1 Click on the line that represents a connection between a Proxy Agent and a managed node.
2 Click Performance > DEFINITY > Start Connection
2 NMS Submap Administration
Identify Connection Status
November 1998 Page 52
Disconnect a Managed Node
OpenView also allows you to disable a managed node from a Proxy Agent.
!
CAUTION:
If you disable a managed node, you place it in a status of off. To use this connection in the future, you must enable the connection on the Proxy Agent or start the connection.
To disable a managed node from a Proxy Agent, do the following:
1 Click the line that represents a connection between a Proxy Agent and a managed node.
2 Click Performance > DEFINITY > Stop Connection
2 NMS Submap Administration
View the Status of a Connection
November 1998 Page 53
View the Status of a Connection
During any active NMS session, you can access details about a selected connection.
To view details about a connection available on the Connection Status screen, do the following:
1 Click the line that represents a connection between a Proxy Agent and a managed node.
2 Click Performance > DEFINITY > Connection Status
2 NMS Submap Administration
View the Status of a Connection
November 1998 Page 54
Example: Connection Status screen
The information you can view on a Connection Status screen is similar to the example shown below.
Figure 12. Sample Connection Status File View
Messages Help Stop Close Connection Type Connection State Connection Duration Connection Idle Connections Attempted Connections Successful Data Requests Data Responses
Alarm Forwarding Status
: static : off : 0 : 127587600 : 22 : 15 : 5732 : 5731 : ok
Connection Status for snmplab2x
2 NMS Submap Administration
View the Status of a Connection
November 1998 Page 55
Field Description
The following table provides descriptions for the connection details available on the Connection Status screen.
Table 3. Field descriptions for Connection Status screen
Field Description
Connection Status Identifies the selected status for the connection. The connection status can be: init, up, down, off, idle, or other. Connection Type Identifies static and dynamic connections.
Connection Duration
The length of time that a connection is in the up status.
Connection Idle The length of time that a connection is in the idle status. Connections
Attempted
The number of times the Proxy Agent attempted to connect to the managed node.
Connections Successful
The number of successful connections from the Proxy Agent to the managed node.
Data Requests The number of data requests from a Proxy Agent to a managed node.
2 NMS Submap Administration
Verify Static Connection Status
November 1998 Page 56
Verify Static Connection Status
Proxy Agents maintain continuous contact with their associated managed nodes to transfer current data to the Network Management System (NMS). Lack of data or incorrect data can indicate that a connection problem exists.
The NMS provides two methods to verify connection status: Icon states and a Managed Node Lists screen.
Icon States Connection icons provide the current connection status for a managed node. You can determine the connection status of a managed node by viewing managed node icons on one of the three network submaps. See Table 2 on page 50 for details.
Data Responses The number of times a managed node responds to a data request from a Proxy Agent.
Alarm Forwarding Status
Displays ok if the alarm status transmitted successfully. Displays failed if the alarm status did not transmit successfully.
Table 3. Field descriptions for Connection Status screen
Field Description
2 NMS Submap Administration
Verify Static Connection Status
November 1998 Page 57
Open a
Managed Node List screen
You can display a screen that lists all managed nodes that connect to a Proxy Agent. This list contains the connection status for each managed node. To open a managed node list, do the following:
1 Select a Proxy Agent icon from the network submap.
2 Click Performance > DEFINITY > Show Managed Nodes
2 NMS Submap Administration
Verify Static Connection Status
November 1998 Page 58
Example: Managed Node List screen
When you open a managed node list, you will see a screen similar to the Managed Node List for Proxy Agent below.
2 NMS Submap Administration
Verify Static Connection Status
November 1998 Page 59
Field Descriptions
The table below contains field descriptions for the Managed Node List for Proxy Agent screen shown above.
Table 4. Field descriptions for Managed Node List for Proxy Agent screen
Field Description Example
Type The type of switch (ECS, G3, MCU). ECS
Node Name The managed node name as administered in the Proxy Agent.
snmplab2
Connection Type
The type of connection: static or dynamic dynamic
Connection The status of the connection: up, down, off, idle,
other, or init.
up
Timeout Timeout refers to the time administered on the Managed Node screen on the Proxy Agent. This value indicates that the Proxy Agent must transfer data to the NMS before the allotted time expires.
5
2 NMS Submap Administration
Verify Static Connection Status
November 1998 Page 60
Submap Location
The type of submap associated with either the USA or Custom submap
123456789 0
Object Label The system name of the managed node. The object label does not need to match the name administered in the Proxy Agent.
snmplab2 Table 4. Field descriptions for Managed Node List for Proxy Agent screen
Field Description Example
2 NMS Submap Administration
Modify NMS Submaps
November 1998 Page 61
Modify NMS Submaps
If you wish to modify location or connection information for a submap, you can edit the Location Override file from a text editor or can modifying the Default Location screen on the Proxy Agent.
Modify the Location Override File
In the Location Override file, you can change location information for managed nodes or hide managed nodes. The changes you administer in the Location Override file do not change the information contained in the Proxy Agent. This functionality allows multiple NMS users to view the same information in different formats.
Directions for modifying the Location Override file are contained within that file. To modify the Location Override file, do the following:
1 At a UNIX prompt, type /opt/OV/OneVision/DG3Poll/Location and press Return. Result: The system opens the Location Override file.
November 1998 Page 62
3
3NMS Alerts
Chapter Contents
• Introduction 63 • Identify NMS Alerts 64– Identify Proxy Agent Icon States 65 – Events that Change Proxy Agent States 66 – Identify Managed Node Icon States 67
3 NMS Alerts
Introduction
November 1998 Page 63
Introduction
The Network Management System When Performance Management performs a data collection, or when the Network Management System (NMS) performs a poll, the NMS color-codes managed node icons to identify alerts for those managed nodes.
When the NMS polls Proxy Agents and discovers an alarm for a Proxy Agent, the NMS color-codes the associated Proxy Agent icons to reflect alarm states. Performance Management comes with the facility to notify you by pager or by email when alerts occur. You may also install the add-on software, TeleAlert or Remedy to provide more notifcation capabilities.
3 NMS Alerts
Identify NMS Alerts
November 1998 Page 64
Identify NMS Alerts
Introduction When a Proxy Agent has an alarm or a managed node has an alert, the NMS colors the corresponding icon to indicate the severity of the alarm or alert. When multiple alarms or alerts that have more than one level of severity occur, icon colors represent the most severe alarm or alert.
See "Icon States" on page 56 for details on icon states.
3 NMS Alerts
Identify NMS Alerts
November 1998 Page 65
Identify Proxy Agent Icon States
Proxy Agent alarms occur when alarm forwarding fails or when an authentication failure occurs. Because alarms manifest as colored icons, the following section refers to alarm states as icon states.
Each state of a Proxy Agent icon represents a condition that exists between a Proxy Agent and a managed node. The NMS platform assigns the names of these states. The table below describes Proxy Agent icon states that occur in
OpenView.
Table 5. Proxy Agent icon states
OpenView State Name
Description
Normal The Proxy Agent is communicating with the NMS.
Warning The Proxy Agent is communicating with the NMS but the NMS received an Authentication Failure trap sent by the Proxy Agent. Major The Proxy Agent failed to forward alarms to the administered
3 NMS Alerts
Identify NMS Alerts
November 1998 Page 66
Events that Change Proxy Agent States
The color of a Proxy Agent icon changes when polling events or trap events indicate a change in the Proxy Agent alarm status.
Proxy Agent icon states change when OpenView polls a Proxy Agent and receives one of the unacceptable results identified in the table below.
If the icon is in the New state and a subsequent poll finds an acceptable response, the icon returns to the Normal state.
Table 6. Polling changes for Proxy Agent icon alarm states
Result of poll Default polling
interval (min)
New State
AlarmForward = Failed 5 Major
3 NMS Alerts
Identify NMS Alerts
November 1998 Page 67
Identify Managed Node Icon States
Managed node alerts arise when unacceptable conditions occur on a managed node. Because alerts manifest as color-coded icons, the following section refers to alert states as icon states.
The state of a managed node icon represents the current alert for that managed node. The NMS platform assigns the names of these states.
The table below describes managed node icon states that occur in OpenView. Table 7. Managed node icon alert states
OpenView State Name
Definition
Normal The managed node has no alert.
Warning The managed node has at least one warning alert. Minor The managed node has at least one minor alert.
3 NMS Alerts
Identify NMS Alerts
November 1998 Page 68
Major The managed node has at least one major alert. Unknown One of the following conditions is true:
• Communication between a Proxy Agent and a managed node is unstable; therefore, the Proxy Agent cannot indicate the status or health of the managed node. • The NMS cannot communicate with the Proxy Agent and,
therefore, cannot determine the status of the managed node.
• A dynamic connection that has not received a fault status update or a major or minor alert.
Table 7. Managed node icon alert states
OpenView State Name
Definition
3 NMS Alerts
Identify NMS Alerts
November 1998 Page 69 Events that Change Managed Node Icon States
The color of a managed node icon changes when Performance Management conducts a data collection that identifies an alert level. Below is a description of the alert levels you might encounter.
Data Collection. Performance Management collects data on a user-specified basis. This information is specific to managed nodes with static connections in an
up state. When an unacceptable health condition arises, that managed node icon accepts the icon state described in the table below.
Table 8. Performance data collection change managed node icon states
Result of poll New icon state
g3healthMajor > 0 Major
• g3healthMinor > 0, and • g3healthMajor = 0
Minor
• g3healthWarning > 0, and • g3healthMajor = 0, and • g3healthMinor = 0
Warning
• g3healthMajor = 0, and • g3healthMinor = 0, and • g3Warning = 0
Normal
3 NMS Alerts
Identify NMS Alerts
November 1998 Page 70
Proxy Agent does not exist or does not respond Unknown
Connection status is not up Unknown
Table 8. Performance data collection change managed node icon states
Result of poll New icon state
3 NMS Alerts
NMS alert Notification Methods
November 1998 Page 71
NMS alert Notification Methods
Introduction The Performance Management installation process allows you to install a script that forwards alert information to a pager or to email. You can also install add-on software such as TelAlert or Remedy that provide additional methods for notifying you when alerts occur.
Alert Notification Options
The following methods for receiving alert notification are available to you through the NMS:
Table 9. NMS alert Notification Methods
Software Notification Type
Description
Performance Management
CU Pager Pages the system administrator and sends a code that identifies the alert.
Performance Management
email Sends an email message to the system administrator that contains pertinent alert information.
TelAlert Alpha Page Pages the system administrator and sends a code that identifies the alarm or error type.
The alpha page also confirms when the system administrator received the page. The page repeats until the system administrator responds to the page.
3 NMS Alerts
NMS alert Notification Methods
November 1998 Page 72
TelAlert Voice Page Sends a voice page to the system administrator and sends a code that identifies the alert. The voice page also confirms that the system administrator received the page. The page repeats until the system administrator responds to the page.
TelAlert Audix Calls the system administrator’s audix and leaves a voice message containing alert information.
Remedy Ticket Interfaces with Performance Management to provide historical information for alerts.
Table 9. NMS alert Notification Methods
Software Notification Type
Description
3 NMS Alerts
NMS alert Notification Methods
November 1998 Page 73
Set Up Alert Notification
To setup alert notification, identify the notification method that meets your business needs, then complete the following procedure.
1 Select an Alert Notification method.
2 At a UNIX editor, type the following and press ENTER:
/opt/OV/OneVision/bin/Samples
Result: The system displays a list of script files.
3 Type one of the script file names below: • TA_AlphaPage
• TA_VoicePage • TA_Audix • CU_Pager • Notify_Email • ARS_Ticket
Result: The system displays procedures for the selected script.
4 Complete the procedures included in the file.
November 1998 Page 74
4
4Performance Management Overview
Chapter Contents
• Introduction 75• System Requirements 77 • Supported Products 78
4 Performance Management Overview
Introduction
November 1998 Page 75
Introduction
As one of a collection of Business Communication System (BCS) management applications, the Performance Management system enables you to monitor the performance of the managed nodes (DEFINITY switch) in your DEFINITY system using an industry standard SNMP-based Network Management System (NMS). The system collects switch performance data, primarily usage peaks, from the DEFINITY Proxy Agent through SNMP. Using Performance Management, you can retrieve that performance data and generate various types of reports, which can then be viewed on the screen in various formats or exported to other applications.
Features Performance Management provides the following capabilities: • Data collection
Where you specify the type of data, time of collection, and length of storage for data to be collected from each managed node.
• Exception thresholds
Where you specify thresholds, or tolerance levels, for processor occupancy and trunk group grade of service. When the thresholds are exceeded, a performance alert appears on the screen.
• Performance reports
4 Performance Management Overview
Introduction
November 1998 Page 76
• Report schedule
Where you specify when a report should run, either immediately or at a later scheduled time.
• Alerting
Icons on the screen that indicate any violations of exception thresholds or alerts, such as when the system fails to collect performance data as scheduled, or when the system fails to generate a scheduled report. • Graphical User Interface (GUI)
A graphic representation of what is going on with the system, including various tools to help you navigate and use the system easily.
Background Performance Management replaces the DEFINITY Monitor I product. It provides the same capabilities as Monitor I, except for the following reports:
• Force Management Alternatives • Access Endpoint report
4 Performance Management Overview
System Requirements
November 1998 Page 77
System Requirements
The Project Provisioning Package for this release contains the specific recommendations and specifications to plan and install the Performance Management software.
Installation Options
The provisioning package also defines the terms and conditions for the three installation options:
• Customer installation
• Technical Support Center (TSC) installation services
• NetCare® Network Consulting Group installation of a complete turn-key system
Refer to "About This Book" on page 8 for more information about the Project Provisioning Package.
Hardware Requirements
You should work with your Lucent Account Executive to determine the hardware requirements that your organization needs to meet its business and performance specifications.
Software Requirements
The DEFINITY Performance Management application operates with the following software:
• DEFINITY Proxy Agent, Release 2.0
• DEFINITY Network Management Common Software, Release 2.0 • Network Management System (NMS) platform
4 Performance Management Overview
Supported Products
November 1998 Page 78
Supported Products
NMS Products The DEFINITY Performance Management 2.0 product supports the following network management products:
• DEFINITY Proxy Agent 2.0 • DEFINITY Fault Management 2.0
NMS Platforms The DEFINITY Performance Management 2.0 product supports the following Network Management System (NMS) platforms:
• HP OpenView Releases 4.11, 5.0, and 5.01 installed on Solaris Release 2.5.1
Supported Systems
4 Performance Management Overview
Access Performance Management
November 1998 Page 79
Access Performance Management
You should start Performance Management after you complete the installation process to verify that Performance Management is installed correctly.
Procedure To access Performance Management, do the following:
1 Log in to UNIX.
2 Start the operating system software.
3 At a UNIX editor, type one of the following and press Return: • For NetView, type $OV_BIN/nv600
• For OpenView, type $OV_BIN/ovw&
Result: The system opens the Network Management System software and displays the Root map.
4 Double-click a DEFINITY submap icon.
Result: The system displays a DEFINITY submap.
5 Double-click a managed node icon.
4 Performance Management Overview
Access Performance Management
November 1998 Page 80
6 If the system displays this screen, click Start Performance Management. Result: The Performance Management application starts and displays the
4 Performance Management Overview
Exit Performance Management
November 1998 Page 81
Exit Performance Management
To exit Performance Management, do one of the following:
• Click File > Exit from the main window of Performance Management • Exit the NMS session
The system closes Performance Management and any associated open windows. Prior to exiting, Performance Management will check for unsaved changes, and, if any exist, give you the chance to save them.
Exit the NMS session
November 1998 Page 82
5
5Basic Screen Components
Chapter Contents
• Introduction 83• Screen Components 84 • Main Window 88 • About Panes 90 • Menu bar 92 • Nodes 94
• Alert Indicators 95 • Managed Nodes 97 • Command Buttons 97 • Status Bar 98
5 Basic Screen Components
Introduction
November 1998 Page 83
Introduction
Performance Management uses a graphical user interface (GUI) as a way to access the tasks you need to perform in order to measure system performance. The GUI consists of various screens, buttons, and other navigational tools, in conjunction with your mouse, to enable you to access all of the reporting capabilities the system provides.
5 Basic Screen Components
Screen Components
November 1998 Page 84
Screen Components
5 Basic Screen Components
Screen Components
November 1998 Page 85
.
Menu Bar
Master Event Log
Performance Management
Expand/Collapse Icon
Alert Indicator
DEFINITY Systems
Managed Nodes
Status Bar
Command Buttons
Left Pane Right Pane
5 Basic Screen Components Screen Components November 1998 Page 86 Component Description
Component Name Description
Menu bar Displays pull-down menus for performing basic tasks. Go to "Menu bar" on page 92 for more details. Master Event Log Displays the Master Event Log
pane, which shows all events for all managed nodes. Go to Chapter 8, "Event Log" for more details. Performance
Management
Displays three nodes for managing the performance of the system. Expand/collapse icon Hides or shows more options below
the current node. Go to "Nodes" on page 94.
Alert indicator Visual indicator of any system problems. Go to "Alert Indicators" on page 95.
DEFINITY Systems Displays a tree node for all managed nodes.
5 Basic Screen Components
Screen Components
November 1998 Page 87
Command buttons Buttons that are common on all screens. Go to "Command Buttons" on page 97 for more details.
Status bar Indicates the status of the system. Go to "Status Bar" on page 98 for more details.
Left pane The left part of the main window that contains icons and nodes. Go to "Main Window" on page 88 for more details.
Splitter bar Separates the left and right pane. Go to "Splitter Bar" on page 98 for more details.
Right pane The right part of the main window that contains the display screens. Go to "Main Window" on page 88 for more details.
5 Basic Screen Components
Main Window
November 1998 Page 88
Main Window
The main window is the initial screen you see when you access Performance Management. The main window has the same look and feel as the Microsoft Windows Explorer tree, where there are two sides to the screen, a left (pane) and a right side (pane). The difference is that in Performance Management, the right side displays a display screen related to what is selected in the left side, whereas in Windows the right side displays more directory structure based on what is selected in the left side.
Left Pane The left side of the main window is a pane that graphically displays the hierarchy of the Performance Management application. It consists of various nodes and alert icons, as shown in the preceding screen. When you can single-click on a node in the left pane, the right pane changes to reflect the corresponding display screen for that selection.
Within the tree, you can click on the plus (+) sign to see the contents for that node, or you can click on the minus (-) sign to hide the contents of the node. In this way you can drill down from a high level to lower levels of options and details.
Right Pane The right pane is a display screen that changes according to the node or icon selected in the left pane. It is the part of the main window where you specify all of the settings for the system. It can also contain nodes that branch off from
whatever is selected in the left pane.
5 Basic Screen Components
Main Window
November 1998 Page 89
For example, if you click the Data Collection Defaults node in the left pane, the right pane displays the Data Collection Defaults pane, as shown below:
Saving Information
5 Basic Screen Components
About Panes
November 1998 Page 90
About Panes
Depending on what you select in the left pane, the right side of the main window (the right pane) can display any of the following specific panes. These panes and examples are described in more detail in the rest of this document as part of the description of the task they correspond to.
Pane Description
Root Highest level pane; starting point for using the system.
Master Event Log Displays the Master Event Log pane that shows all events for all managed nodes.
Performance Management
Contains tree nodes for defining default report parameter thresholds.
Data Collection Display screen for defining data collection parameters.
Global Alerting Parameters
Display screen for defining alerting parameters used throughout the system.
Reports Contains a node for each report defined in the system.
5 Basic Screen Components
About Panes
November 1998 Page 91
DEFINITY Systems Contains a node for each managed node known by Performance Management. DEFINITY Contains nodes for setting thresholds to
measure the performance of a specific managed node.
Data Collection Contains nodes for defining data collection parameters for a managed node.
Processor Occupancy Contains nodes for defining alerting and event log parameters for measuring processor occupancy performance.
Trunk Groups Contains nodes for defining alerting and event log parameters for measuring trunk group performance.
5 Basic Screen Components
Menu bar
November 1998 Page 92
Menu bar
The options available through the pfmenu bar are described as follows:
Menu Option Description
File New Creates a new component as
appropriate for the task being performed.
Expand Expands the selected node on the pane.
Up One Level Displays the parent of the selected node. For example, if you the Master Event Log is highlighted, clicking Up one Level will highlight the Root node.
Exit Exits Performance Management.
Edit Delete Deletes the currently selected
component.
5 Basic Screen Components
Menu bar
November 1998 Page 93
Help Topics NA
Current Panel Online help for the currently-displayed pane About Definity
Performance Management 2.0
Software version and date
5 Basic Screen Components
Nodes
November 1998 Page 94
Nodes
Nodes represent the options available in your system. There are three basic nodes available from the Root pane. The Root pane is the starting point for performing all Performance Management tasks, since all other nodes branch off from these three nodes. Click once on the Root node in the left pane to expand it to show the following nodes:
Expandable Nodes
Within the “tree” of nodes and icons in the left pane, you can show (expand) or hide (collapse) the options below the node by clicking on the plus sign or the minus next to the node, where:
• A plus (+) sign means the node is collapsed and can be expanded; clicking on it expands the node to show any sub-components.
• A minus (-) sign means the node is expanded and can be closed; clicking on it collapses all of its sub-components.
Node Description
Master Event log Represents the master log of events for all inactive and active objects. See Chapter 8, "Event Log" for more information.
Performance Management
Represents the Performance Management
application. Expands to show more nodes where you can define system-wide parameters.
5 Basic Screen Components
Alert Indicators
November 1998 Page 95
Alert Indicators
Alert indicators are visual cues of any problems in the DEFINITY system. Alerting is also used by the NMS to indicate any problems associated with a specific managed node. There are different levels of alerts that have corresponding warnings, as indicated by the shape and color of the alert indicator. You can tell at a glance by looking at the alert indicators in the left pane where problems are and the severity of the problem.
Color Scheme Changing the colors on your terminal can affect the look of your icons. See your system administrator or account executive for help.
Related Information
See Chapter 9, "Set Alerting Parameters" for more alert information.
Alert Levels and Icons
The levels of alerts, in order of increasing severity, are shown in the following table:
Alert Level Alert Icon you see in left window pane
Warning
5 Basic Screen Components
Alert Indicators
November 1998 Page 96
Major
Critical
5 Basic Screen Components
Managed Nodes
November 1998 Page 97
Managed Nodes
Expanding the DEFINITY Systems node by clicking on it displays all of the nodes for each switch, or managed node, known by the Performance Management system.
Command Buttons
The command buttons that appear at the bottom of the right pane do the following:
Button Purpose
Save Updates the database with the current settings. For display screens that have tabs, saves the current settings for all of the tabs, not just the current tab.
Reset Discards any changes and resets the
pane with the most recently saved settings.
Help Displays online help for the
5 Basic Screen Components
Status Bar
November 1998 Page 98
Status Bar
This is a message area at the bottom of the main window. Depending on the circumstances, it displays a status indicator for any processing that lasts more than two seconds.
Splitter Bar
November 1998 Page 99
6
6Specify Collection Parameters
Chapter Contents
• Introduction 100• Specify Default Data Collection Hours 101
• Specify Collection Hours