Ensemble learning method for the prediction
of new bioactive molecules
Lateefat Temitope Afolabi1, Faisal Saeed2,3*, Haslinda Hashim3,4, Olutomilayo Olayemi Petinrin3
1 Department of Physical Sciences, College of Natural Sciences, Al-Hikmah University, Ilorin, Nigeria, 2 College of Computer Science and Engineering, Taibah University, Medina, Saudi Arabia, 3 Information
Systems Department, Faculty of Computing, Universiti Teknologi Malaysia, Skudai, Johor, Malaysia, 4 Kolej Yayasan Pelajaran Johor, KM16, Jalan Kulai-Kota Tinggi, Kota Tinggi, Johor, Malaysia
Abstract
Pharmacologically active molecules can provide remedies for a range of different illnesses and infections. Therefore, the search for such bioactive molecules has been an enduring mission. As such, there is a need to employ a more suitable, reliable, and robust classifica-tion method for enhancing the predicclassifica-tion of the existence of new bioactive molecules. In this paper, we adopt a recently developed combination of different boosting methods (Adaboost) for the prediction of new bioactive molecules. We conducted the research experiments utiliz-ing the widely used MDL Drug Data Report (MDDR) database. The proposed boostutiliz-ing method generated better results than other machine learning methods. This finding sug-gests that the method is suitable for inclusion among the in silico tools for use in cheminfor-matics, computational chemistry and molecular biology.
Background
Virtual screening, which has its roots in cheminformatics, computational chemistry and struc-tural biology [1], is the computation of the similarity between the target (reference structure) and each molecule in a database [2]. It is an established method for the discovery of new bio-logically active molecules [3]. It is a process whereby, through molecular modeling, each chem-ical agent in a database is docked into the binding region of each macro molecule target [4]. Docking is the process whereby the best fit for each agent in the binding region of the macro-molecular target is calculated [4]. Schneider and Bohm [5] provided a survey of fast automated docking methods, and a detailed study on the calculation of an optimal box size for molecular docking against predicted binding pockets was carried out by Feinstein and Brylinski [6]. Wang et al. [7] extensively reviewed grapheme-based glucose sensors spanning from the period of 2008 to 2015. Huang et al. [8] worked on Drosophila, where Piwi-piRNA was the guiding epigenetic mechanism to target sites. Their work provided insight into the process involved in the recruitment of epigenetic factors to their target sites. Meanwhile, Marinov et al. [9] investigated the work of Huang et al. and discovered that their genome-wide result was not supported by their dataset. The work of Lin et al. [10] confirmed Marinov et al. who stated that
a1111111111 a1111111111 a1111111111 a1111111111 a1111111111
OPEN ACCESS
Citation: Afolabi LT, Saeed F, Hashim H, Petinrin
OO (2018) Ensemble learning method for the prediction of new bioactive molecules. PLoS ONE 13(1): e0189538.https://doi.org/10.1371/journal. pone.0189538
Editor: Bin Liu, Harbin Institute of Technology
Shenzhen Graduate School, CHINA
Received: July 24, 2017
Accepted: November 27, 2017
Published: January 12, 2018
Copyright: This is an open access article, free of all
copyright, and may be freely reproduced, distributed, transmitted, modified, built upon, or otherwise used by anyone for any lawful purpose. The work is made available under theCreative Commons CC0public domain dedication.
Data Availability Statement: Data are available
from the ”Sci Tegic Accelrys Inc" atwww.accelrys. com. A license is required to access the data. More details about the dataset can be found at:http:// accelrys.com/products/collaborative-science/ databases/bioactivity-databases/mddr.html. The authors of the present study did not have any special access privileges that others would not have and others would be able to access these data in the same manner as the authors.
Funding: This work was funded by Q.
the genomic site was not discovered and reaffirmed that the genome RNA polymerase II distri-bution is influenced by Piwi. Watanabe and Lin reviewed piRNA with respect to some biologi-cal processes, and their detailed work can be found in [11]. The science of processing bioactive molecules in important fields, such as lead discovery and compound optimization, has evolved in recent years [12]. The literature has extensively discussed different virtual screening tech-niques [13–16] and activity prediction approaches [17].
For example, Burden and Winkler [18] introduced the Quantitative Structure-Activity Relationship (QSAR) method as a solution to large datasets and then proposed back propaga-tion (BP) after comparing this method with Multiple Linear Regression (MLR), Principal Component Regression (PCR) and Partial Least Squares (PLS) methods. They applied QSAR to massive data sets derived from combinatorial chemistry and High Throughput Screening (HTS). QSAR involves the prediction of the biological activity of a compound from a vectoral representation of molecular structure [19]. QSAR has been successfully utilized with regards to many drugs and agro-chemical design problems. In Burden and Winkler’s study [18], more information concerning the challenges of QSAR was outlined, and Rogers and Hopfinger [20] solved the problem of building QSAR and Quantity Structure-Property Relationship (QSPR) models using Genetic Function Approximation (GFA). In their work, they disclosed that the secret of the GFA lies in the creation and use of multiple models, rather than the utilization of a single method. Additionally, the unclear QSAR between plant-derived flavones and their inhibiting effects on aurora B kinase (aurB) was established [21].
In the relevant literature, several similarity search methods have been proposed [22]. Sheri-dan and Kearsley [22] justified the need for many chemical similarity search methods in the early discovery of leads in a drug discovery project. Detailed reviews of chemical similarity searching and virtual screening can be found in Shneider and Bohm [5] and Willett, Barnard and Downs [23].
In this modern era of computational technological advancement, the adoption of machine learning algorithms for the prediction of molecules has been explored. Willet et al. [24] applied the Binary Kernel Discrimination (BKD) approach for the determination of ion channel activ-ity. BKD was introduced and compared with merged similarity search by Harper [25]. Liu et al. [26] developed a model based on the Support Vector Machine, which can be used to automati-cally produce predictors. This model has a four-in-one function of extracting features, selecting parameters, training models, and cross-validation. This model improves the prediction rate.
A recent survey on the success (to date) and possible opportunities with regards to ligand-based virtual screening in machine learning was performed by Lavecchia [27]. The successes include the development of a large-scale machine learning data protocol, in the work of George et al. [28]; machine learning algorithms in multidimensional analysis of classification performance of compounds, Kurczab and Bojarski [29]; the Naive Bayesian classifier, Kurczab, Smusz and Bojarski [15], Bender et al. [30], and Glick et al. [31]; the Bayesian belief network, Abdo et al. [17], Nidhi et al. [32], and Xia et al. [33]; Support vector machines, Bruce et al. [19] and Buchwald, Ritter and Kramer [34]; Binary kernel discrimination, Willett et al. [24] and Reynolds and Sternberg [25]; the C5 (decision tree), Cao et al. [35]; and Investigational Novel Drug Discovery by Example (INDDEXTM), Reynolds and Sterberg [16].
Krasowski and Ekins [36] addressed the challenges faced in correctly detecting and identi-fying a molecule intake into a class. They utilized cheminformatics to determine the cross reac-tivity of designer drugs to their available immunoassay (procedure for detecting or measuring specific proteins or other substances through their properties as antigens) [36].
Stumpfe and Bajorath’s study [37] focuses on the practical applications, calculation, and appropriate domain of ligand-based virtual screening. Sherhod et al. [38] generated structural fragmented descriptors by applying a contrast pattern tree mining algorithm. The pattern
Education (Malaysia) and Research Management Center, Universiti Teknologi Malaysia (UTM):http:// rmc.utm.my/.
Competing interests: The authors have declared
forms hierarchical clusters of compounds that represent different classes of chemicals. This method was able to identify common toxic features and their classes. Takigawa and Mamit-suka [39] further elaborated on this idea and the procedures for mining frequent sub-graphs for compounds with molecular graphs and chemical compounds.
Smusz et al. [40] adapted virtual screening for their work on the discovery of two structur-ally new 5-HT6R ligands, and Me´tivier et al. [41] worked on the discovery of structural alerts.
In recent research, clustering algorithms have also been used in cheminformatics to discover drugs. A detailed study [42] compares popular clustering techniques, namely, k-means, bisect-ing k-means and ward clusterbisect-ing. The applications of clusterbisect-ing include QSAR analysis, High Throughput Screening (HTS), and Absorption, Distribution, Metabolism, Elimination and Toxicity (ADMET) prediction [42]. Meanwhile, Pires et al. [43] proposed a novel technique, called pkCSM, to develop predictive models for toxicity properties and small-molecule phar-macokinetics using graph-based signatures [43].
Ensembles have proven to be suitable in improving the performance of a prediction model since they utilize the ability of more than one classifier. They have been used to identify DNA-binding proteins [44] and Piwi-Interacting RNAs [45].
The purpose of our research is to enhance the prediction of bioactive molecules using the boosting algorithm ensemble AdaboostM1 in conjunction with Bagging, Jrip, PART, Random Forest, REPTree and J48 as nominal classifiers. We also compared the performances of the boosting algorithm with a support vector machine classifier called LibSVM (LSVM) [17,46].
Materials and methods
Data sets
Bioactive molecules from both natural products and synthetic compounds are precious sources that provide us with the necessary tools to create new drugs to cure diseases [17]. Molecular fingerprints are representations of chemical structures initially designed to support chemical database substructure searching. Subsequently, their use had been for analysis tasks, such as similarity searching, clustering, and classification. extended connectivity fingerprints (ECFPs) is a recently developed fingerprint methodology specifically designed to identify molecular features significant to molecular activity [47].
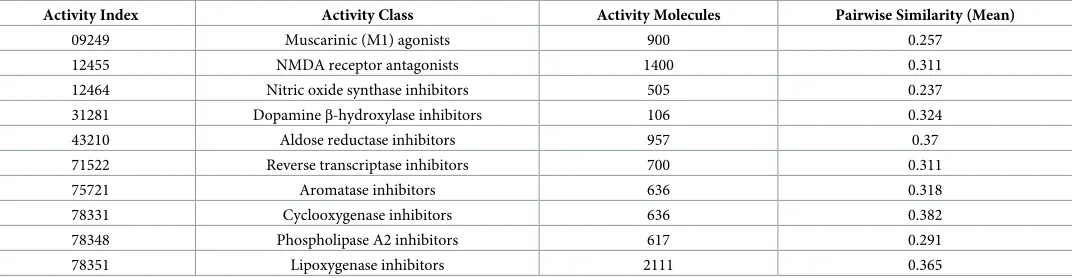
Three datasets from ECFP_4 standard molecular descriptors, which were used in previous studies, were used for this study. These datasets were retrieved from the MDDR database. The datasets consist of 8294, 5083, and 8568 instances for DS1, DS2, and DS3, respectively, as shown in Tables1–3. The quality of prediction was based on these datasets and the validation of the classification of molecules was based on the structure-activity relationship.
The three datasets were pre-processed on the work bench via the following filters: unsuper-vised, attributes, and Numeric to Nominal. DS 1 contains eleven normal activity classes, DS2 con-tains ten homogenous (average) activity classes, and DS 2 concon-tains ten heterogeneous activity classes. Tables1–3show activity index, activity class, active molecules and pairwise similarity (mean). The active molecules are the number of molecules or peptides belonging to the class and the diversity of classes. The diversity of the class is computed as the mean pairwise Tanimoto simi-larity score calculated across all pairs of molecules/peptides in the class using ECFP_4.
Ensemble learning technique
AdaboostM1 is an ensemble learning technique and the most well-known of the boosting family of algorithms. The algorithm sequentially trains models, with a new model trained at each round. At the end of each round, misclassified examples are identified and their emphasis is increased in a new training set, which is then fed into the next round and processed to train a new model [50]. The Waikato Environment for Knowledge Analysis (WEKA) software,
Table 1. Activity class for dataset DS1.
Activity Index Activity Class Activity Molecules Pairwise Similarity (Mean)
31420 Renin inhibitors 1130 0.573
71523 HIV protease inhibitors 750 0.446
37110 Thrombin inhibitors 803 0.419
31432 Angiotensin II AT1 antagonists 943 0.403
42731 Substance P antagonists 1246 0.339
06233 5HT3 antagonists 752 0.351
06245 5HT reuptake inhibitors 359 0.345
07701 D2 antagonists 395 0.345
06235 5HT1A agonists 827 0.343
78374 Protein kinase C inhibitors 453 0.323
78331 Cyclooxygenase inhibitors 636 0.268
https://doi.org/10.1371/journal.pone.0189538.t001
Table 3. Activity class for dataset DS3.
Activity Index Activity Class Activity Molecules Pairwise Similarity (Mean)
09249 Muscarinic (M1) agonists 900 0.257
12455 NMDA receptor antagonists 1400 0.311
12464 Nitric oxide synthase inhibitors 505 0.237 31281 Dopamineβ-hydroxylase inhibitors 106 0.324
43210 Aldose reductase inhibitors 957 0.37
71522 Reverse transcriptase inhibitors 700 0.311
75721 Aromatase inhibitors 636 0.318
78331 Cyclooxygenase inhibitors 636 0.382
78348 Phospholipase A2 inhibitors 617 0.291
78351 Lipoxygenase inhibitors 2111 0.365
https://doi.org/10.1371/journal.pone.0189538.t003
Table 2. Activity class for dataset DS2.
Activity Index Activity Class Activity Molecules Pairwise Similarity (Mean)
07707 Adenosine (A1) agonists 207 0.424
07708 Adenosine (A2) agonists 156 0.484
31420 Renin inhibitors 1130 0.584
42710 Monocyclicβ-lactams 111 0.596
64100 Cephalosporins 1301 0.512
64200 Carbacephems 158 0.503
64220 Carbapenems 1051 0.414
64300 Penicillin 126 0.444
65000 Antibiotic, macrolide 388 0.673
75755 Vitamin D analogous 455 0.569
which is cross-platform software with various machine learning algorithms written in Java, was used to carry out the study. AdaboostM1 is shown in Algorithm 1 (below).
Algorithm 1: AdaboostM1
Input
Sequence of m examples < (x1,ym),. . .,(xm,ym) > with labels yi 2 Y =
{1,. . .,k}
weak learning algorithmweakLearn
integer T specifying number of iterations
Initialize D1ðiÞ¼m1 for all i.
Do for t = 1, 2,. . .xo, T
1. Call weakLearn, providing it with the distribution Dt.
2. Get back a hypothesis ht: X ! Y.
3. Calculate the error of ht: 2t¼
P
i:hiðxiÞ6¼yiDtðiÞ. If 2t>
1
2, then set
T = t– 1 and abort loop. 4. Set βt = 2 t/ (1−2 t).
5. Update distribution Dt : Dtþ1ðiÞ¼
DtðiÞ
Zt
βtifhtðxiÞ¼yi
1otherwise
(
where Zt is a normalisation constant (chosen so that Dt+1 will be a
distribution).
Output
The final hypothesis:hfinð Þ ¼x arg maxy2Y
P
t:htðxÞ¼ylog
1
bt
Experimental design
The need to have a known drug that is classifiable to a specific biological molecular structure is a central part of computational chemistry [51]. In this experiment, we used the extended-con-nectivity fingerprints (ECFP4) developed by SciTegic [32]. The ECFP4 of MDDR (MDL Drug Data Report) [52] implementation in the test cases is used in this study.
Discovering the optimal parameters for a classifier was a time-consuming task. WEKA-Workbench offers the possibility of automatically finding the best possible setup for the LSVM classifier. The values of 1.0, 0.1, and 0.001 were given to the Cost, Gamma and Epsilon parameters, respectively, while the default values available in WEKA-Workbench were used for the other parameters. In this study, six AdaBoost ensemble classifiers were applied, includ-ing AdaBoostM1+Bagginclud-ing (Ada_Bag), AdaBoostM1+Jrip (Ada_Jrip), AdaBoostM1+J48 (Ada_J48), AdaBoostM1+PART (Ada_PART), AdaBoostM1+RandomForest (Ada_RF), and AdaBoostM1+REPTree (Ada_RT). Subsequently, a ten-fold cross-validation was carried out, and the results were evaluated using sensitivity, specificity, and area under the curve (AUC) measurements.
All experiments were conducted using a personal computer with an Intel1Core™ i7-4790 CPU 3.60 GHz processor, with 16 GB RAM, and a 64-bit operating system. There are some required settings in the configuration of WEKA to increase the heap size of the memory in the “RunWeka.ini” file under the parameter named “maxheap” with the value of “4096M”. This action supports the processing of the large amount of MDDR datasets being used (the original value was “1024M”).
The area under the receiver operating characteristic curve (AUC), specificity, sensitivity and accuracy were used as the machine learning evaluation methods. These methods are widely used as quality criteria to quantify performance. They are defined as follow:
Sensitivity¼ TP
TPþFN
Specificity¼ TN
TNþFP
Accuracy¼ ðTPþTNÞ
ðTPþTNþFPþFNÞ
Where TP = True Positive, FN = False Negative, TN = True Negative, and FP = False Positive.
Results and discussion
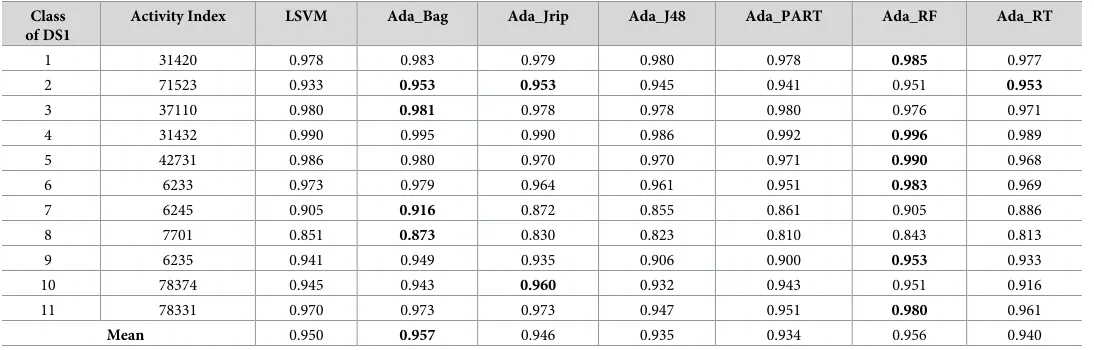
Tables4–6display the sensitivity measures (the true positive rates). A number of the AdaBoost ensemble classifiers exhibited the best performance and outperformed the existing best classi-fier in the discovery of novel drugs where 2 (Ada_Bag and Ada_RF) out of 6 AdaBoost classifi-ers (Table 4–DS 1) outperformed the existing best classifier (LSVM).
Table 5(with DS2) shows that 3 (Ada_Bag, Ada_J48, and Ada_RT) out of 6 AdaBoost clas-sifiers surpassed the LSVM classifier. However,Table 6(with DS3) illustrates that only 1 (Ada_Bag) out of 6 AdaBoost classifiers surpassed the LSVM classifier.
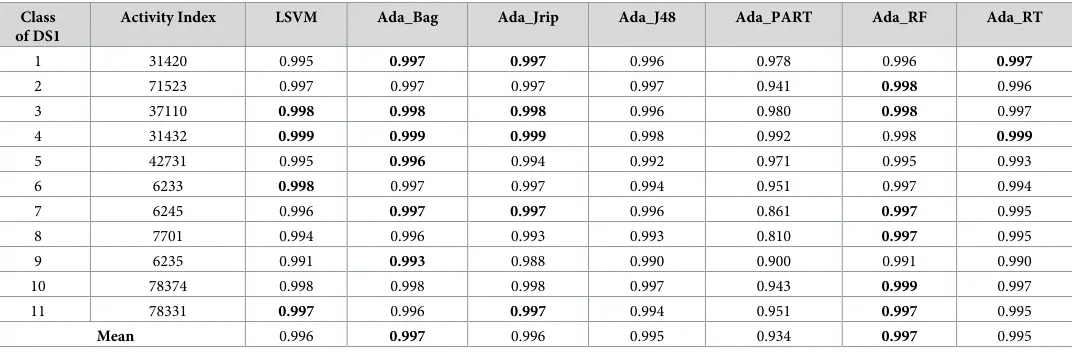
Tables7–9show the specificity measures (the true negative rates), which also demonstrate that a number of AdaBoost classifiers offered the best performance and surpassed the existing best classifier in the discovery of novel drugs, where 2 (Ada_Bag and Ada_RF) out of 6 Ada-Boost classifiers (Table 7–DS1) outperformed the existing best classifier (LSVM).
Moreover,Table 8(with DS2) illustrates that 5 (Ada_Bag, Ada_J48, Ada_PART, Ada_RF and Ada_RT) out of 6 AdaBoost classifiers outperformed the LSVM classifier.Table 9(with DS3) illustrates that only 1 (Ada_Bag) out of 6 AdaBoost classifiers surpassed the LSVM classi-fier in these specificity measures.
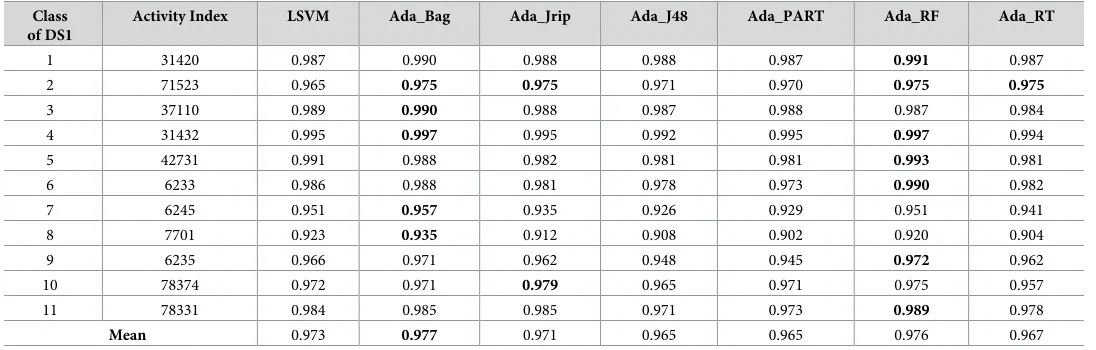
Tables10–12display the AUC measures, which also shows that a number of the AdaBoost classifiers offered the best performance and surpassed the existing best classifier in the
Table 4. Sensitivity measure for the prediction of new bioactive molecules with DS1 (normal sataset).
Class of DS1
Activity Index LSVM Ada_Bag Ada_Jrip Ada_J48 Ada_PART Ada_RF Ada_RT
1 31420 0.978 0.983 0.979 0.980 0.978 0.985 0.977
2 71523 0.933 0.953 0.953 0.945 0.941 0.951 0.953
3 37110 0.980 0.981 0.978 0.978 0.980 0.976 0.971
4 31432 0.990 0.995 0.990 0.986 0.992 0.996 0.989
5 42731 0.986 0.980 0.970 0.970 0.971 0.990 0.968
6 6233 0.973 0.979 0.964 0.961 0.951 0.983 0.969
7 6245 0.905 0.916 0.872 0.855 0.861 0.905 0.886
8 7701 0.851 0.873 0.830 0.823 0.810 0.843 0.813
9 6235 0.941 0.949 0.935 0.906 0.900 0.953 0.933
10 78374 0.945 0.943 0.960 0.932 0.943 0.951 0.916
11 78331 0.970 0.973 0.973 0.947 0.951 0.980 0.961
Mean 0.950 0.957 0.946 0.935 0.934 0.956 0.940
Table 6. Sensitivity measure for the prediction of new bioactive molecules with DS3 (heterogeneous).
Class of DS3
Activity Index
LSVM Ada_Bag Ada_Jrip Ada_J48 Ada_PART Ada_RF Ada_RT
1 09249 0.980 0.972 0.979 0.970 0.968 0.982 0.974
2 12455 0.955 0.966 0.942 0.942 0.946 0.966 0.949
3 12464 0.909 0.899 0.911 0.907 0.911 0.909 0.893
4 31281 0.972 0.953 0.934 0.868 0.887 0.915 0.896
5 43210 0.950 0.956 0.934 0.947 0.943 0.956 0.937
6 71522 0.914 0.919 0.916 0.913 0.897 0.909 0.880
7 75721 0.980 0.976 0.961 0.945 0.951 0.970 0.956
8 78331 0.838 0.857 0.796 0.808 0.832 0.841 0.838
9 78348 0.898 0.912 0.878 0.901 0.890 0.891 0.867
10 78351 0.943 0.962 0.958 0.942 0.945 0.971 0.949
Mean 0.934 0.937 0.921 0.914 0.917 0.931 0.914
https://doi.org/10.1371/journal.pone.0189538.t006
Table 5. Sensitivity measure for the prediction of new bioactive molecules with DS2 (homogeneous).
Class of DS2 Activity Index LSVM Ada_Bag Ada_Jrip Ada_J48 Ada_PART Ada_RF Ada_RT
1 07707 0.966 0.961 0.966 0.956 0.956 0.971 0.966
2 07708 0.968 0.968 0.962 0.974 0.949 0.987 0.949
3 31420 0.995 0.993 0.995 0.992 0.996 0.996 0.996
4 42710 0.982 0.973 0.973 0.982 0.973 0.964 0.991
5 64100 0.972 0.978 0.981 0.977 0.975 0.982 0.977
6 64200 0.734 0.772 0.715 0.810 0.759 0.722 0.759
7 64220 0.997 0.996 0.993 0.995 0.995 0.995 0.996
8 64300 0.968 0.952 0.952 0.976 0.968 0.968 0.976
9 65000 0.997 0.997 0.997 0.995 0.995 0.995 0.997
10 75755 0.996 0.996 0.993 0.996 0.996 0.996 0.993
Mean 0.958 0.959 0.953 0.965 0.956 0.958 0.960
https://doi.org/10.1371/journal.pone.0189538.t005
Table 7. Specificity measure for the prediction of new bioactive molecules with DS1 (normal dataset).
Class of DS1
Activity Index LSVM Ada_Bag Ada_Jrip Ada_J48 Ada_PART Ada_RF Ada_RT
1 31420 0.995 0.997 0.997 0.996 0.978 0.996 0.997
2 71523 0.997 0.997 0.997 0.997 0.941 0.998 0.996
3 37110 0.998 0.998 0.998 0.996 0.980 0.998 0.997
4 31432 0.999 0.999 0.999 0.998 0.992 0.998 0.999
5 42731 0.995 0.996 0.994 0.992 0.971 0.995 0.993
6 6233 0.998 0.997 0.997 0.994 0.951 0.997 0.994
7 6245 0.996 0.997 0.997 0.996 0.861 0.997 0.995
8 7701 0.994 0.996 0.993 0.993 0.810 0.997 0.995
9 6235 0.991 0.993 0.988 0.990 0.900 0.991 0.990
10 78374 0.998 0.998 0.998 0.997 0.943 0.999 0.997
11 78331 0.997 0.996 0.997 0.994 0.951 0.997 0.995
Mean 0.996 0.997 0.996 0.995 0.934 0.997 0.995
Table 8. Specificity measure for the prediction of new bioactive molecules with DS2 (homogeneous).
Class of DS2
Activity Index
LSVM Ada_Bag Ada_Jrip Ada_J48 Ada_PART Ada_RF Ada_RT
1 07707 0.999 0.999 0.999 0.999 0.999 0.999 0.999
2 07708 0.999 0.998 0.999 0.999 0.998 0.998 0.998
3 31420 0.997 0.998 0.998 0.997 0.997 0.998 0.998
4 42710 1.000 0.999 0.999 0.999 0.999 0.999 0.999
5 64100 0.989 0.990 0.987 0.992 0.990 0.989 0.990
6 64200 0.993 0.995 0.995 0.995 0.994 0.996 0.995
7 64220 0.998 0.999 0.999 0.998 0.999 0.998 0.999
8 64300 0.999 1.000 0.999 1.000 1.000 0.999 1.000
9 65000 1.000 0.999 0.999 0.999 0.999 1.000 1.000
10 75755 1.000 1.000 1.000 0.999 1.000 1.000 1.000
Mean 0.997 0.998 0.997 0.998 0.998 0.998 0.998
https://doi.org/10.1371/journal.pone.0189538.t008
Table 9. Specificity measure for the prediction of new bioactive molecules with DS3 (heterogeneous).
Class of DS3
Activity Index
LSVM Ada_Bag Ada_Jrip Ada_J48 Ada_PART Ada_RF Ada_RT
1 09249 0.997 0.996 0.996 0.995 0.996 0.996 0.994
2 12455 0.991 0.989 0.992 0.987 0.988 0.989 0.985
3 12464 0.996 0.998 0.996 0.995 0.994 0.999 0.996
4 31281 0.999 1.000 0.999 0.999 0.999 1.000 1.000
5 43210 0.995 0.997 0.996 0.995 0.994 0.996 0.994
6 71522 0.993 0.997 0.998 0.994 0.994 0.999 0.995
7 75721 0.997 0.998 0.997 0.996 0.996 0.998 0.997
8 78331 0.990 0.993 0.991 0.989 0.989 0.996 0.989
9 78348 0.992 0.995 0.995 0.994 0.992 0.996 0.993
10 78351 0.976 0.974 0.956 0.971 0.974 0.965 0.971
Mean 0.993 0.994 0.992 0.992 0.992 0.993 0.991
https://doi.org/10.1371/journal.pone.0189538.t009
Table 10. AUC measure for the prediction of new bioactive molecules with DS1 (normal dataset).
Class of DS1
Activity Index LSVM Ada_Bag Ada_Jrip Ada_J48 Ada_PART Ada_RF Ada_RT
1 31420 0.987 0.990 0.988 0.988 0.987 0.991 0.987
2 71523 0.965 0.975 0.975 0.971 0.970 0.975 0.975
3 37110 0.989 0.990 0.988 0.987 0.988 0.987 0.984
4 31432 0.995 0.997 0.995 0.992 0.995 0.997 0.994
5 42731 0.991 0.988 0.982 0.981 0.981 0.993 0.981
6 6233 0.986 0.988 0.981 0.978 0.973 0.990 0.982
7 6245 0.951 0.957 0.935 0.926 0.929 0.951 0.941
8 7701 0.923 0.935 0.912 0.908 0.902 0.920 0.904
9 6235 0.966 0.971 0.962 0.948 0.945 0.972 0.962
10 78374 0.972 0.971 0.979 0.965 0.971 0.975 0.957
11 78331 0.984 0.985 0.985 0.971 0.973 0.989 0.978
Mean 0.973 0.977 0.971 0.965 0.965 0.976 0.967
discovery of novel drugs, where 2 (Ada_Bag and Ada_RF) out of 6 AdaBoost classifiers (Table 10–DS1) outperformed the existing best classifier (LSVM).
Furthermore,Table 11(with DS2) illustrates that 4 (Ada_Bag, Ada_J48, Ada_RF and Ada_RT) out of 6 AdaBoost classifiers outperformed the LSVM classifier.Table 12(with DS3) illustrates that there was 1 (Ada_Bag) out of 6 AdaBoost classifiers that surpassed the LSVM classifier for AUC measurements.
From the results illustrated in Tables4–12, for all three measures (sensitivity, specificity and AUC), it can be seen that in most cases the AdaBoost ensemble classifiers provided better outcomes when compared with LSVM; these ensemble methods built a sequence of base mod-els where each model was constructed based on the performance of the previous model on the training set. In other words, by suitably combining the results of a set of base classifiers, the performance obtained was better than that of any base classifier.
This study used a cut-off value of 0.05 for the significance level (p-value). The p-value was considered significant and capable of providing an overall ranking if p<0.05 and the critical value for chi-squareχ2
at p = 0.05 for 6 degrees of freedom was 12.59. The degrees of freedom are equal to the total number of algorithms minus 1. In this study, there were 7 algorithms applied (LSVM + six AdaBoost ensemble classifiers), leading to 6 degrees of freedom. The results of Kendall’s W tests are presented in Tables13–15(below).
Table 12. AUC measure for the prediction of new bioactive molecules with DS3 (heterogeneous).
Class of DS3
Activity Index
LSVM Ada_Bag Ada_Jrip Ada_J48 Ada_PART Ada_RF Ada_RT
1 09249 0.989 0.984 0.988 0.983 0.982 0.989 0.984
2 12455 0.973 0.978 0.967 0.965 0.967 0.978 0.967
3 12464 0.953 0.949 0.954 0.951 0.953 0.954 0.945
4 31281 0.986 0.977 0.967 0.934 0.943 0.958 0.948
5 43210 0.973 0.977 0.965 0.971 0.969 0.976 0.966
6 71522 0.954 0.958 0.957 0.954 0.946 0.954 0.938
7 75721 0.989 0.987 0.979 0.971 0.974 0.984 0.977
8 78331 0.914 0.925 0.894 0.899 0.911 0.919 0.914
9 78348 0.945 0.954 0.937 0.948 0.941 0.944 0.930
10 78351 0.960 0.968 0.957 0.957 0.960 0.968 0.960
Mean 0.963 0.965 0.956 0.953 0.954 0.962 0.953
https://doi.org/10.1371/journal.pone.0189538.t012
Table 11. AUC measure for the prediction of new bioactive molecules with DS2 (homogeneous).
Class of DS2
Activity Index
LSVM Ada_Bag Ada_Jrip Ada_J48 Ada_PART Ada_RF Ada_RT
1 07707 0.983 0.980 0.983 0.978 0.978 0.985 0.983
2 07708 0.984 0.983 0.981 0.987 0.974 0.993 0.974
3 31420 0.996 0.996 0.997 0.995 0.997 0.997 0.997
4 42710 0.991 0.986 0.986 0.991 0.986 0.982 0.995
5 64100 0.981 0.984 0.984 0.985 0.983 0.986 0.984
6 64200 0.864 0.884 0.855 0.903 0.877 0.859 0.877
7 64220 0.998 0.998 0.996 0.997 0.997 0.997 0.998
8 64300 0.984 0.976 0.976 0.988 0.984 0.984 0.988
9 65000 0.999 0.998 0.998 0.997 0.997 0.998 0.999
10 75755 0.998 0.998 0.997 0.998 0.998 0.998 0.997
Mean 0.977 0.978 0.975 0.982 0.977 0.978 0.979
Table 13. Rankings of existing best performing classifier (LSVM) and AdaBoost ensemble classifiers, based on Kendall’s W test results using the MDDR dataset by sensitivity measure.
Datasets W χ2 p Ranks
DS1 0.506 33.387 0.000 Technique LSVM Ada_Bag Ada_Jrip Ada_J48 Ada_PART Ada_RF Ada_RT
Mean Ranks 4.45 5.91 4.18 2.36 2.68 5.86 2.55
DS2 0.086 5.176 0.521 Technique LSVM Ada_Bag Ada_Jrip Ada_J48 Ada_PART Ada_RF Ada_RT
Mean Ranks 4.4 4.1 3.1 4.1 3.25 4.4 4.65
DS3 0.397 23.827 0.001 Technique LSVM Ada_Bag Ada_Jrip Ada_J48 Ada_PART Ada_RF Ada_RT
Mean Ranks 5.10 5.70 3.70 2.55 2.85 5.35 2.75
https://doi.org/10.1371/journal.pone.0189538.t013
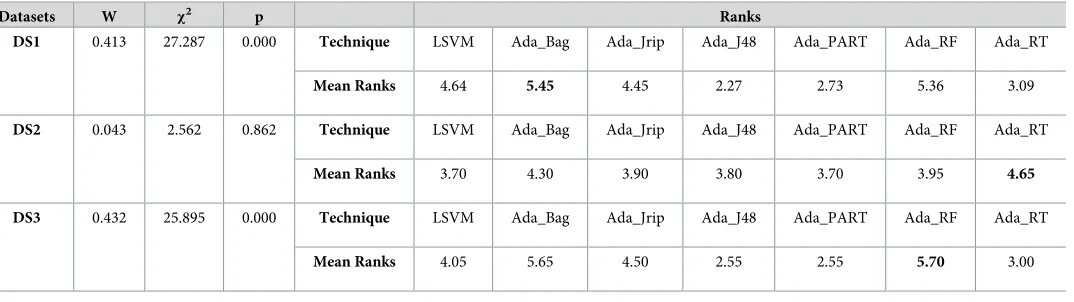
Table 14. Rankings of existing best performing classifier (LSVM) and AdaBoost ensemble classifiers, based on Kendall’s W test results using the MDDR dataset by specificity measure.
Datasets W χ2 p Ranks
DS1 0.413 27.287 0.000 Technique LSVM Ada_Bag Ada_Jrip Ada_J48 Ada_PART Ada_RF Ada_RT
Mean Ranks 4.64 5.45 4.45 2.27 2.73 5.36 3.09
DS2 0.043 2.562 0.862 Technique LSVM Ada_Bag Ada_Jrip Ada_J48 Ada_PART Ada_RF Ada_RT
Mean Ranks 3.70 4.30 3.90 3.80 3.70 3.95 4.65
DS3 0.432 25.895 0.000 Technique LSVM Ada_Bag Ada_Jrip Ada_J48 Ada_PART Ada_RF Ada_RT
Mean Ranks 4.05 5.65 4.50 2.55 2.55 5.70 3.00
https://doi.org/10.1371/journal.pone.0189538.t014
Table 15. Rankings of existing best performing classifier (LSVM) and AdaBoost ensemble classifiers, based on Kendall’s W test results using the MDDR dataset by AUC measure.
Datasets W χ2 p Ranks
DS1 0.600 39.573 0.000 Technique LSVM Ada_Bag Ada_Jrip Ada_J48 Ada_PART Ada_RF Ada_RT
Mean Ranks 4.50 5.91 4.41 2.18 2.27 6.00 2.73
DS2 0.122 7.293 0.295 Technique LSVM Ada_Bag Ada_Jrip Ada_J48 Ada_PART Ada_RF Ada_RT
Mean Ranks 4.35 3.90 2.95 4.30 3.15 4.55 4.80
DS3 0.486 29.133 0.000 Technique LSVM Ada_Bag Ada_Jrip Ada_J48 Ada_PART Ada_RF Ada_RT
Mean Ranks 5.25 5.85 3.50 2.55 2.75 5.50 2.60
The analysis inTable 13shows that Kendall’s coefficients (for DS1 and DS3 using the sensi-tivity measure) were significant (p<0.05,χ2>12.59) and that the performance of Ada_Bag sig-nificantly outperformed all of the other methods. The overall rankings for DS1 were
Ada_Bag>Ada_RF>LSVM>Ada_Jrip and Ada_PART>Ada_RT>Ada_J48. For DS3, they were Ada_Bag>Ada_RF>LSVM>Ada_Jrip>Ada_PART>Ada_RT>Ada_J48.
Table 14illustrates that Kendall’s coefficients (also for DS1 and DS3 using the specificity measure) were significant (p<0.05,χ2
>12.59) and that the performance of Ada_Bag in DS1 and Ada_RF in DS3 significantly outperformed all of the other methods. The overall rankings for DS1 were Ada_Bag>Ada_RF>LSVM>Ada_Jrip>Ada_RT>Ada_PART>Ada_J48. For DS3 the rankings were Ada_RF>Ada_Bag>Ada_Jrip>LSVM>Ada_RT>Ada_J48
>Ada_PART.
Table 15illustrates that Kendall’s coefficients (also for DS1 and DS3 using the AUC mea-sure) were significant (p<0.05,χ2
>12.59) and that the performance of Ada_RF and Ada_Bag considerably surpassed all of the other methods. The overall rankings for DS1 were Ada_RF> Ada_Bag>LSVM>Ada_Jrip>Ada_RT>Ada_PART>Ada_J48. For DS3 they were
Ada_Bag>Ada_RF>LSVM>Ada_Jrip>Ada_PART>Ada_RT>Ada_J48.
In contrast, it can be seen in Tables13–15that the results for DS2 using all measures (sensitivity, specificity and AUC) were not significant (p>0.05,χ2<12.59) because the per-formance of all classifiers in DS2, even though good, were very similar to each other. As such, the differences were not significant.
Fig 1(below) illustrates that the highest accuracy was obtained by Ada_PART 96.72% in DS1, Ada_J48 with 98.11% in DS2, and Ada_Bag with 94.54% in DS3. Thus, from the results inFig 1, we can also conclude that AdaBoost classifiers were able to handle all the datasets.
Most importantly, the results for DS3 (Fig 1) show that using Ada_Bag as the AdaBoost classifier improved the effectiveness of the prediction of new bioactive molecules in highly
diverse data when compared to using the existing best classification method (LSVM). The results of DS3 show an accuracy of 94.54% compared to 93.73% for LSVM.
In comparison, our proposed methods outperform the method adopted by Liu et al. [44], of which the Liu et al. 2016 method supersedes four other works, as illustrated in their report.
Conclusions
In this paper, we have presented various machine learning and ensemble methods that were applied to three MDDR benchmark datasets. The results of the experiments illustrate that the incorporation of the boosting algorithm (AdaboostM1), in conjunction with Bagging (Ada_-Bag) and Random Forest (Ada_RF) as the nominal classifiers into the in silico discovery of drugs, provides a significant improvement with regard to highly diverse datasets. In future research, other ensemble methods will be examined to see if they improve the effectiveness of the prediction of new bioactive molecules.
Acknowledgments
This work is supported by the Ministry of Higher Education (Malaysia) and the Research Management Centre (RMC) at the Universiti Teknologi Malaysia (UTM) under the Research University Grant Category (VOT Q.J130000.2528.16H74).
Author Contributions
Data curation: Lateefat Temitope Afolabi, Haslinda Hashim.
Formal analysis: Lateefat Temitope Afolabi, Faisal Saeed, Haslinda Hashim.
Methodology: Lateefat Temitope Afolabi, Faisal Saeed, Haslinda Hashim.
Software: Lateefat Temitope Afolabi, Haslinda Hashim, Olutomilayo Olayemi Petinrin.
Supervision: Faisal Saeed.
Validation: Faisal Saeed.
Writing – original draft: Lateefat Temitope Afolabi, Haslinda Hashim.
Writing – review & editing: Faisal Saeed, Olutomilayo Olayemi Petinrin.
References
1. Kubinyi H., Mannhold R., & Timmerman H. (2008). Virtual screening for bioactive molecules (Vol. 10). John Wiley & Sons
2. Willett P., Similarity-based virtual screening using 2D fingerprints. Drug Discovery Today, 2006. 11 (23): p. 1046–1053.
3. Bologa C.G. and Oprea T. I. Compound collection preparation for virtual screening, in Bioinformatics and Drug Discovery. 2012, Springer. p. 125–143.
4. Pasquinelli M. A., Little S., Laws S., & Rabinowitz J. Virtual Screening for Endocrine Disrupting Com-pounds. Target, 1(2), 3.
5. Schneider G. and Bo¨hm H. J. Virtual screening and fast automated docking methods. Drug Discovery Today, 2002. 7(1): p. 64–70. PMID:11790605
6. Feinstein W.P. and Brylinski M. Calculating an optimal box size for ligand docking and virtual screening against experimental and predicted binding pockets. Journal of Cheminformatics, 2015. 7(1): p. 18.
7. Wang F., Liu L. and Li W. J., Graphene-Based Glucose Sensors: A Brief Review. IEEE Transaction on NanoBioScience, Vol 14, No 8, December 2015.
9. Marinov G. K., Wang J., Brennecke J. and Toth K. F., Pitfalls of Mappong High-Throughput Sequencing Data to Repetitive Sequences: Piwi’s Genomic Targets Still Not Identified. Developmental Cell 32, 765–771, March 23, 2015, Elsevier.https://doi.org/10.1016/j.devcel.2015.01.013PMID:25805138 10. Lin H., Chen M., Zhong M. and Snyder M., Reassessment of Piwi Binding to the Genome and Piwi
Impact on RNA Polymerase II Distribution. Developmental Cell 32, 772–774, March 23, 2015, Elsevier.
https://doi.org/10.1016/j.devcel.2015.03.004PMID:25805139
11. Watanabe T. and Lin H., Posttranscriptional Regulation of Gene Expression by Piwi Proteins and piR-NAs. Molecular Cell 56, October 2, 2014, Elsevier.
12. Bender A. and Glen R.C. Molecular similarity: a key technique in molecular informatics. Organic &Bio-molecular Chemistry, 2004. 2(22): p. 3204–3218.
13. Ahmed A., Saeed F., Salim N., & Abdo A. (2014). Condorcet and borda count fusion method for ligand-based virtual screening. Journal of cheminformatics, 6(1), 19.
14. Schierz A.C., Virtual screening of bioassay data. Journal of Cheminformatics, 2009. 1: p. 21.https:// doi.org/10.1186/1758-2946-1-21PMID:20150999
15. Kurczab R., Smusz S. and Bojarski A. J. The influence of negative training set size on machine learn-ing-based virtual screening. Journal of Cheminformatics, 2014. 6(1): p. 32.
16. Reynolds C. and Sternberg M. J.,Integrating logic-based machine learning and virtual screening to dis-cover new drugs. Journal of Cheminformatics, 2012. 4(S-1): p. O10.
17. Abdo A., Leclère V., Jacques P., Salim N., & Pupin M. (2014). Prediction of new bioactive molecules using a bayesian belief network. Journal of chemical information and modeling, 54(1), 30–36.https:// doi.org/10.1021/ci4004909PMID:24392938
18. Burden F.R. and Winkler D. A. New QSAR methods applied to structure-activity mapping and combina-torial chemistry. Journal of Chemical Information and Computer Sciences, 1999. 39(2): p. 236–242.
19. Bruce C. L., Melville J. L., Pickett S. D., & Hirst J. D. (2007). Contemporary QSAR classifiers compared. Journal of chemical information and modeling, 47(1), 219–227.https://doi.org/10.1021/ci600332j
PMID:17238267
20. Rogers D. and Hopfinger A. J., Application of genetic function approximation to quantitative structure-activity relationships and quantitative structure-property relationships. Journal of Chemical Information and Computer Sciences, 1994. 34(4): p. 854–866.
21. Jung Y., Shin S. Y., Yong Y., Jung H., Ahn S., Lee Y. H., et al., (2015). Plant-Derived Flavones as Inhib-itors of Aurora B Kinase and Their Quantitative Structure–Activity Relationships. Chemical biology & drug design, 85(5), 574–585.
22. Sheridan R.P. and Kearsley S. K. Why do we need so many chemical similarity search methods? Drug Discovery Today, 2002. 7(17): p. 903–911. PMID:12546933
23. Willett P., Barnard J.M., and Downs G.M. Chemical similarity searching. Journal of Chemical Informa-tion and Computer Sciences, 1998. 38(6): p. 983–996.
24. Willett P., Wilton D., Hartzoulakis B., Tang R., Ford J., & Madge D. (2007). Prediction of ion channel activity using binary kernel discrimination. Journal of chemical information and modeling, 47(5), 1961– 1966.https://doi.org/10.1021/ci700087vPMID:17622131
25. Harper G., Bradshaw J., Gittins J. C., Green D. V., & Leach A. R. (2001). Prediction of biological activity for high-throughput screening using binary kernel discrimination. Journal of Chemical Information and Computer Sciences, 41(5), 1295–1300. PMID:11604029
26. Liu B., Wang S., Long R. and Chou K. C., iRSpot-EL: identify recombination spots with an ensemble learning approach. Bioinformatics Advance Access August 16, 2016.
27. Lavecchia A., Machine-learning approaches in drug discovery: methods and applications. Drug Discov-ery Today, 2015. 20(3): p. 318–331.https://doi.org/10.1016/j.drudis.2014.10.012PMID:25448759 28. Papadatos G., van Westen G. J., Croset S., Santos R., Trubian S., & Overington J. P. (2014). A
docu-ment classifier for medicinal chemistry publications trained on the ChEMBL corpus. Journal of chemin-formatics, 6(1), 40.https://doi.org/10.1186/s13321-014-0040-8PMID:25221627
29. Smusz S., Kurczab R. and Bojarski A. J. A multidimensional analysis of machine learning methods per-formance in the classification of bioactive compounds. Chemometrics and Intelligent Laboratory Sys-tems, 2013. 128: p. 89–100.
30. Bender A., Mussa H. Y., Glen R. C., & Reiling S. (2004). Molecular similarity searching using atom envi-ronments, information-based feature selection, and a naive Bayesian classifier. Journal of chemical infor-mation and computer sciences, 44(1), 170–178.https://doi.org/10.1021/ci034207yPMID:14741025 31. Glick M., Klon A. E., Acklin P., & Davies J. W. (2004). Enrichment of extremely noisy high-throughput
32. Nidhi,†, Glick M., Davies J. W., & Jenkins J. L. (2006). Prediction of biological targets for compounds using multiple-category Bayesian models trained on chemogenomics databases. Journal of chemical information and modeling, 46(3), 1124–1133.https://doi.org/10.1021/ci060003gPMID:16711732 33. Xia X., Maliski E. G., Gallant P., & Rogers D. (2004). Classification of kinase inhibitors using a Bayesian
model. Journal of medicinal chemistry, 47(18), 4463–4470.https://doi.org/10.1021/jm0303195PMID:
15317458
34. Buchwald F., Richter L., and Kramer S., Predicting a small molecule-kinase interaction map: A machine learning approach. Journal of Cheminformatics, 2011. 3: p. 22.https://doi.org/10.1186/1758-2946-3-22
PMID:21708012
35. Cao D. S., Xu Q. S., Liang Y. Z., Chen X., & Li H. D. (2010). Automatic feature subset selection for deci-sion tree-based ensemble methods in the prediction of bioactivity. Chemometrics and Intelligent Labo-ratory Systems, 103(2), 129–136.
36. Krasowski M.D. and Ekins S., Using cheminformatics to predict cross reactivity of" designer drugs" to their currently available immunoassays. Journal of Cheminformatics, 2014. 6(1): p. 22.
37. Stumpfe D. and Bajorath J., Applied virtual screening: strategies, recommendations, and caveats. Vir-tual Screening: Principles, Challenges, and Practical Guidelines, 2011: p. 291–318. (You need the book author (s))
38. Sherhod R., Judson P. N., Hanser T., Vessey J. D., Webb S. J., & Gillet V. J. (2014). Emerging pattern mining to aid toxicological knowledge discovery. Journal of chemical information and modeling, 54(7), 1864–1879.https://doi.org/10.1021/ci5001828PMID:24873983
39. Takigawa I. and Mamitsuka H., Graph mining: procedure, application to drug discovery and recent advances. Drug Discovery Today, 2013. 18(1): p. 50–57.
40. Smusz S., Kurczab R., Satała G., & Bojarski A. J. (2015). Fingerprint-based consensus virtual screen-ing towards structurally new 5-HT 6 R ligands. Bioorganic & medicinal chemistry letters, 25(9), 1827– 1830.
41. Me´tivier J. P., Lepailleur A., Buzmakov A., Poezevara G., Cre´milleux B., Kuznetsov S. O., et al., (2015). Discovering structural alerts for mutagenicity using stable emerging molecular patterns. Journal of chemical information and modeling, 55(5), 925–940.https://doi.org/10.1021/ci500611vPMID:
25871768
42. Malhat, M.G., Mousa, H. M. and El-Sisi., A. B. Clustering of chemical data sets for drug discovery. In Informatics and Systems (INFOS), 2014 9th International Conference on (pp. DEKM-11). IEEE.
43. Pires D.E., Blundell T. L. and Ascher D. B. pkCSM: Predicting Small-Molecule Pharmacokinetic and Toxicity Properties Using Graph-Based Signatures. Journal of Medicinal Chemistry, 2015. 58(9): p. 4066–4072.https://doi.org/10.1021/acs.jmedchem.5b00104PMID:25860834
44. Liu B., Wu H., Zhang D., Wang X., & Chou K. C. (2017). Pse-Analysis: a python package for DNA/RNA and protein/peptide sequence analysis based on pseudo components and kernel methods. Oncotarget, 8(8), p. 13338.https://doi.org/10.18632/oncotarget.14524PMID:28076851
45. Liu B., Wang S., Dong Q., Li S., & Liu X. (2016). Identification of DNA-binding proteins by combining auto-cross covariance transformation and ensemble learning. IEEE transactions on nanobioscience. 15(4), pp.328–334.
46. Chang C.-C. and Lin C. -J. LIBSVM: A library for support vector machines. ACM Transactions on Intelli-gent Systems and Technology (TIST), 2011. 2(3): p. 27.
47. Rogers D. and Hahn M., Extended-connectivity fingerprints. Journal of Chemical Information and Modeling, 2010. 50(5): p. 742–754.https://doi.org/10.1021/ci100050tPMID:20426451
48. Freund, Y. and Schapire, R. E., Experiments with a new boosting algorithm. in Internation Conference on Machine Learning. 1996.
49. Zhang, Z. and X. Xie. Research on adaboost. m1 with random forest. 2nd International Conference on. Computer Engineering and Technology (ICCET) 2010. IEEE.
50. Sammut C. and Webb G. I., Encyclopedia of machine learning. 2011: Springer Science & Business Media.
51. Schneider G., Cle´ment-Chomienne O., Hilfiger L., Schneider P., Kirsch S., Bo¨hm H. J., et al., (2000). Virtual screening for bioactive molecules by evolutionary de novo design. Angewandte Chemie Interna-tional Edition, 39(22), 4130–4133.