Division IX (include assigned division number from I to X)
A STUDY ON THE DURABILITY TEST RESULTS OF THE CONCRETE
USING IN THE N.P.P STRUCTURES
Kyung-Hun Kang1, Myung-Sug Cho2
1 Researcher, Korea Hydro & Nuclear Power Co., KOR
2 Principal Researcher, Korea Hydro & Nuclear Power Co., KOR
ABSTRACT
Nuclear power plant (NPP) concrete structures (including reactor and auxiliary building) are in contact with the shore environment and use the sea water for cooling through the water intake. This environment can result in performance degradation due to the chemical attack, carbonation, and freezing and thawing. The purpose of this study is to compare the durability performance test result of concrete using in the NPP structures. In this study, durability of the concrete was evaluated with respect to Chloride ion penetration, Sulfate resistance, Carbonation, Freezing and Thawing. Chloride Ion penetration test conformed to NT BUILD 492 respectively, Sulfate resistance test conformed to ASTM C 1012, Carbonation test conformed to KS F 2584 and Freezing and Thawing test conformed to ASTM C 666. Blended concretes containing blast furnace slag or fly ash are widely known have improved durability properties in marine environment, with service lives and several times longer than the service life of plain Portland cement concrete. In particular, the trend of durability of blended concretes is reconfirmed by experimental method in this research. In addition, according to test result, as the compressive strength of concrete is increased, the durability is increased too. And the tests show that both fly ash contained concrete and slag contained concrete have similar durability performance.
INTRODUNCTION
Most nuclear power plants around the world are attempting to extend their lifespan, and many of which operate even after their design life. Generally, concrete is excellent in durability when mixing and construction methods are appropriate. However, when exposed to extreme environments for long periods, the durability is degraded and the lifetime of the structure is affected. The facilities of the nuclear power plant can ensure their soundness through replacement during operation or after the designed lifetime. However, concrete structures cannot be replaced easily, so concrete structures must have long-term durability against life extension.
Concrete structure of nuclear power plant adopts durability design reflecting materials, water/binder ratio, compressive strength, cover depth etc according to codes and technical standards. And nuclear power plant operators in Korea perform testing on the resistance to chloride, sulphate, carbonation and freezing and thawing in advance construction in order to ensure the durability of concrete structures.
EXPERIMENTAL METHOD
Durability test was carried out by the accelerated experiment technique for chloride, carbonation, sulphate infiltration and freezing and thawing which are the main factors of the management of domestic nuclear power plant structure.
Table 1: Durability test method
Test Test method Curing specimen size(cm) Chloride NT Build 492
91days
∅10⨯20 Carbonation KS F 2584 ∅10⨯20 Sulphate ASTM C 1012(reference) 15⨯15⨯55 Freezing and thawing ASTM C 666 10⨯10⨯40
Used materials
The cement, aggregate, fly ash and admixtures used in the durability test specimens were the same as those used for nuclear power plant construction. And GGBFS used was one which satisfied the technical standard ASTM C989 Grade100.
Generally, the intake structure of a nuclear power plant uses concrete of 5,000psi strength, and the containment building uses concrete of 6,000psi strength. Therefore, in this study, the durability difference between fly ash and GGBFS was compared between 5,000psi and 6,000psi strength class.
Table 2: Mixed design
Type W/B (%)
Water (Ib)
Cement (Ib)
FA (Ib)
GGBFS (Ib)
Sand (Ib)
Agg. (Ib)
Compresive Strength FA20-5000 40 269 544 136 - 1,222 1,712 5,000psi GGBFS50-5000 40 269 340 - 340 1,222 1,712 5,000psi FA20-6000 40 274 554 139 - 1,279 1,588 6,000psi GGBFS50-6000 40 274 347 - 347 1,279 1,588 6,000psi
Measurement method of Mechanical properties
Compressive strength of concrete was measured according to test method ASTM C39. And cylindrical specimens with ∅100 × 200mm was made to be used in the test. The specimens were demolded within 24 hours after pouring and cured in 20±2℃ water tank. Then, compressive strength was measured by age(1, 3, 7, 28, 56 and 91 days).
The modulus of elasticity and Poisson's ratio of concrete were carried out according to ASTM C469. The specimen of this test was made in the same size as the compressive strength test. Standard curing was carried out until the test, and the magnitude of stress, longitudinal and transverse strains were measured at 91 days when the longitudinal strain was 50/1,000,000 and 40% of the ultimate load was applied.
Measurement method of Chloride migration coefficient
chloride solution (catholyte). Measure the thickness with a slide calliper and read to 0.1 mm. After sawing, brush and wash away any burrs from the surfaces of the specimen, and wipe off excess water from the surfaces of the specimen. When the specimens are surface-dry, place them in the vacuum container for vacuum treatment. Both end surfaces must be exposed. Reduce the absolute pressure in the vacuum container to a pressure in the range of 10–50 mbar (1–5 kPa) within a few minutes. Maintain the vacuum for three hours and then, with the vacuum pump still running, fill the container with the saturated Ca(OH)2 solution so as to immerse all the specimens. Maintain the vacuum for a further hour before allowing air to re-enter the container. Keep the specimens in the solution for 18 ± 2 hours.
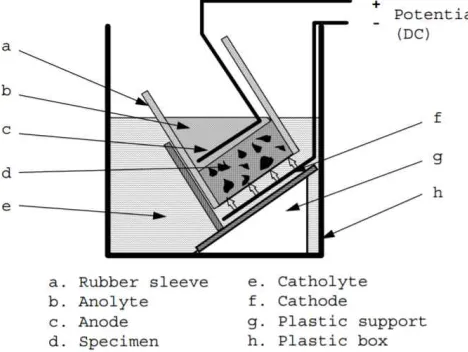
The catholyte solution is 10 % NaCl by mass in tap water and the anolyte solution is 0.3 N NaOH in distilled or de-ionised water. Store the solutions at a temperature of 20–25 °C. Fill the catholyte reservoir with about 12 litres of 10 % NaCl solution. And fit the rubber sleeve on the specimen and secure it with two clamps. Then place the specimen on the plastic support in the catholyte. And fill the sleeve above the specimen with 300 ml anolyte solution. Immerse the anode in the anolyte solution. Connect the cathode to the negative pole and the anode to the positive pole of the power supply.[2] Turn on the power, with the voltage preset at 30 V, and record the initial current through each specimen. Record the initial temperature in each anolyte solution and choose an appropriate test duration according to the initial current. Split the specimen axially into two pieces. Choose the piece having the split section more nearly perpendicular to the end surfaces for the penetration depth measurement, and keep the other piece for chloride content analysis. Spray 0.1 M silver nitrate solution on to the freshly split section. When the white silver chloride precipitation on the split surface is clearly, measure the penetration depth.
Figure 1. Method of chloride migration coefficient
Measurement method of accelerated carbonation
Cylindrical specimens with ∅100 × 200mm was made to be used in this test. Forms should be removed within 16 hours to 36 hours after placing. After the mold is removed, it is cured(at a temperature of 20±2℃, Relative humidity 95%) until 4 weeks. After 4 weeks, the specimens are allowed to stand for 8 weeks in a constant temperature and humidity chamber having a relative humidity of 60±5% and a temperature of 20±2℃. [3]
site shall be five out of the six equal parts on one side.The measurement time is 1, 4, 8, 13, and 26 weeks after the start of the test.
Figure 2. Measurement of accelerated carbonation
Measurement method of Sulfate diffusion coefficient
Three specimens(15cm×15cm×55cm) are cured for 91 days in water and then immersed in sodium sulfate solution. Each litre of solution contain 50.0g of Na2SO4 dissolved in 900mL of water, and it was diluted
with additional distilled or deionized water to obtain 1.0L of solution. [4] The specimens are immersed for 91, 330 days. When the immersion period is over, the solution is removed and a 100mm diameter core is collected from the specimen. Samples were taken at each depth of the core and the sulfur ion concentration is measured by the method for sulfur content by oxidative pyrohydrolytic combustion followed by ion chromatography detection.
Figure 3. method of Sulfate diffusion coefficient
Measurement method of Freezing and thawing
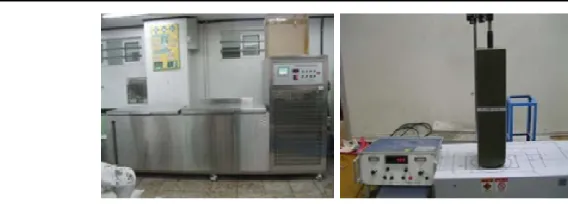
Figure 4. Test equipment of Freezing and thawing
TEST RESULT
Mechanical properties
The compressive strength, elastic modulus and Poisson ratio of the specimens used in this study are as follows.
Table 3: Results of strength, elastic modulus and Poisson ratio
Type Compressive strength (91days, psi)
Elastic modulus (psi)
Poisson ratio
FA20-5000 6,786 4,094,109 0.201 GGBFS50-5000 7,990 4,197,895 0.218 FA20-6000 7,675 4,558,602 0.222 GGBFS50-6000 7,990 4,072,618 0.223
Chloride migration coefficient
The penetration rate of chloride ion over time is generally expressed as a diffusion coefficient, and is used to evaluate the durability life due to chloride corrosion. The test result is as follows.
Table 4: Results of Chloride migration test
Type Chloride migration coefficient (unit: ×10-12 m2/s) FA20-5000 7.15 GGBFS50-5000 5.61 FA20-6000 5.51 GGBFS50-6000 5.01
The greater the strength in all formulations, the lower the penetration rate of the chloride. This is because the amount of the binder increases and the texture of the hardened body becomes dense.
As can be seen from the test results, the chloride ion resistance performance increases with increasing strength and is better when GGBFS is used compared to fly ash.
Carbonation
Table 5: Results of Carbonation test
After 26 weeks, the carbonation depth of all samples was measured to be less than 4 mm. Overall, it was shown that the GGBFS and fly ash concrete have similar carbonation resistance performance.
Sulfate diffusion coefficient
After 91 days of standard curing, The diffusion coefficients of the specimens immersed in aqueous solution were estimated as follows.
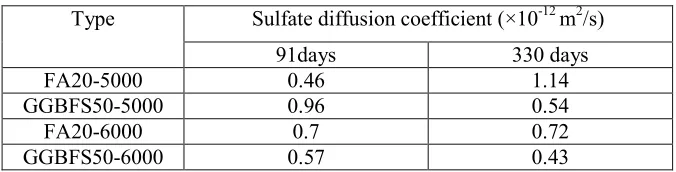
Table 6: Results of Sulfate diffusion test
Type Sulfate diffusion coefficient (×10-12 m2/s)
91days 330 days FA20-5000 0.46 1.14 GGBFS50-5000 0.96 0.54
FA20-6000 0.7 0.72
GGBFS50-6000 0.57 0.43
The GGFBS mixed concrete had a smaller diffusion coefficient than the fly ash mixed concrete, and the diffusion coefficient was smaller at higher strength.
Freezing and thawing
The durability of concrete against freezing and thawing is generally evaluated by the relative dynamic modulus of elasticity, and the relative dynamic modulus of elasticity at the time of significant cracking, which is considered to be the end of the durability life of the concrete, is set at 60%.
Table 7: Results of Freezing and thawing test
Type 0 cycles 90 cycles 180 cycles 270 cycles 300 cycles FA20-5000 100 98.8 94.4 88.8 86.1 BS50-5000 100 97.7 94.4 90.6 89.1 FA20-6000 100 98.9 93.2 87.8 86.9 BS50-6000 100 98.3 94.7 91.4 90.8
As a result of the test, all combinations exceeded the minimum reference value of 60% until 300 cycles. Type 1 week
(mm)
4 weeks (mm)
8 weeks (mm)
13 weeks (mm)
DURABILITY PREDICTION
Chloride penetration resistance performance
ACI Committee 365 model was applied. The chloride ion diffusion coefficient used in the evaluation was the result of the accelerated test conducted in this study. The amount of surface chloride was applied within 250m from the east coast coastline for the conservative evaluation of the suggested values of the domestic concrete standard specification. The critical chloride content was evaluated by applying 1.2%.
Table 8: Service-life prediction using Chloride migration coefficient
Type Service-life prediction(Years)
FA20-5000 210 GGBFS50-5000 263 FA20-6000 267 GGBFS50-6000 292
Carbonation resistance performance
Durability life due to carbonation of concrete can be obtained by the carbonation rate coefficient. The carbonation rate coefficient was calculated using the carbonation depth which was obtained by this study’s tests. The relationship between carbonation depth and velocity coefficient was used in the domestic concrete standard specification. The concentration of carbon dioxide in the atmosphere used in the calculation is 0.03%.
Table 9: Service-life prediction using carbonation rate coefficient
Type Cover depth (mm)
Carbonation rate coefficient
Service-life prediction(Years) FA20-5000 75 0.59 16,090 GGBFS50-5000 75 0.73 10,510 FA20-6000 50 0.40 22,403 GGBFS50-6000 50 0.42 20,320
Sulfate Infiltration Resistance Performance
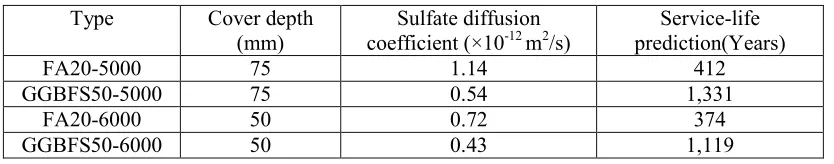
Durability life was calculated using the diffusion coefficient calculated from the long term immersion test. Atkinson(1990)’s sulphate erosion rate model[8] was applied. In the case of external sulfate concentration, the value(1500ppm) given in the ACI standard were applied to calculate the 5,000psi strength used for the water intake structure, and the groundwater measurement value(1900ppm) at the nuclear site were used for the calculation of the 6,000psi strength used in the containment building.
Table 10: Service-life prediction using Sulfate diffusion coefficient
Type Cover depth (mm)
Sulfate diffusion coefficient (×10-12 m2/s)
Service-life prediction(Years)
FA20-5000 75 1.14 412
GGBFS50-5000 75 0.54 1,331
FA20-6000 50 0.72 374
CONCLUSION
For the application of concrete using Ground Granulated Blast Furnace Slag(GGBFS) to the nuclear power plant concrete structures, this study compared the durability evaluation with the concrete using fly ash currently in use. The items of durability evaluation are chloride, carbonation, sulfate attack, freezing and thawing, and the results are as follows.
The accelerated Chloride migration test showed that the concrete using GGBFS was slightly lower than concrete using fly ash. This means that durability against chloride penetration is more advantageous than fly ash when using blast furnace slag. Service-life prediction was calculated using the measured chloride diffusion coefficient, and both of the combinations exceeded 200 years.
The accelerated carbonation test for 26 weeks showed that the carbonation depth of concrete using GGBFS was slightly greater than the carbonation depth of concrete using fly ash. Based on the calculated carbonation rate coefficient, Service-life was predicted to be over 10,000 years for both formulations. Both GGBFS and fly ash showed excellent carbonation resistance.
As a result of accelerated sulfate test, The GGFBS mixed concrete had a smaller diffusion coefficient than the fly ash mixed concrete, and the diffusion coefficient was smaller at higher strength. Service-life prediction was calculated using the measured sulfate diffusion coefficient, and the predicted service life of concrete using GGBFS was estimated to be about three times longer than that of the fly ash. This indicates that the sulfate resistance of t concrete using GGBFS mixed concrete is excellent.
The freezing and thawing test showed that all combinations exceeded the minimum reference value of 60% until 300 cycles.
REFERENCES
KHNP CRI(2016). “Assessment for applicability of concrete using GGBFS(Ground Granulated Blast-Furnace Slag) in the N.P.P structures” Technical Report, KHNP CRI
Nordtest method(1999). “Concrete, mortar and cement-based repair materials : Chloride migration coefficient from non-steady-state migration experiments” NT Build 492
Korean Standards Association(2005). “Standard test method for accelerated carbonation of concrete” KS F 2584
American society for testing materials(2004). “Standard Test Method for Length Change of Hydraulic-Cement Mortars Exposed to a Sulfate Solution” ASTM C 1012
American society for testing materials(2003). “Standard Test Method for Resistance of Concrete to Rapid Freezing and Thawing” ASTM C 666
American society for testing materials(2015). “Standard Test Method for Compressive Strength of Cylindrical Concrete Specimens” ASTM C 39
American society for testing materials(2014). “Standard Test Method for Static Modulus of Elasticity and Poisson’s Ratio of Concrete in Compression” ASTM C 469