Simplification of an MCNP model designed for dose rate
estimation
Alexander Laptev1 and Robert Perry1,2,*
1Los Alamos National Laboratory, P.O. Box 1663, Los Alamos, NM 87545 2Present: GAEA Scientific, 394 Catherine Ave., Los Alamos, NM 87544
Abstract. A study was made to investigate the methods of building a simplified MCNP model for radiological dose estimation. The research was done using an example of a complicated glovebox with extra shielding. The paper presents several different calculations for neutron and photon dose evaluations where glovebox elements were consecutively excluded from the MCNP model. The analysis indicated that to obtain a fast and reasonable estimation of dose, the model should be realistic in details that are close to the tally. Other details may be omitted.
1 Introduction
Gloveboxes are often the subject of radiological engineering design reviews. The Monte Carlo N-Particle transport code, MCNP, [1] is the primary tool used to estimate a worker’s external dose from radiological activities performed in a glovebox. Coding a complete glovebox model is very time consuming. This research provides a technical analysis of the changes in the results following several simplifications of a complete glovebox MCNP model. It provides insight on how to efficiently build a simple glovebox model that adequately describes the problem resulting in considerable savings of time.
2 Original MCNP Model
The glovebox model under discussion is a complex glovebox with several layers of protective shielding (lead and polymethyl methacrylate, PMMA) and water doors underneath it. Both the front and back of the glovebox had three upper and lower workstations with a total of six workstations. Each work station had a single window and two glove ports. Three larger windows were located between the three upper and lower workstations. All the windows were made from leaded glass. The gloves used in the model were leaded. An airlock port was located on both ends of the glovebox.
The model contained four 200 gram plutonium-238 dioxide sources. It was assumed that two sources would be bare plutonium-238 dioxide and these sources were centered in each half of the glovebox. The remaining two sources were encased in steel containers and placed in opposing front corners of the glovebox.
To characterize the radiation field, three torso-sized tallies were used. The three tallies are hereby referred to as Tally #1, Tally #2, and Tally #3. Tally #1 was placed against the center of the bottom row of the middle
workstation at a distance of 1 mm from the additional shielding. Tally #2 was placed in an identical location as Tally #1 with the only difference being Tally #2 was placed 30 cm away instead of 1 mm. Tally #3 was placed against the center of the bottom row of the right workstation at a distance of 1 mm from the additional shielding. Tally #1 matches the most probable worker’s position. The position of Tally #3 was selected to characterize the dose rate at the right workstation (it is the also the same for the left workstation). The dose rate at the right and left workstations is expected to be higher because of the spare source is placed in each front corner of the glovebox.
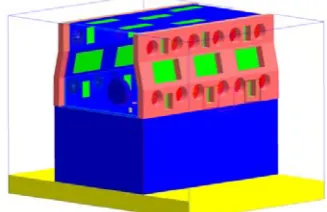
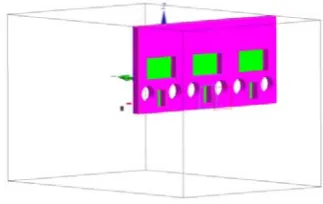
The original model of the glovebox is presented in Fig. 1. The yellow box represents the concrete floor of the room. The steel walls and waters doors of the glovebox are shown in blue with red glove ports (leaded gloves) and green windows. The outer layers of additional shielding (lead, stainless steel, and PMMA) are shown in pink. One of the two bare plutonium-238 oxide sources, which is visible inside of the glovebox, is shown as a small, yellow, horizontal cylinder while one of the two contained sources is shown as a small, grey, vertical cylinder. The numbered, translucent squares are the tallies, and the wire frame represents the universe recognized by MCNP.
As mentioned, the original glovebox model was very complicated. The MCNP input geometry (cell, surface, and transformation cards) consisted of 1071 rows, and the number of lines is roughly proportional to the time
spent by a developer programming. As much as 5·108
neutrons were simulated for the neutron dose rate
calculation and 8.4·109 photons were simulated for the
shown in Table 1. The results have a statistical uncer-tainty of 0.1% for neutrons and 0.5% for photons.
Fig. 1. Original MCNP model. The model includes the additional shielding, the tallies, the concrete floor, the four sources, all of the glovebox, and the water doors. The tallies are numbered. The left side of the glovebox and the additional shielding were removed in the figure to expose the two of the sources contained in the glovebox.
Table 1. Estimated Effective Dose Rates for Iteration 0.
Tally #
Estimated Dose Rates, mrem/hr
Photon Neutron
1 0.302 4.76
2 0.226 2.75
3 0.577 9.97
3 Simplifying Iterations
The simplification of the original model was made in a series of consecutive calculations. The list of calculations along with the number of lines in the MCNP input file are presented in Table 2. At each step in the simplification process the estimated photon and neutron doses are compared to both the original model and the previous calculation.
3.1 Iteration 1: Reduced Outside World Boundaries
For this iteration, the size of the modelled air universe that surrounded the glovebox was reduced (see Fig. 2). The advantage of limiting the universe was that the CPU time was decreased. For example, for the neutrons, CPU time was reduced by 24%. The reduction in CPU time was attributed to particles that escaped the glovebox having fewer interactions outside of the glovebox.
Table 2. Simplifying iterations.
# Description # of MCNP
lines
CPU Time, min
Photon Neutron
0 Original model 1071 44,234 36,506
1 Reduced Outside
World Boundaries 1064 36,234 27,850 2 Single Wall and
Bottom 518 14,359 7,132
3 Single Wall 513 15,874 6,525
4 Simple Single Wall 473 11,612 5,489
5 Removed Upper
Workstations 313 10,937 4,427
6 Removed Gloves 295 9,012 4,586
7 Removed Concrete
Floor 290 8,285 3,221
8 Removed Water
Door 278 9,384 2,972
8*
Additional Iteration: Removed Water Doors with Floor (Comparison with Iteration 6)
283 9,433 3,283
Also the MCNP input file was reduced slightly to 1064 lines by ignoring unnecessary details such as the filter case on the top of the glovebox.
The observed change in the dose rates was less than 0.3% in absolute value (Table 3). The decrease reflected less of a contribution from radiation being scattered off the air surrounding the glovebox towards the tallies. Fig. 3 presents the change in the neutron dose rates, the MCNP input file size, and CPU time observed during current iteration.
Fig. 2. MCNP glovebox model for Iteration 1: Reduced outside world boundaries.
3.2 Iteration 2: Single Wall and Bottom
size of input file down to 518 lines and the CPU time to 7,132 and 14,359 minutes, for neutron and photon doses respectively.
Table 3. Estimated Effective Dose Rates for Iteration 1: Reduced outside world boundaries.
Tally #
Estimated Dose Rates, mrem/hr
Percent Change vs Iteration 0
Photon Neutron Photon Neutron
1 0.302 4.75 -0.0 -0.1 2 0.226 2.74 -0.2 -0.3 3 0.576 9.96 -0.1 -0.1
-25 -20 -15 -10 -5 0 5
C
han
ge per
i
ter
at
ion,
% Tally 1
Tally 2 Tally 3 Tally 1 Tally 2 Tally 3 Change vs detailed model / previous iteration
0 1 2 3 4 5 6 7 8
0 500
1000 MCNP input
MCN
P
i
npu
t
Iteration
0 10000 20000 30000 40000 N
CPU time
C
P
U
ti
me
, mi
nu
te
s
Fig. 3. The change in the neutron dose rates (upper plot) as well as the MCNP input file size and CPU time (lower plot) observed during Iteration #1.
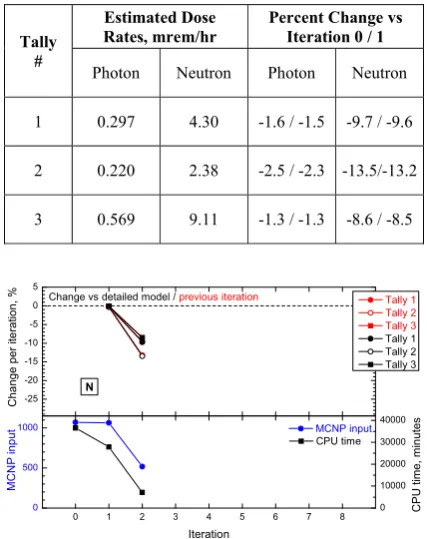
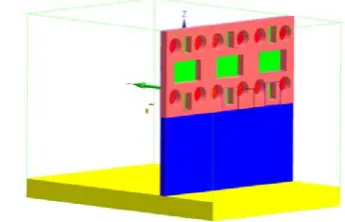
The estimated photon and neutron effective doses and their relative change from both Iteration 0 and Iteration 1 are shown in Table 4. The change in the dose rates was noticeable, especially in the neutron dose rate, which changed approximately 10%. The 10% decrease in the neutron dose rate reflected a missing contribution from neutrons scattering off the thick additional shielding external of the glovebox towards the tallies. Although it was not as prominent, a similar effect was seen for photons. Fig. 5 presents the change in the neutron dose rates, the MCNP input file size, and CPU time observed during current iteration.
Fig. 4. MCNP glovebox model for Iteration 2: Single Wall and Bottom.
Table 4. Estimated Effective Dose Rates for Iteration 2: Single Wall and Bottom.
Tally #
Estimated Dose Rates, mrem/hr
Percent Change vs Iteration 0 / 1
Photon Neutron Photon Neutron
1 0.297 4.30 -1.6 / -1.5 -9.7 / -9.6
2 0.220 2.38 -2.5 / -2.3 -13.5/-13.2
3 0.569 9.11 -1.3 / -1.3 -8.6 / -8.5
-25 -20 -15 -10 -5 0 5
Cha
nge
per i
te
rat
ion
, % Tally 1
Tally 2 Tally 3 Tally 1 Tally 2 Tally 3 Change vs detailed model / previous iteration
0 1 2 3 4 5 6 7 8
0 500
1000 MCNP input
MCNP
i
n
p
u
t
Iteration
0 10000 20000 30000 40000 N
CPU time
C
P
U
time, m
in
u
tes
Fig. 5. The change in the neutron dose rates (upper plot) as well as the MCNP input file size and CPU time (lower plot) observed during Iteration #2.
3.3 Iteration 3: Single Wall
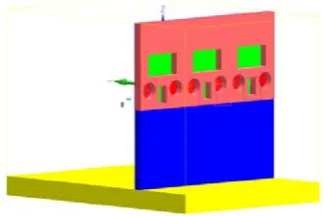
In this iteration, the glovebox bottom was removed from the model, leaving only the front wall (with additional shielding), the front of the water door, the sources, and the concrete floor (see Fig. 6). The size of input file was reduced to 513 lines. The CPU time was decreased by 9% for neutrons but increased by 11% for photons (compare with Iteration 2). The increase in the photons CPU time indicated that some photons, which were attenuated by the bottom of the glovebox in Iteration 2, were traced for a larger number of interactions and, therefore, more CPU time was used.
The estimated photon and neutron effective doses and their relative change from both Iteration 0 and Iteration 2 are shown in Table 5. Once again, the change in the neutron dose rate was nearly 10%. The noticeable change in the neutron dose rate reflected a missing contribution from neutrons being scattered off the bottom of the glovebox. This effect was similar to the removal of the thick additional shielding in Iteration 2.
scatter off the air and concrete floor since they were not attenuated by the bottom of the glovebox. Fig. 7 presents the change in the neutron dose rates, the MCNP input file size, and CPU time observed during current iteration.
Fig. 6. MCNP glovebox model for Iteration 3: Single Wall.
Table 5. Estimated Effective Dose Rates for Iteration 3: Single Wall.
Tally #
Estimated Dose Rates, mrem/hr
Percent Change vs Iteration 0 / 2
Photon Neutron Photon Neutron
1 0.287 3.85 -5.2 / -3.7 -19.1/-10.3
2 0.234 2.31 3.7 / 6.4 -16.1/-3.1
3 0.558 8.31 -3.3 / -2.0 -16.7/-8.8
-25 -20 -15 -10 -5 0 5
Ch
an
ge
per it
er
a
tion
, % Tally 1
Tally 2 Tally 3 Tally 1 Tally 2 Tally 3 Change vs detailed model / previous iteration
0 1 2 3 4 5 6 7 8
0 500
1000 MCNP input
MCN
P
in
pu
t
Iteration
0 10000 20000 30000 40000 N
CPU time
C
P
U
tim
e, m
inu
tes
Fig. 7. The change in the neutron dose rates (upper plot) as well as the MCNP input file size and CPU time (lower plot) observed during Iteration #3.
3.4 Iteration 4: Simple Single Wall
In this iteration, the front wall was simplified by replacing the complex, angled wall with a straight, simple wall (see Fig. 8). This iteration reduced the size of input file to 473 lines, and decreased the CPU time for neutrons by 16% and for photons by 27% (compare with Iteration 3).
The estimated photon and neutron effective doses and their relative change from both Iteration 0 and Iteration 3 are shown in Table 6. The observed changes
in dose rates were negligible compared to the previous iteration, allowing a conclusion to be drawn that geometrical particularities, such as a curvature, are not essential to the model. Fig. 9 presents the change in the neutron dose rates, the MCNP input file size, and CPU time observed during current iteration.
Fig. 8. MCNP glovebox model for Iteration 4: Simple Single Wall.
Table 6. Estimated Effective Dose Rates for Iteration 4: Simple Single Wall.
Tally #
Estimated Dose Rates, mrem/hr
Percent Change vs Iteration 0 / 3
Photon Neutron Photon Neutron
1 0.286 3.86 -5.3 / -0.1 -19.1 / 0.1
2 0.233 2.32 3.3 / -0.4 -15.6 / 0.6
3 0.558 8.31 -3.3 / 0.0 -16.7/0.0
-25 -20 -15 -10 -5 0 5
Cha
nge per
i
ter
at
ion,
% Tally 1
Tally 2 Tally 3 Tally 1 Tally 2 Tally 3 Change vs detailed model / previous iteration
0 1 2 3 4 5 6 7 8
0 500
1000 MCNP input
M
C
NP
i
npu
t
Iteration
0 10000 20000 30000 40000 N
CPU time
CP
U time
, min
ut
e
s
Fig. 9. The change in the neutron dose rates (upper plot) as well as the MCNP input file size and CPU time (lower plot) observed during Iteration #4.
3.5 Iteration 5: Removed Upper Workstations
The estimated photon and neutron effective doses and their relative change from both Iteration 0 and Iteration 4 are shown in Table 7. Like the previous iteration, there was little change in either the photon or neutron dose rates. This proved that the location of the tallies was sufficiently far from the upper work stations to minimize the contribution from radiation that penetrated the top of the glovebox or that passed through the upper workstations. Fig. 11 presents the change in the neutron dose rates, the MCNP input file size, and CPU time observed during current iteration.
Fig. 10. MCNP glovebox model for Iteration 5: Removed Upper Workstations.
Table 7. Estimated Effective Dose Rates for Iteration 5: Removed Upper Workstations.
Tally #
Estimated Dose Rates, mrem/hr
Percent Change vs Iteration 0 / 4
Photon Neutron Photon Neutron
1 0.286 3.85 -5.3 / -0.0 -19.0 / -0.0
2 0.232 2.31 2.9 / -0.4 -16.2 / -0.7
3 0.558 8.31 -3.3 / -0.0 -16.7/-0.0
-25 -20 -15 -10 -5 0 5
C
han
ge per
i
ter
at
ion,
% Tally 1
Tally 2 Tally 3 Tally 1 Tally 2 Tally 3 Change vs detailed model / previous iteration
0 1 2 3 4 5 6 7 8
0 500
1000 MCNP input
MC
NP
in
p
u
t
Iteration
0 10000 20000 30000 40000 N
CPU time
C
P
U
ti
me
, mi
nu
te
s
Fig. 11. The change in the neutron dose rates (upper plot) as well as the MCNP input file size and CPU time (lower plot) observed during Iteration #5.
3.6 Iteration 6: Removed Gloves
This iteration removed the leaded gloves from the lower glove ports (see Fig. 12). This simplification reduced the input file to 295 lines. The CPU time for neutrons was increased by 4% while for photons it reduced by 18% (compare with Iteration 5).
The estimated photon and neutron effective doses and their relative change from both Iteration 0 and Iteration 5 are shown in Table 8. Observations showed that the change in the neutron dose rate was minimal but the photon dose rate increased significantly. The photon dose rate increase was the result of a significant contribution of low-energy photons (energy less than 25 keV) emitted by the unshielded sources. Although the obtained result for photon dose is technically correct for the current MCNP model, it is not practical. In a real situation, those low-energy photons are easily attenuated by items like a source container, gloves, etc. Fig. 13 presents the change in the neutron dose rates, the MCNP input file size, and CPU time observed during current iteration.
Fig. 12. MCNP glovebox model for Iteration 6: Removed Gloves.
Table 8. Estimated Effective Dose Rates for Iteration 6: Removed Gloves.
Tally #
Estimated Dose Rates, mrem/hr
Percent Change vs Iteration 0 / 5
Photon Neutron Photon Neutron
1 0.495 3.89 64 / 73 -18.4 / 0.8
2 0.926 2.32 310 / 299 -15.8 / 0.5
3 0.759 8.31 32 / 36 -16.6 / 0.1
3.7 Iteration 7: Removed Floor
-25 -20 -15 -10 -5 0 5
Ch
ang
e pe
r i
te
rat
io
n,
% Tally 1
Tally 2 Tally 3 Tally 1 Tally 2 Tally 3 Change vs detailed model / previous iteration
0 1 2 3 4 5 6 7 8
0 500
1000 MCNP input
MCN
P in
pu
t
Iteration
0 10000 20000 30000 40000 N
CPU time
C
P
U t
ime
, mi
nut
es
Fig. 13. The change in the neutron dose rates (upper plot) as well as the MCNP input file size and CPU time (lower plot) observed during Iteration #6.
The estimated photon and neutron effective doses and their relative change from both Iteration 0 and Iteration 6 are shown in Table 9. Removing the concrete floor produced an effect similar to the removal of the back, sides, and top of the glovebox and additional shielding in Iteration 2. The decrease in the dose rates was less than that observed in Iteration 2 because the distance between the tallies and the floor was greater than the distance between the tallies and the back, sides, and top of the glovebox and the additional shielding that was removed in Iteration 2. In addition, the magnitude of the decrease in the neutron dose rate was not as pronounced because concrete is not as effective moderator as PMMA. Fig. 15 presents the change in the neutron dose rates, the MCNP input file size, and CPU time observed during current iteration.
Fig. 14. MCNP glovebox model for Iteration 7: Removed Floor.
Table 9. Estimated Effective Dose Rates for Iteration 7: Removed Floor.
Tally #
Estimated Dose Rates, mrem/hr
Percent Change vs Iteration 0 / 6
Photon Neutron Photon Neutron
1 0.491 3.75 63 / -0.7 -21.3 / -3.6
2 0.923 2.23 309 / -0.3 -19.0 / -3.8
3 0.756 8.20 31 / -0.4 -17.7 / -1.3
-25 -20 -15 -10 -5 0 5
C
h
an
ge
pe
r i
te
ra
ti
o
n
, % Tally 1
Tally 2 Tally 3 Tally 1 Tally 2 Tally 3 Change vs detailed model / previous iteration
0 1 2 3 4 5 6 7 8
0 500
1000 MCNP input
MCNP i
n
pu
t
Iteration
0 10000 20000 30000 40000 N
CPU time
C
P
U
tim
e, m
inu
tes
Fig. 15. The change in the neutron dose rates (upper plot) as well as the MCNP input file size and CPU time (lower plot) observed during Iteration #7.
3.8 Iteration 8: Removed Water Door
The water door was removed in this iteration (see Fig. 16). This reduced the size of the input file to 278 lines. The CPU time for neutrons was increased by 10% (compare with Iteration 7).
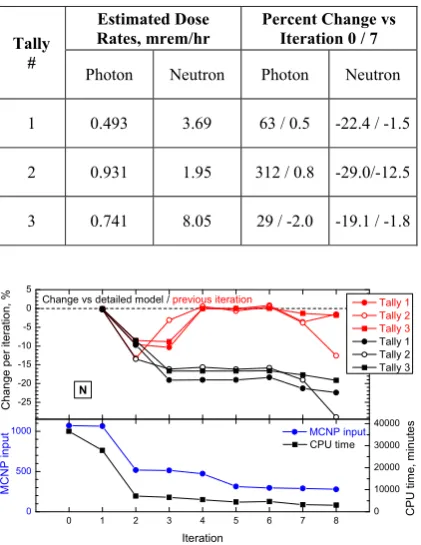
The estimated photon and neutron effective doses and their relative change from both Iteration 0 and Iteration 7 are shown in Table 10. There was little change in the dose rates compared with the previous iteration, except the neutron dose rate was 12.5% less in Tally #2. The decrease in the neutron dose rate in Tally #2 upon the removal of the water door was an indicator that the geometry had been over-simplified. It should be noted that although the MCNP results for this iteration are correct, they are not realistic. Both the concrete floor and the water door scattered neutrons, allowing more neutrons to be sent in the direction of the tallies. Tallies #1 and 3 were too close to have additional neutrons scattered in their direction but Tally #2 was sufficiently far enough from the glovebox to have additional neutrons scattered into it from both the concrete floor and the water door. Fig. 17 presents the change in the neutron dose rates, the MCNP input file size, and CPU time observed during current iteration.
Fig. 16. MCNP glovebox model for Iteration 8: Removed Water Door.
3.9 Additional Iteration: Removed Water Doors with Floor (Comparison with Iteration 6)
Iteration 6 was taken as a starting point and the water door was removed from it. The computational model for this additional iteration is presented in Fig. 18. The size of the input file was 283 lines. The CPU time for neutrons was decreased by 28% and for photons was increased by 5% (compare with Iteration 6).
Table 10. Estimated Effective Dose Rates for Iteration 8: Removed Water Door.
Tally #
Estimated Dose Rates, mrem/hr
Percent Change vs Iteration 0 / 7
Photon Neutron Photon Neutron
1 0.493 3.69 63 / 0.5 -22.4 / -1.5
2 0.931 1.95 312 / 0.8 -29.0/-12.5
3 0.741 8.05 29 / -2.0 -19.1 / -1.8
-25 -20 -15 -10 -5 0 5
Cha
n
g
e
pe
r i
teratio
n, % Tally 1
Tally 2 Tally 3 Tally 1 Tally 2 Tally 3 Change vs detailed model / previous iteration
0 1 2 3 4 5 6 7 8
0 500
1000 MCNP input
MCNP i
n
p
u
t
Iteration
0 10000 20000 30000 40000 N
CPU time
C
P
U
tim
e, m
in
u
te
s
Fig. 17. The change in the neutron dose rates (upper plot) as well as the MCNP input file size and CPU time (lower plot) observed during Iteration #8.
The estimated photon and neutron effective doses and their relative change from both Iteration 0 and Iteration 6 are shown in Table 11. As expected, both the photon and neutron dose rates increased when the water door was removed. This increase can be explained by an extra contribution of particles being scattered off the floor and being collected by the tallies. The most significant change was induced in Tally #2. Which was the expected result considering that this Tally is more exposed to the radiation scattered off the floor than other tallies.
4 Summary
A summary of the effects on the dose rates from the various simplifications is presented in Fig. 19 for neutrons and Fig. 20 for photons. The summary of the MCNP input file size and the CPU time is shown in Table 1.
Fig. 18. MCNP glovebox model for the Additional Iteration: Removed Water Doors with Floor (Comparison with the Iteration 6).
Table 11. Estimated Effective Dose Rates for the Additional Iteration: Removed Water Doors with Floor (Comparison with
the Iteration 6).
Tally #
Estimated Dose Rates, mrem/hr
Percent Change vs Iteration 0 / 6
Photon Neutron Photon Neutron
1 0.529 4.22 75 / 6.9 -11.3 / 8.7
2 0.990 2.78 338 / 6.9 1.2 / 20.2
3 0.775 8.50 34 / 2.1 -14.8 / 2.2
The analysis indicated that even the most simplified glovebox model doesn’t result in a crucial deviation from the results obtained with a complex model. It was found that the iterations 2, 3, and the additional iteration from Section 3.9 produced the largest change in the estimated doses (excluding iteration 6 for photons when there was nothing between sources and tallies but atmospheric air). That change was about 10% per iteration for neutrons and up to 5% for photons.
The total change in neutron dose rates between the simple and complex model ranged from 20 to 30% and for photons was about 5% (excluding 6 and subsequent iterations). Also the additional iteration (Section 3.9) demonstrated that some changes may compensate changes accumulated over other simplifying iterations. The main conclusion from the analysis is that it is possible to get a reasonable estimate of the anticipated dose rates using a simplified MCNP model. The level of the simplification can be selected based on the acceptable uncertainties in calculated dose rates.
The list below summarizes the findings of this exercise:
x A reduced outside world boundaries do not
change the dose rates.
x Removing any additional bulky shielding placed
x Adding complex geometry, such as curvatures, to windows, walls, etc. does not sufficiently influence either the photon or neutron dose rates.
x Adding structural details, which are sufficiently
far from tally (like upper workstations in the model under consideration), does not influence either the photon or neutron dose rates.
x To avoid the significant contribution to the
photon dose rate from low-energy photons, always place a material between the source and tally.
A good rule of thumb is start with the simplest approach. Complexity may be added to increase the accuracy of the model if the dose rates exceed or are close to the design limits.
-25 -20 -15 -10 -5 0 5 10 15 20
Cha
nge
pe
r iteration
, % Tally 1
Tally 2 Tally 3 Tally 1 Tally 2 Tally 3 Change vs detailed model / previous iteration
N
0 1 2 3 4 5 6 7 8 9
0 500
1000 MCNP input
MCNP inp
ut
Iteration
8* 0 10000 20000 30000 40000
CPU time
C
P
U
time
, min
ute
s
Fig. 19. Summary of the change in the neutron dose rates from the course of consequent iterations on the glovebox model simplification (upper plot) as well as a summary of the MCNP input file size and CPU time (lower plot). The additional iteration (Section 3.9) is marked as “8*”. Dashed lines represent a tendency of the change in the dose rates of this iteration after Iteration #6.
-10 -5 0 5 10 100
Ch
an
g
e
pe
r it
eratio
n
, % Tally 1
Tally 2 Tally 3 Tally 1 Tally 2 Tally 3
Ph
0 1 2 3 4 5 6 7 8 9
0 500 1000
Change vs detailed model / previous iteration
MCNP input
MC
NP in
pu
t
Iteration
0 10000 20000 30000 40000
8* CPU time
C
P
U tim
e
, m
in
u
te
s
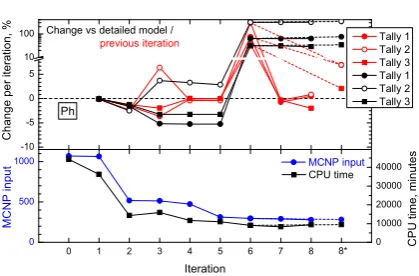
Fig. 20. Summary of the change in the photon dose rates from the course of consequent iterations on the glovebox model simplification (upper plot) as well as a summary of the MCNP input file size and CPU time (lower plot). The additional iteration (Section 3.9) is marked as “8*”. Dashed lines represent a tendency of the change in the dose rates of this iteration after Iteration #6.
5 Conclusion
The analysis indicated that most of the particle fluence across the tallies penetrated the front wall of the glove-box. Thus to obtain a fast and reasonable estimation of
dose, the model should be realistic in details that are close to the tally. Other details may be omitted.
Acknowledgment
This work was conducted while in the LANL Group RP-PROG. We wish to acknowledge the contributions made by the group members: J.M. Bean, C.J. Bianconi, M.A. Griffin, L.D. Hetrick, P.S. Hoover, B.T. Keller, G.R. Murrell, and R.C. Rangel.
Reference
1. X-5 Monte Carlo Team, MCNP – A General Monte