Discrete Modelling of Compaction of Non-spherical Particles
Yi He1, Tim J. Evans2, Aibing Yu1,3, Runyu Yang1,*
1 School of Materials Science and Engineering, University of New South Wales, Sydney, 2052, Australia 2 Rio Tinto Iron Ore Group, Australia
3 Department of Chemical Engineering, Monash University, Clayton, 3900, Australia
Abstract. Compaction behaviour and mechanical response of a compact show strong dependence on particle shape. In this study, a numerical model based on the discrete element method (DEM) was developed to study the compaction behaviour of spheroidal particles. In the model, particle shape was approximated by gluing multiple spheres together. A bonded particle model was adopted to describe interparticle bonding force. The DEM model was first validated by comparing the properties of packing of spheroids (packing density, coordination number) with literature data and then applied to both die compaction and unconfined compression. In die compaction, the effect of aspect ratio on the densification was mainly due to the difference in the initial packing. In unconfined compression, the increase in compressive strength with increasing aspect ratio was attributed to the increase in the number of interparticle bonding. The findings facilitate a better understanding of the relation of particle shape to the compaction behaviour and compact strength.
1 INTRODUCTION
Compaction of particles has wide applications in industries. The physico-mechanical properties of a compact are critical to the performance of the compact in the after-compaction operations, such as storage, transportation and sintering. It is therefore important to understand the relationship between consolidation pressure and compact properties, including compact density and compact strength [1].
The macroscopic property of a compact is a collective outcome of the microscopic interactions between particles. For this purpose, the discrete element method (DEM) offers an efficient way to obtain micro-mechanical insight into its behaviour as it treats particles individually and explicitly considers the particle characteristics, material properties and the inter-particle forces. DEM has been adopted to investigate particle compaction, such as the effect of mechanical properties of particles [2, 3], particle-wall friction induced inhomogeneity [4], evolution of compact structure [5] and the effects of moisture, particle shape and particle size [6-8]. Recently we conducted a DEM study of the compressive strength of iron ore compacts using a bonded particle model [16]. The simulated stress-strain responses were comparable with those observed from the physical experiments.
Particles in real processes, however, are often non-spherical. It has been demonstrated that particle shape has a strong influence on the mechanical behaviour particle packing [9, 10] and flow [11]. For example, in
the biaxial compression of elliptical particles, much larger strength was observed compared to that of disk-shaped particles [12]. Ting et al. [13] observed that the shear strength of a 2D assembly of ellipse shaped particles increased with particle angularity. The enhanced shear strength was attributed to the rolling resistance provided by particle interlocking. Chung and Ooi [14] obtained a better agreement with experimental results in the bulk response when the particle shape was considered under confined compression. Recently, Wiacek et al. [15] observed that the vertical pressure transfer was sensitive to the aspect ratio of elongated particles in the uniaxial compression. However, little effort has been devoted to investigating the mechanical response and strength of non-spherical particle compacts under the unconfined axial compression.
This study is to develop a DEM model to study the compaction of spheroid particles, mainly focusing on the effect of particle shape on compact density and strength. Particle geometry is modelled using a multi-sphere approach. The model is firstly validated against the packings of analytical shaped spheroids and then extended to study their behaviour in the die and unconfined compactions. Both the bulk behaviour and microstructure will be analysed.
2 Model description and simulation
conditions
For a non-spherical particle i of mass mi and inertial
tensor Ii, its translational motion is defined based on its mass centre and its rotational motion obeys the Euler equations in body-fixed coordination system, given by,
g F v i i i i m dt d
m (1)
i
i i i i i
d
dt u u
I I M (2)
where vi and Zi are, respectively, the translational and
angular velocity with respect to the mass centre. Fi is the sum of all externally applied forces acting on the particle, which include in this work the normal contact force Fijn, tangential contact force
t ij
F , capillary force
cap ij
F (for wet particles) and the bonding force
F
ijb (whena bond is present between particles). g is the gravity acceleration. Mi is the total moment on the particle, including the moment caused by tangential force and the moment induced by the tangential bonding force and bond bending/torsion.
Table 1 lists the force equations used in this work. The details can be found in our previous study [16].
Table 1 Equations used to calculate forces in this work.
Force Equation Normal contact
force Fijn
* *1 2 3 2
*
4 3 y
y y y y
E R
F p R
G G G
S G G G G
° ® t °¯ Tangential force t ij F
1.5 ,max ,max min ,1 1 s s
n s ij
s
F [ [
P [ ª § · º « ¨ ¸ » « ¨© ¸¹ » « » ¬ ¼ Capillary force cap ij F
* * 2 * 2 cos ( )1 1 [ 1 2 ]
4 cos ( ) 1 c L c L R P P V R S S
R
P W S R V
S J T
S
S J T
S ° °° ® ° ° °¯ Particle bonding force b
ij
F
^ ` ^ `^ `
'F K 'x
2.2 Simulation conditions
In this work, the packing and compaction of ellipsoidal particles were simulated.
A simulation started with the random generation of particles without overlap inside a cylindrical container. Random orientations of the particles were introduced by assigning different initial values to their Euler angles. After the packing was formed, the upper punch then moved downward at a constant velocity to compress the particles till the compact reached the desired packing density. It then moved upward till it was separated from the compact top surface. The bonding forces were introduced between the contacting particles after a short period of relaxation (1s). The unconfined compression
was conducted by removing the cylindrical wall and move the top punch downward.
Table 2 shows the properties of particle and bond used in present work. The values of the properties were determined by calibrating the simulation results with experiments of compaction of iron ore powders [16]. With these values, the simulations were able to reproduce similar compaction curves in the die and unconfined compaction to those observed in the experiments (Fig. 1).
Table 2 Parameters used for simulation.
Parameter Value Container diameter, D (m) 0.5
Particle number, N 30000
Equivalent diameter, d (m) 0.01
Particle density, ȡ (kg·m-3) 5.17×10³
Young’s modulus, Y (GPa) 9 Yield pressure, py (MPa) 300
Poisson ratio, Ȟ 0.29
Interparticle friction coefficient, ȝpp 0.3
Particle-wall friction coefficient,ȝpw 0.1
Bond-area multiplier, 0.68
Young’s modulus of bond, Yb(MPa) 200
Bond stiffness ratio, kn/kt 1.0
Bond strength, ıb(MPa) 15
(a)
(b)
A multi-sphere approach [17] was adopted to approximate the geometry of the spheroids. In this approach, a spheroidal particle was approximated by combining a number of overlapping primary spheres of different sizes. The spheroids have various aspect ratios from 0.2 to 3.0 to cover spheroids from oblate to prolate. The shapes were selected such that the comparison can be performed with a previous study using [18]. Fig. 2 shows the representative particle shapes in the study.
(a) (b)
(c) (d)
Fig. 2 Representative ellipsoidal particles of different aspect ratios: (a), 0.2; (b), 0.4; (c), 2.0; and (d), 3.0.
3 Results and Discussion
3.1 Particle packing and model validation
Fig. 3 shows the packed beds for three different aspect ratios of spheroids. The validity of the model was tested against a previous DEM simulation of ellipsoids packing with analytical shape [18].
(a) (b) (c)
Fig. 3. Final packing of ellipsoids with aspect ratios of: (a) 0.2; (b) 2.0; and (c) 3.0.
Fig. 4(a) shows that variations of packing density with the aspect ratio. Here, the packing density was calculated from the region 3d away from the wall to minimise the wall effect. The figure shows that packing density increases with the aspect ratio and reaches a maximum at a ratio of 0.75. It then decreases with increasing aspect ratio and has a minimum when the ratio is 1 (packing of spheres). There is another peak for the prolate particles at an aspect ratio of 2. The comparison shows that the current model is able to reproduce results consistent to the previous study [18].
Fig. 4(b) shows the variation of mean coordination number (CN) with the aspect ratio. In this work only the contacted particles are counted. The mean CN appears to be the lowest for spherical particles and rises sharply with small deviations. Again, the general trends of the mean CN evolving with the aspect ratio is consistent with those reported earlier [18], thus validating the
current model.
(a)
(b)
Fig. 4. Validations of (a) packing density and (b) mean coordination number with respect to aspect ratio.
3.2 Die compaction
Fig. 5 plots the variation of consolidation pressure for die compaction of different shapes of particles, showing a strong dependence on particle aspect ratio. The difference in the slope of the loading curves is related to the particle orientation which makes the vertical fore transmission more efficient for particles of larger aspect ratios [18]. In particular, the effect on initial packing density is more pronounced than that of the overall deformation. So the variation in pressure is due to the difference in the initial packing density.
In Fig. 6, both initial packing density and compact density after unloading are plotted against the aspect ratio. The general trend for the initial packing density is very similar to those obtained during packing as shown in Fig. 5 except for a relatively lower magnitude due to the boundary effect [19]. The overall trend of density variation persists after the unloading, which further demonstrates that difference in the overall compressibility is mainly due to the difference in initial packing density.
Fig. 6 also illustrates the consolidation pressure achieved by compressing the samples to a density of 0.7. As the particle aspect ratio increases, the consolidation pressure first decreases to the minimum at the aspect ratio of 1.6 and then increases with further increase in the particle aspect ratio.
Fig. 6. Packing density variation with the aspect ratio.
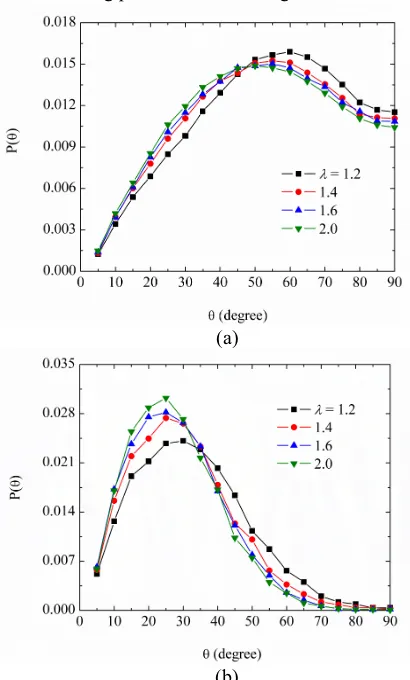
The angular distribution of the force illustrates the anisotropy of the compact. Recent studies have shown that the spatial distribution of the normal contact force can be divided into two subnetworks: large and small forces [20]. As the large forces are mainly contribute to the compact stiffness, so it would be interesting to characterise the angular distribution of the large forces within the compact. Fig. 7 shows the angular distributions of all and large normal contact forces at the end of die compaction. Here the large forces are defined as those with magnitudes 3 times the mean force.
The angular distribution of all the normal contact forces (Fig. 7(a)) shows a peak between 40o and 70o for all the
cases. It demonstrates the anisotropic nature of the force network. As the particle aspect ratio increases, the peak of the distribution gradually shifts left. Also, the proportion of the horizontally aligned forces decreases with increasing particle aspect ratio. Therefore, the anisotropy of the force network increases as the aspect ratio increases.
Fig. 7(b) shows the angular distribution of the large forces, which is clearly different from those of all the contact forces. The large forces tend to align along the vertical direction (compression direction). Furthermore, the influence of the compression on the alignment of the large forces become more significant as the particle
aspect ratio is increases as reflected by the left-shifting and increasing peak value of the angular distributions.
(a)
(b)
Fig. 7. Angular distributions of (a), all normal contact force; and (b), large forces with f > 3.0.
3.3 Unconfined compression
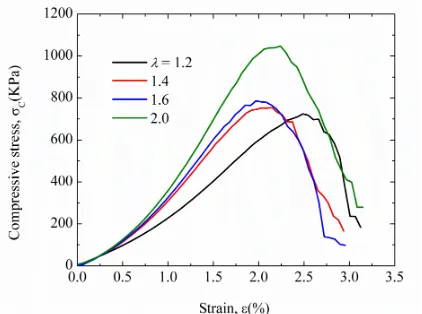
Fig. 8 shows the evolution of compressive stress plotted against the axial strain for the compacts subject to the unconfined compression. It can be seen that all the cases produced a pronounced peak in the compressive stress, followed by stress softening during compression. It is evident that particle aspect ratio affects the macroscopic behaviour of compact significantly as reflected by the loading stiffness as well as the axial strain at the peak stress. In contrast, the post-peak stress response is more or less independent on the variation in particle aspect ratio as indicated by the largely paralleled stress curve after peak stress.
compact without changing much the geometrical integrity of the rest part. In contrast, more complicated and dispersed failure patterns are observed for larger aspect ratios. This variation maybe related to the increased rotational resistance, which reduces the likelihood of shear-induced bond breakage during unconfined compression.
Fig. 8. Comparison of stress-strain relationships during unconfined compression test for different particle aspect ratios.
Fig. 9. Failure patterns of compacts of particles with different aspect ratios: (a), 1.2; (b), 1.6; and (c), 2.0. The particles are colour-coded by their angular velocities.
Fig. 10 shows the compressive strength, the peak stress during unconfined compression, as a function of particle aspect ratio. Despite of a non-monotonic relationship between packing density and aspect ratio, compressive strength is found to increase rapidly as the aspect ratio is increased above the value of 1.6.
Fig. 10. Compressive strength as a function of particle aspect ratio.
4. Conclusions
The multi-sphere method was incorporated into the DEM to study the packing and compaction process of ellipsoidal particles. Validation was carried out based on packing of spheroidal particles. The developed model was further applied to die compaction and unconfined compression on the spheroidal particles. The main results are summaries below,
x The relationship between packing properties and aspect ratio is consistent with the DEM results of analytical shape representation.
x For ellipsoid compaction, difference in overall compressibility is mainly due to the difference in initial packing density. As the aspect ratio increases, consolidation pressure first decreases to a minimum at the aspect ratio of 1.6 and then increases.
x For unconfined compression of ellipsoidal particles, the mechanical response shows strong dependence on particle aspect ratio. Compressive strength increases rapidly as the aspect ratio above the value of 1.6.
The authors are grateful to the Australian Research Council and Rio Tinto Iron Ore group for financial support of this work.
References
1. M. Abdel-Ghani, J. G. Petrie, J. P. K. Seville, R. Clift and M. J. Adams, Powder Technology 65 (1-3), 113-123 (1991).
2. A. Samimi, A. Hassanpour and A. Ghadiri, Chem Eng Sci 60 (14), 3993-4004 (2005).
3. A. Hassanpour and M. Ghadiri, Powder Technology 141 (3), 251-261 (2004).
4. Y. Y. Foo, Y. Sheng and B. J. Briscoe, International Journal Of Solids And Structures 41
(21), 5929-5943 (2004).
5. Y. Sheng, C. J. Lawrence, B. J. Briscoe and C. Thornton, Eng Computation 21 (2-4), 304-317 (2004).
6. O. Skrinjar and P. L. Larsson, Particul Sci Technol
30 (4), 364-377 (2012).
7. O. Skrinjar and P. L. Larsson, Comput. Mater. Sci.
31 (1-2), 131-146 (2004).
8. S. C. Thakur, H. Ahmadian, J. Sun and J. Y. Ooi, Particuology 12, 2-12 (2014).
9. F. X. Villarruel, B. E. Lauderdale, D. M. Mueth and H. M. Jaeger, Physical Review E 61 (6), 6914-6921 (2000).
10. A. Donev, I. Cisse, D. Sachs, E. Variano, F. H. Stillinger, R. Connelly, S. Torquato and P. M. Chaikin, Science 303 (5660), 990-993 (2004). 11. P. W. Cleary and M. L. Sawley, Appl. Math.
Model. 26 (2), 89-111 (2002).
12. L. Rothenburg and R. J. Bathurst, Geotechnique 42
(1), 79-95 (1992).
13. J. M. Ting, L. Meachum and J. D. Rowell, Eng Computation 12 (2), 99-108 (1995).
14. Y. C. Chung and J. Y. Ooi, Modern Trends in Geomechanics 103, 223-239 (2006).
15. J. Wiacek, M. Molenda, J. Horabik and J. Y. Ooi, Powder Technol 217, 435-442 (2012).
16. Y. He, Z. Wang, T. J. Evans, A. B. Yu and R. Y. Yang, Int J Miner Process (2015).
17. J. F. Favier, M. H. Abbaspour-Fard, M. Kremmer and A. O. Raji, Engineering Computations 16 (4), 467-480 (1999).
18. Z. Y. Zhou, R. P. Zou, D. Pinson and A. B. Yu, Ind Eng Chem Res 50 (16), 9787-9798 (2011).
19. R. P. Zou and A. B. Yu, Chem Eng Sci 50 (9), 1504-1507 (1995).
20. F. Radjai, D. E. Wolf, M. Jean and J. J. Moreau, Phys Rev Lett 80 (1), 61-64 (1998).
21. J. P. Bardet and J. Proubet, Geotechnique 41 (4), 599-613 (1991).
22. N. Hu and J. F. Molinari, J. Mech. Phys. Solids 52
(3), 499-531 (2004).
23. C. Thornton and L. Zhang, Philos Mag 86 (21-22), 3425-3452 (2006).
24. A. Mohamed and M. Gutierrez, Granul Matter 12
(5), 527-541 (2010).

![Fig. 3 shows the packed beds for three different aspect ratios of spheroids. The validity of the model was tested against a previous DEM simulation of ellipsoids packing with analytical shape [18]](https://thumb-us.123doks.com/thumbv2/123dok_us/8144284.1357682/3.595.322.525.93.428/different-spheroids-validity-previous-simulation-ellipsoids-packing-analytical.webp)