P R O C E E D I N G S
Open Access
Pathway analysis for genetic association studies:
to do, or not to do? That is the question
Line Dufresne
1, Karim Oualkacha
2, Vincenzo Forgetta
3, Celia MT Greenwood
1,3,4*From
Genetic Analysis Workshop 18
Stevenson, WA, USA. 13-17 October 2012
Abstract
In Genetic Analysis Workshop 18 data, we used a 3-stage approach to explore the benefits of pathway analysis in improving a model to predict 2 diastolic blood pressure phenotypes as a function of genetic variation. At stage 1, gene-based tests of association in family data of approximately 800 individuals found over 600 genes associated at p<0.05 for each phenotype. At stage 2, networks and enriched pathways were estimated with Cytoscape for genes from stage 1, separately for the 2 phenotypes, then examining network overlap. This overlap identified 4 enriched pathways, and 3 of these pathways appear to interact, and are likely candidates for playing a role in hypertension. At stage 3, using 157 maximally unrelated individuals, partial least squares regression was used to find associations between diastolic blood pressure and single-nucleotide polymorphisms in genes highlighted by the pathway analyses. However, we saw no improvement in the adjusted cross-validatedR2. Although our pathway-motivated regressions did not improve prediction of diastolic blood pressure, merging gene networks did identify several plausible pathways for hypertension.
Background
Pathway analysis of results from genetic association stu-dies has become a very popular approach, and usually the goal is to gain a better understanding of which genes or groups of genes are related to the disease or trait being studied. However,“a better understanding”is not usually well defined. We chose to investigate whether pathway analysis could improve theR2 value in a partial least squares (PLS) regression model predicting phenotype as a function of single-nucleotide polymorphisms (SNPs). Our hypothesis was that pathway analysis would high-light genes containing many SNPs with effects too small to be detected in univariate analyses, but that the PLS components (or latent variables) might benefit from such signals.
Analyses used a multistage approach to analyze asso-ciations with diastolic blood pressure (DBP) in the Genetic Analysis Workshop 18 (GAW18) data. At stage 1, we tested for association between sequence variation
in each gene and DBP in the families. At stage 2, we built gene networks from the significant genes identified in stage 1, using Cytoscape [1-3] and identified enriched pathways. Stage 3 included the PLS regression models on unrelated individuals using different sets of SNPs moti-vated by stages 1 and 2.
Methods
Phenotype
We used 2 different DBP phenotypes: DBP at the first visit (DBP-1) and a measure of DBP change with age (DBP-C). In the GAW18 dataset, 795 individuals had both a DBP-1 measurement and genotype information; no covariates were used when analysing DBP-1. Slopes of DBP versus age were estimated from only 2 to 4 mea-surements in each of 855 individuals, and then slopes were adjusted for smoking and antihypertensive medica-tion use, and categorized into 3 levels: none of the visits, some visits, or all visits. The resulting residuals formed our second phenotype, measuring whether an individual’s blood pressure changes more or less than the average. There were 611 individuals with DBP-C and genotype information.
* Correspondence: [email protected]
1
Department of Epidemiology, Biostatistics and Occupational Health, McGill University, 1020 Pine Avenue West, Montreal, Quebec, H3A 1A2, Canada Full list of author information is available at the end of the article
Stage 1: ASKAT
Gene-based tests of association between the exome sequencing data and the DBP-1 and DBP-C phenotypes were performed using ASKAT [4], a method for quantita-tive phenotype analysis in families developed by our group. ASKAT fits a linear mixed model adjusting for the relationships by using the estimated kinship matrix. Kinship matrices were calculated for each odd-numbered chromosome using the genotype data in the chrx-geno. csv files. SNPs with minor allele frequency less than 0.01 were removed, and the kinship matrices were calculated using GenABEL v1.7-0 [5]. The average of all odd-numbered chromosome-specific kinship matrices was used in the gene-based ASKAT tests. Gene names were retrieved from hg19 build 37 (http://genome.ucsc.edu) [6], and we tested association between sequence-derived genetic variation (from the chrx-dose.csv files) in the exons of each gene and the DBP-1 and DBP-C pheno-types, using a total of 147,103 genetic variants. To opti-mize power to detect rare variants, the 201 genes containing more than 50 variants were divided into a ser-ies of non-overlapping windows with a maximum of 50 variants per window (based on empirical data from our group, not shown). For such genes, the minimum
pvalue summarized the gene result.
Stage 2: Pathway analysis
For DBP-1 and DBP-C, network analysis was performed using methods in Cytoscape 2.8.2 [7,8]. Networks were built using“Reactome FI” on genes withpvalue≤0.05 from stage 1. The networks for DBP-1 and DBP-C were then compared and merged using “Advanced Network Merge-Intersection.”Pathway analysis for genes in com-mon was performed using the“Analyze Module Function.”
Stage 3: Regression analysis
PLS regression analysis was used for prediction modeling of our 2 phenotypes as a function of the number of minor alleles in SNPs identified by stages 1 and 2. PLS searches for multidimensional linear combinations of SNPs that explain the maximum variance direction of the phenotype, and can be thought of as constructing latent predictor variables. PLS models, using plsr version 2.3-0 of library pls [9], were fit to the 157 maximally unrelated individuals, using all variants from the chrx-dose.csv files, located in the genes identified by (a)pvalue≤0.05 in gene-based analyses from stage 1, (b) stage 2 enriched pathways for DBP-1 or DBP-C with a false discovery rate (FDR) ≤0.05, or (c) stage 2 enriched pathways in the overlapping gene network. Tenfold cross-validation was used to choose the optimal number of PLS components, and we report the number of PLS components that gave the smallest adjusted cross-validatedR2.
Results
Stage 1: ASKAT analysis
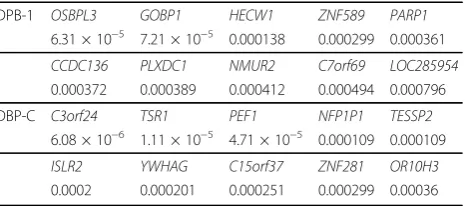
After analysis of 10,744 genes with ASKAT, 601 genes showed significant association with the DBP-1 phenotype (pvalue≤0.05), whereas 694 genes were significant for the DBP-C phenotype. Among the 20 lowestpvalues for each phenotype, there were no genes in common (Table 1). The minimumpvalues were 6.31 × 10⁻⁵and 6.08 × 10⁻⁶ for DBP-1 and DBP-C, respectively.
Stage 2: Pathway analysis
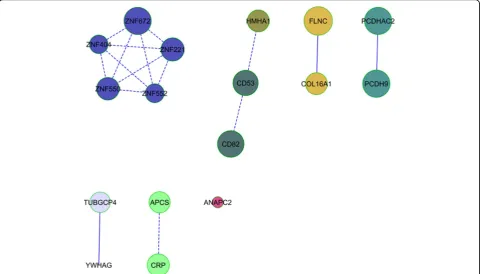
We found 84 enriched pathways (51 different genes) with FDR≤0.05 for DBP-1, and 88 for DBP-C (59 differ-ent genes). There were 26 enriched pathways in com-mon, but only the cadherin signalling pathway (P) and G2/M pathway (R) were part of the top 20 enriched pathways for both phenotypes. Merging the networks from the 2 phenotypes revealed some gene networks in common (Figure 1) containing 17 genes, and we esti-mated pathway enrichment in this set, finding 4 path-ways that were enriched with FDR≤0.05 (Table 2).
Stage 3-Regression analysis
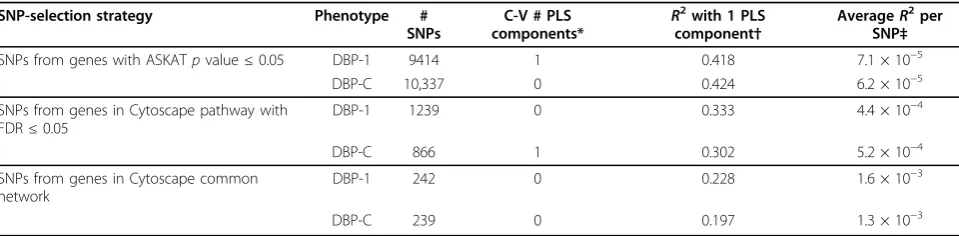
Table 3 (fourth column) shows the optimal number of PLS components, identified by cross-validation, for the 2 phenotypes and for the 3 strategies for selecting SNPs. This approach identified either no components (linear combinations of SNPs) or 1 PLS component as provid-ing the best fit to explain phenotype. However, even when 1 component was chosen as best, the improve-ment in error over the model with no components was minimal. To explore these results a bit differently, we measured the contribution per SNP for a 1-component PLS model, dividing the model R2 by the number of SNPs in the PLS component that had nonzero regres-sion coefficient (Table 3, last column). It can be seen that the pathway approaches improve this per-SNP con-tribution to R2. Also, the improvement in SNP impor-tance across the 3 strategies is similar for either phenotype.
Table 1 Ten most significant genes from stage 1, ASKAT, withpvalues
DPB-1 OSBPL3 GOBP1 HECW1 ZNF589 PARP1 6.31 × 10⁻⁵ 7.21 × 10⁻⁵ 0.000138 0.000299 0.000361
CCDC136 PLXDC1 NMUR2 C7orf69 LOC285954
0.000372 0.000389 0.000412 0.000494 0.000796
DBP-C C3orf24 TSR1 PEF1 NFP1P1 TESSP2 6.08 × 10⁻⁶ 1.11 × 10⁻⁵ 4.71 × 10⁻⁵ 0.000109 0.000109
ISLR2 YWHAG C15orf37 ZNF281 OR10H3
0.0002 0.000201 0.000251 0.000299 0.00036 Dufresneet al.BMC Proceedings2014,8(Suppl 1):S103
http://www.biomedcentral.com/1753-6561/8/S1/S103
Discussion
Our pathway analysis was performed with Cytoscape, which is one among many possible pathway analysis tools. We also tried Gene Set Enrichment Analysis (GSEA) using the JAVA applet GSEA software v2.07 from the Broad Institute [10]. GSEA takes into account the gene rank, and tests whether a pathway is enriched by looking for an overrepresentation of genes at the top or bottom of a ranked list ofpvalues. Using this method, no enriched pathway had FDR≤0.05. However, a study comparing gene-set enrichment tests reported that GSEA was more consistent in finding enriched pathways [11].
Pathway analysis is often heralded as a solution for better understanding genetic effects, but how to best benefit from it is unclear. We selected a definition, improvement in R2 of a multivariate (PLS) regression model, which is one of many possible definitions, and we explored this in GAW18 DBP data. We selected PLS
regression in order to optimize construction of latent predictors, but the optimal number of PLS components identified through cross-validation was often zero for either phenotype and for any of the 3 gene and pathway selection strategies. We did not, in fact, find evidence for improved prediction of DBP using our strategy. However, PLS was not designed for categorical data and may not be the best choice for capturing associations between numerous SNPs and phenotype. When we forced a PLS fit with 1 component, the per-SNP contri-butions toR2 from the overlapping genes were larger than when we used other approaches. It must be noted that although stage 1 used family data and stage 3 used unrelated individuals data, there is some overlap between these sets of individuals, and hence the per-SNP improvement in Table 3 may be partially explained by model over-fitting.
We chose to work with 2 DBP phenotypes, DBP at first visit, and a measure of DBP change with age. In most individuals, blood pressure increases with age. Our DBP-C phenotype, the residuals from a regression on age, measures each individual’s sensitivity to the factors that lead to this general population trend of increasing DBP with age. We adjusted for medication use and smoking in a second model because with only 2 to 4 measurements per person, full longitudinal modeling was not possible. In this work, we have not adjusted for
Figure 1Pathway analysis results. Networks in common between the significant gene lists for DBP-1 and DBP-C. The size of the circle is inversely related to the gene’spvalue.
Table 2 Pathways enriched in overlapping networks of genes associated with DBP-1 and DBP-C
the variable precision of the slope estimates or age for DBP-1, and we recognize that this is a limitation.
Because our 2 phenotypes (DBP-1 and DBP-C) are clo-sely related, we decided to focus our pathway analysis on gene networks present for both phenotypes. This strategy led to identification of 4 pathways significantly associated with DBP-1 and DBP-C. The first 3 pathways (see Table 2) interact together and play a role in pathogenesis of hyper-tension [12,13]. The G2/M transition pathway is known to be affected by leptin [14], a protein associated with hyper-tension [15].
Only odd-numbered chromosomes were included in GAW18, thus our identified pathways and networks will be incomplete. An analysis of the entire genome might validate our findings and provide additional significant associations. Furthermore, Cytoscape only assigned pathways to 120 genes out of the approximately 600 selected for either phenotype, thus providing further motivation to continue our analysis of a larger curated set of genes in pathways. Despite all the caveats in this work, it is interesting that our approach of examining overlapping pathways identified 3 pathways that are plausibly related to hypertension.
Conclusions
For DBP or DBP changes in GAW18 data, we exam-ined whether using pathway analysis results improved
R2
in multivariate regression models. Although we did not find evidence for improved model fits, 3 enriched pathways contained plausible hypertension-related genes.
Competing interests
The authors declare that they have no competing interests.
Authors’contributions
LD conducted statistical analyses and drafted the manuscript. KO designed ASKAT, and with VF, helped with the statistical analyses. CMTG supervised the statistical analyses and the manuscript. All authors read and approved the final manuscript.
Acknowledgements
This work is supported by CIHR grant MOP-115110 to C. Greenwood. The GAW18 whole genome sequence data were provided by the T2D-GENES Consortium, which is supported by NIH grants U01 DK085524, U01 DK085584, U01 DK085501, U01 DK085526, and U01 DK085545. The other genetic and phenotypic data for GAW18 were provided by the San Antonio Family Heart Study and San Antonio Family Diabetes/Gallbladder Study, which are supported by NIH grants P01 HL045222, R01 DK047482, and R01 DK053889. The Genetic Analysis Workshop is supported by NIH grant R01 GM031575.
This article has been published as part ofBMC ProceedingsVolume 8 Supplement 1, 2014: Genetic Analysis Workshop 18. The full contents of the supplement are available online at http://www.biomedcentral.com/bmcproc/ supplements/8/S1. Publication charges for this supplement were funded by the Texas Biomedical Research Institute.
Authors’details
1Department of Epidemiology, Biostatistics and Occupational Health, McGill
University, 1020 Pine Avenue West, Montreal, Quebec, H3A 1A2, Canada.
2Département de Mathématiques, Université du Québec à Montréal,
PK-5151, 201 avenue du Président-Kennedy, Montréal, QC H2X 3Y7, Canada.
3Lady Davis Institute for Medical Research, Jewish General Hospital, 3755
Côte Ste. Catherine, Montreal, QC, H3T 1E2, Canada.4Department of Oncology, McGill University, Montreal, QC, Canada.
Published: 17 June 2014
References
1. Smoot ME, Ono K, Ruscheinski J, Wang P, Ideker T:Cytoscape 2.8: new features for data integration and network.Bioinformatics2011,27:431-432. 2. Cline MS, Smoot M, Cerami E, Kuchinsky A, Landys N, Workman C,
Christmas R, Avila-Campilo I, Creech M, Gross B,et al:Integration of biological networks and gene expression data using Cytoscape.Nat Protoc2007,2:2366-2382.
3. Shannon P, Markiel A, Ozier O, Baliga NS, Wang JT, Ramage D, Amin N, Schwikowski B, Ideker T:Cytoscape: a software environment for integrated models of biomolecular interaction networks.Genome Res 2003,13:2498-2504.
4. Oualkacha K, Dastani Z, Li R, Cingolani P, Spector T, Hammond C, Richards JB, Ciampi A, Greenwood CMT:Adjusted sequence kernel association test for rare variants controlling for cryptic and family relatedness.Genet Epidemiol2013,37:366-376.
5. Aulchenko YS, Ripke S, Isaacs A, van Duijn CM:GenABEL:an R package for genome-wide association analysis.Bioinformatics2007,23:1294-1296. 6. Kent WJ, Sugnet CW, Furey TS, Roskin KM, Pringle TH, Zahler AM,
Haussler D:The human genome browser at UCSC.Genome Res2002, 12:996-1006.
7. Matthews L, D’Eustachio P, Gillespie M, Croft D, de Bono B, Gopinath G, Jassal B, Lewis S, Schmidt E, Vastrik I,et al:An Introduction to the Reactome Knowledgebase of Human Biological Pathways and Processes. Bioinformatics Primer, NCI/Nature Pathway Interaction Database2007. Table 3 Results from PLS regression analysis
SNP-selection strategy Phenotype #
SNPs from genes in Cytoscape pathway with FDR≤0.05
DBP-1 1239 0 0.333 4.4 × 10⁻⁴
DBP-C 866 1 0.302 5.2 × 10⁻⁴
SNPs from genes in Cytoscape common network
DBP-1 242 0 0.228 1.6 × 10⁻³
DBP-C 239 0 0.197 1.3 × 10⁻³
*The optimal number of PLS components, as determined by 10-fold cross-validation. †R2
values for a PLS model with 1 component.
‡The 1-componentR2divided by the number of SNPs in the PLS component with nonzero regression coefficient, which are 5920, 6835, 759, 580, 143, and 150 SNPs, respectively.
Dufresneet al.BMC Proceedings2014,8(Suppl 1):S103 http://www.biomedcentral.com/1753-6561/8/S1/S103
8. Joshi-Tope G, Vastrik I, Gopinathrao G, Matthews L, Schmidt E, Gillespie M, D’Eustachio P, Jassal B, Lewis S, Wu G, Birney E, Stein L:The Genome Knowledgebase: A resource for biologists and bioinformaticists.Cold Spring Harb Symp Quant Biol2003,68:237-243.
9. Björn-Helge M, Wehrens R:The pls package: principal component and partial least squares regression in R.J Stat Softw2007,18(2):1-24. 10. Subramanian A, Tamayo P, Mootha VK, Mukherjee S, Ebert BL, Gillette MA,
Paulovich A, Pomerov SL, Golub TR, Lander ES, Mesirov JP:GSEA: a knowledge-based approach for interpreting genome-wide expression profile.Proc Natl Acad Sci U S A2005,102:15545-15550.
11. Abatangelo L, Maglietta R, Distaso A, D’Addabbo A, Creanza TM, Mukherjee S, Ancona N:Comparative study of gene set enrichment methods.BMC Bioinformatics2009,10:275.
12. Chao JT, Davis MJ:The roles of integrins in mediating the effects of mechanical force and growth factors on blood vessels in hypertension. Curr Hypertens Rep2011,13:421-429.
13. Weber GF, Bjerke MA, DeSimone :Integrins and cadherins join forces to form adhesive networks.J Cell Sci2011,124:1183-1193.
14. Huang F, Xiong X, Wang H, You S, Zeng H:Leptin-induced vascular smooth muscle cell proliferation via regulating cell cycle, activating ERK1/2 and NF-kB.Acta Biochim Biophys Sin (Shanghai)2010,42:325-331. 15. Schäfer K, Halle M, Goeschen C, Dellas C, Pynn M, Loskutoff DJ,
Konstantinides S:Leptin promotes vascular remodeling and neointimal growth in mice.Arterioscler Thromb Vasc Biol2004,24:112-117.
doi:10.1186/1753-6561-8-S1-S103
Cite this article as:Dufresneet al.:Pathway analysis for genetic association studies: to do, or not to do? That is the question.BMC Proceedings20148(Suppl 1):S103.
Submit your next manuscript to BioMed Central and take full advantage of:
• Convenient online submission
• Thorough peer review
• No space constraints or color figure charges
• Immediate publication on acceptance
• Inclusion in PubMed, CAS, Scopus and Google Scholar
• Research which is freely available for redistribution