Crowdsourcing Salient Information from Tweets and News
Oana Inel*, Tommaso Caselli, Lora Aroyo
The Network Institute,Vrije Univerisiteit Amsterdam; *IBM Nederland, Center for Advanced Studies Benelux De Boelelaan 1105 1081 HV Amsterdam; Johan Huizingalaan 765, 1066 VH Amsterdam
{oana.inel,t.caselli,lora.aroyo}@vu.nl
Abstract
The increasing streams of information pose challenges to both humans and machines. On the one hand, humans need to identify relevant information and consume only the information that lies at their interests. On the other hand, machines need to understand the information that is published in online data streams and generate concise and meaningful overviews. We consider events as prime factors to query for information and generate meaningful context. The focus of this paper is to acquire empirical insights for identifying salience features in tweets and news about a target event,i.e., the event of “whaling”. We first derive a methodology to identify such features by building up a knowledge space of the event enriched with relevant phrases, sentiments and ranked by their novelty. We applied this methodology on tweets and we have performed preliminary work towards adapting it to news articles. Our results show that crowdsourcing text relevance, sentiments and novelty(1)can be a main step in identifying salient information, and(2)provides a deeper and more precise understanding of the data at hand compared to state-of-the-art approaches.
Keywords:crowdsourcing, event salience, event topic space
1.
Introduction
The key feature of the current information age is the contin-uously growing stream of information of various types,e.g., news, tweets, videos, and across various distribution chan-nels, e.g., social, traditional media, personal blogs, infor-mation portals. All this results in an inconceivable amount of information redundancy,i.e., the same item is re-shared across different channels in identical or similar forms. This poses challenges both for humans and machines. Humans need to reduce the information overload and to be able to identify the truly novel and relevant information items. Machines need to generate meaningful news clusters (by means of news aggregation systems1,2) by identifying the novel information items that are relevant to target stories. Notions like novelty, relevance, and salience play a central role when dealing with such huge and continuous informa-tion streams. Defining these noinforma-tions is not a trivial task as they are deeply interconnected. We consider salience, or in-formation salience, in the context of relevance and novelty and we adopt the following definitions:
• novelty: corresponds to any bit of (relationally) new information. From this point of view, we follow the TREC definition of novelty, that is something which is presented as new with respect to a given context, which corresponds to the known information. • relevance: identifies “something important”.
Impor-tance can be determined only in relation with some-thing (e.g., an object, a topic, an event, among others) and in a context of occurrence. Subjectivity and in-tentionality play an important role in determining the relevance of an information item.
• salience: combination of novel and relevant informa-tion, seen as an incremental and gradable notion: first, relevant information is identified, then, on top of new data, novel information is identified.
1Google News,https://news.google.com
2European Media Monitor, http://emm.newsexplorer.eu/
NewsExplorer/home/en/latest.html
Our approach uses relevant information to guide the identi-fication of novel information, where not all relevant infor-mation is necessarily novel. Thus, novelty and relevance are strictly linked to time and can be seen as a by-product of the incremental processing of a discourse. Furthermore, they are connected to target discourse elements,e.g., event mentions, entities, topics, which aim to reduce the search space for novel and relevant information. The combina-tion of novelty and relevance can be used to assign salience scores to these elements up to a so-called “saturation” point. This paper describes our methodology to identify salient features in online data streams together with preliminary experimental results. Our approach is based on the novel combination of Natural Language Processing (NLP) and crowdsourcing. It harnesses the unique ability of the crowd to identify a wide range of features (Inel et al., 2013) po-tentially influencing the information salience of online data with respect to a specific central (linguistic) element. This builds the basis of salience understanding by example and can allow for training machine learning tools for salience detection. Our goal is to identify novel and relevant in-formation which contribute to the assignment of salience scores to a given target event in tweets and news. As a guiding example we use the event “whaling”3. Our main findings show that through the crowd we are able to(1)first dissect and then recompose the problem in a time stamped collection of salience features of a given event; (2) en-rich textual information with relevance, novelty, sentiment and intensity values, tasks where automated tools typically under-perform.
The paper is structured as follows. Section 2. describes the methodology for understanding salience and Section 3. in-troduces the use case and the datasets. Sections 4. and 5. re-port on the crowdsourcing experiments and the analysis of the results. Section 6. presents state-of-the-art approaches for relevance, novelty and sentiment analysis. Finally, Sec-tion 7. presents our conclusions and future work.
2.
Methodology
This section describes the methodological framework that was applied to derive salient features in continuous online data streams. We have applied this methodology for tweets, i.e., very short and concise pieces of information, and we chose to recreate it for news articles,i.e., long and extensive pieces of information. We derive salience from relevant pieces of textual information that bring in new information (i.e., new locations, organizations or word phrases) or new perspectives (i.e., subjective information such as new sen-timents or sentiment magnitudes). These two aspects help us to generate and extend the topic space of events. The methodology is based on machine-generated and crowd-driven understanding of salient features. We use both state-of-the-art approaches and crowdsourcing to:
• build up a set of relevant texts for a given event; • rank the relevant pieces of information based on the
amount of new information they contain,i.e., ranking based on novelty;
• build up a set of subjective perspectives triggered by relevant texts, word phrases or entities participating in the given event.
The information space is first semantically enriched with relevant entities, event mentions, locations, participants, and times, characterized by different relevance scores. Fil-tering out information pieces that are not relevant for the event at hand optimizes the annotation workflow by focus-ing the other tasks only on the essential and important data. Furthermore, relevant information can be further analyzed in terms of information novelty. We consider novelty at the content level,i.e., new information contained in the tweets or news article, and at the context level,i.e., sentiments and sentiment magnitudes triggered by the tweet, news snippet and relevant event mentions. Given this, salient features are extracted as a result of relevance and novelty in terms of content and perspectives. Section 5. presents the results of this methodology on a dataset of tweets and introduces first insights on a news article dataset. In addition to this, we show comparative results between state-of-the-art ap-proaches for relevance and sentiment assessment and our crowdsourcing experiments for the same tasks.
3.
Use case: Whaling Event
We focus our analysis and experiments on the event in-stance of “whaling”. Table 1 provides an overview of the three datasets used in the experiments presented in this paper. Social Sciences domain experts identified 36 seed words relevant to the event instance of “whaling” dis-tributed in terms of types as follows: 9 seeds denoting loca-tions (e.g., “North Pacific Ocean”, “factory ship vessels”), 5 seeds denoting related events(e.g., “hunting”, “commercial whaling”), 18 seeds denoting persons or organizations (e.g., “Institute of Cetacean Research”, “pro-whaling countries ”, “Greenpeace”) and 4 seeds denoting miscellaneous types (e.g., “harpoon”, “whale meats”). These seed words were used to build theN ewsDS3andT weet2015DS2datasets by querying the NewsReader WikiNews Corpus4, and by mining the Twitter streaming API5, respectively.
4http://www.newsreader-project.eu/results/data/ 5https://dev.twitter.com/docs/streaming-apis
Dataset Type Source Period Units
Tweet2014DS1 Tweets Twitter 2014 566
Tweet2015DS2 Tweets Twitter 2015 430
NewsDS3 News WikiNews
2005-2010 29
Table 1: Overview of the Whaling Event Datasets.
T weet2014DS1contains 566 English-language tweets rel-evant to the event of “whaling” (published in 2014) by querying a Twitter dataset from 2014 with the phrase ”Whaling Hunting”.
T weet2015DS2contains 430 English-language tweets rel-evant to the event of “whaling” (published between March-May 2015). The dataset was obtained by querying the Twit-ter API with combinations of domain experts’ seed words (e.g., event and location, event and organization).
N ewsDS3 contains 29 English-language news articles from the WikiNews corpus (published between 2005 -2010) with a total of 14537 tokens.
4.
Deriving an Experimental Methodology
We apply the methodology described in Section 2. on the tweets datasets,T weet2014DS1andT weet2015DS2. Part of the methodology is also applied on the news arti-cles dataset, N ewsDS3, as preliminary experiments for acquiring salience understanding in broader and lengthier information streams. We target the identification of salient information in the context of “whaling” event by identify-ing(1) relevant pieces of information,(2)novel pieces of information contained in the relevant information, and(3) sentiments triggered by the relevant pieces of information.Judg/ Units/ Tasks/ $/
Dataset Task Unit Task Worker Task
Tweet2014DS1 Relevance 7 1 10 $0.02
Tweet2015DS2 Analysis
NewsDS3 Relevance 15 1 10 $0.02
Analysis
Tweet2014DS1 Sentiment 10 1 10 $0.01
Tweet2015DS2 Analysis
-NewsDS3 $0.02
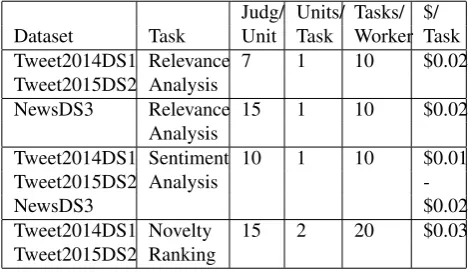
Tweet2014DS1 Novelty 15 2 20 $0.03
Tweet2015DS2 Ranking
Table 2: Crowdsourcing Tasks Settings.
4.1.
CrowdTruth Approach
We used the CrowdFlower6marketplace for running all the crowdsourcing experiments. The results were analyzed in the CrowdTruth framework (Inel et al., 2014) by apply-ing the CrowdTruth metrics and methodology (Aroyo and Welty, 2014; Aroyo and Welty, 2014). These metrics are the basis for assessing the crowd workers,i.e., identifying the quality and low-quality workers, and the probability of the input data to express a given annotation, e.g., the rel-evance score of the positive sentiment. We introduce here the main components of the CrowdTruth methodology that guide us in analyzing the crowdsourcing experiments de-scribed in Sections 4.2., 4.3. and 4.4..
The main component of the CrowdTruth metrics is the an-notation vector, which enables the comparison of results using cosine similarity measures. For each workeri anno-tating an input unitu, the vectorWu,irecords the answer. The length of the vector depends on the number of possi-ble answers in a question, while the number of such vectors depends on the number of questions contained in the task. If the worker selects a particular answer, its corresponding component is marked with1, and0 otherwise. Similarly, we compute aninput unit vectorVu=PiWu,iby adding up all the worker vectors for the givenu.
We applyworker metricsin order to differentiate between quality and low-quality workers. These metrics, computed using cosine similarity as well, measure (1) the pairwise agreement between two workers across alluthey annotated in common and(2)the similarity between the annotations of a worker and the aggregated annotations of the rest (sub-tracting the worker vector) of the workers. These measures show us how much a worker disagree with the rest of work-ers and thus, they identify the low-quality workwork-ers. The annotations of the workers that are under-performing are filtered out from the final results. To further verify the ac-curacy of the CrowdTruth quality metrics we also perform manual evaluation of the results. Theinput unit-annotation scoreis the core CrowdTruth metric to measure the proba-bility ofuto express a given annotation. It is measured for each possible annotation on eachuas the cosine between Vuand the unit vector for that annotation.
4.2.
Relevance Analysis
The tweet length is suitable for typical crowdsourc-ing tasks, thus, there is no need for pre-processcrowdsourc-ing of T weet2014DS1 and T weet2015DS2 datasets. On the contrary, to optimize the length of the news articles for the crowdsourcing task, each news article was split into text snippets, i.e., sentences. We obtained between 4 and 38 text snippets per article. The first sentence of each article has been removed as it is just a rephrasing of the title. In to-tal, we extracted 394 snippets: 244 text snippets with over-lapping tokens with the title and 150 text snippets without any overlapping tokens.
Next, we performed crowdsourcing experiments on all three datasets. For the news articles dataset, N ewsDS3, we created 90 crowdsourcing input units containing(i)the title of the article (i.e., a mention related to the event
“whal-6http://www.crowdflower.com/
ing”) and (ii)up to 5 randomly chosen text snippets. For the tweet datasets,T weet2014DS1andT weet2015DS2, each tweet represents a crowdsourcing input unit.
During the“Relevance Analysis”task, forN ewsDS3, the crowd is first asked to select all the text snippets which are relevant with respect to the article title and then highlight in them all the relevant event mentions. If none of the text snippets was relevant for the title of the news article, the workers were guided to choose the option “NONE”. Based on the annotations gathered during these crowdsourcing ex-periments, we compose for each news article a set of rel-evant text snippets and a set of relrel-evant event mentions. Following the CrowdTruth approach, a relevance score is assigned to each text snippet and event mention.
For T weet2014DS1 and T weet2015DS2, the crowd is asked to assign each tweet to the relevant instance from a list of 9 predefined events including the event “whaling” and highlight all the relevant event mentions in it. This re-sults in a set of relevant tweets for each event instance. In this paper we report only on the tweets that are relevant for the event “whaling”. The CrowdTruth cosine similarity metric is used to assign a relevance score,i.e., a probability for a tweet to be relevant, with respect to the event instance “whaling” to each tweet and event mention.
4.3.
Novelty Ranking
The “Novelty Ranking”task was performed only on the tweet datasets,T weet2014DS1andT weet2015DS2. We first pre-processed the relevant tweets by ordering them in chronological order and computing the similarity of a tweet content (i.e., we removed the (short) links, RT, user/author mentions from the tweet) with all the previous tweets’ con-tent in each dataset. We aimed at filtering out all the rele-vant tweets with a lot of redundant information, which are very unlikely to bring in new information.
4.4.
Sentiment Analysis
In the“Sentiment Analysis”task we gather from the crowd the sentiment (positive, neutral, negative) and its magni-tude (high, medium, low) for(1) each relevant tweet and text snippet and(2)all the relevant event mentions in those, gathered in the “Relevance Analysis”task (Section 4.2.). This task was performed both on the news articles dataset (N ewsDS3) and on the tweet datasets (T weet2014DS1, T weet2015DS2). We use the CrowdTruth cosine metric to compute sentiment and magnitude scores for each relevant event mention, tweet and text snippet.
To compute the sentiment and sentiment magnitude scores for each event mention, relevant text snippet, and tweet we compute the cosine between the aggregated annotation vec-tor and the unit vecvec-tor for each label. For example, in order to see what is the probability for a tweet to express a pos-itive sentiment we compute the cosine between the aggre-gated sentiment vector of the tweet and the unit vector for the positive sentiment.
5.
Results
In this section we report on the results7of the crowdsourc-ing tasks. To outline the advantages of uscrowdsourc-ing our crowd-sourcing approach, we compare the crowdcrowd-sourcing results with existing, state-of-the-art approaches for relevance and sentiment analysis.
5.1.
Crowdsourcing Relevance - Tweets & News
In the“Relevance Analysis”task onT weet2014DS1, the crowd identified 476 out of 566 (88%) tweets as being rel-evant for “whaling”, where the relevance score is higher than 0.2. Similarly, on T weet2015DS2 341 out of 430 (80%) tweets received a relevance score higher than 0.2. In Figure 1a we plot the relevance distribution histogram on the aggregation of the two datasets. More than 55% of the tweets have a high relevance score, above 0.9, while only 10% of the tweets are found at the bottom with a relevance score smaller than 0.5.
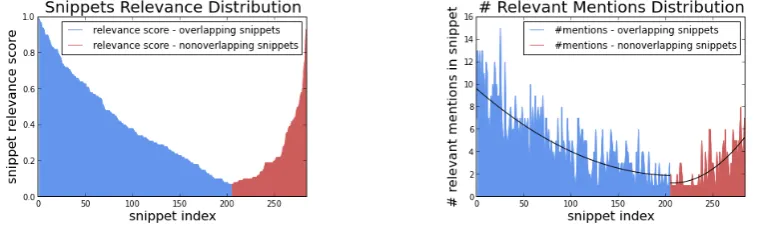
Figure 1b shows the distribution of the relevance scores for the tweets. The fact that about 84% of the total amount of tweets are considered relevant, out of which about 90% could indicate highly relevant tweets, shows that retrieving tweets based on relevant keywords or domain experts’ seed words returns acceptable results. However, there is still room for improvement,i.e., assessing the relevance of the tweets with regard to the event “whaling” is still necessary. In Figure 1c we look at the distribution of the total number of relevant event mentions identified by the crowd in each relevant tweet. We observe that less relevant tweets tend to have less relevant mentions, while, the tweets with rele-vance score between 1 and 0.70 have a tendency to contain approximately equal amount of relevant event mentions. From the “Relevance Analysis” task on N ewsDS3 we gathered 284 relevant text snippets (205 texts snippets with overlapping tokens with the title and 79 text snippets with-out overlapping tokens with the title) and 1139 relevant whaling event mentions. The plot in Figure 2a shows the relevance score of the text snippets (those overlapping with
7available atdata.crowdtruth.org/salience-news-tweets
the title in blue, those non-overlapping with the title in red) inN ewsDS3. It confirms the intuition that the overlapping snippets contain more relevant information, with a larger distribution of scores. Relevant information can also be spotted in the non-overlapping snippets, though the distri-bution of scores and the number of snippets is lower. If we assume the score of 0.5 as a threshold for highly rele-vant information in a snippet,i.e., every snippet above 0.5 is more prone to contain relevant information, we observe that 79.69% (314 out of 394) of the snippets has obtained scores below the threshold, while only 20.31% (81 snippets) are above the 0.5 value. Furthermore, 70 of the candidate rel-evant snippets have overlapping tokens while only 11 have non-overlapping tokens. A similar trend is observed for the number of relevant event mentions extracted by the crowd from the snippets, i.e., the more relevant the snippet, the more relevant the event mentions identified by the crowd as shown in Figure 2b.
We also investigate whether there is a tendency between the position of snippets in an article and their relevance. We split each article in three sections (beginning, middle and end) and compute the average relevance score for each section. Snippets with the highest average score (0.34) ap-pear in the beginning, followed by snippets in the middle (0.26) and then by those at the end (0.20). Things are sim-ilar when we look at the distribution of the text snippets with maximum relevance score per article: 12 snippets oc-cur in the beginning, 9 in the middle and 9 at the end. There is a slightly difference when taking into account the aver-age score of the snippets with maximum score: for the sen-tences in the beginning the average maximum score is 0.79, for those at the end 0.8 while for those in the middle is 0.73.
5.1.1. Automated Relevance for Tweets and News We assume that a good method to automatically derive rel-evance in our three datasets is text similarity: the more sim-ilar a text snippet is to the title or a tweet to the seed words, the more relevant the text fragments with respect to the tar-get event. We thus applied an off-the-shelf tool based on a hybrid approach that combines distributional similarity and Latent Semantic Analysis (LSA) with semantic rela-tions from WordNet (Han et al., 2013).
(a) Histogram of Relevance Scores in T weet2014DS1&T weet2015DS2
(b) Distribution of Tweets Relevance in T weet2014DS1&T weet2015DS2
(c) Distribution of # Relevant Mentions in T weet2014DS1&T weet2015DS2
Figure 1: Relevance Analysis -T weet2014DS1&T weet2015DS2
(a) Distribution of Snippets Relevance inN ewsDS3 (b) Distribution of # Relevant Mentions inN ewsDS3
Figure 2: Relevance Analysis -N ewsDS3
T weet2014DS1we get a positive Spearman correlation of 0.41, while onT weet2015DS2the correlation is 0.26. By performing this comparison we can state that usually, non-expert people have different ways to express or refer to a given event, in contrast to domain experts that have very specific terms to compose the space of an event. However, this difference does not prove that the tweets can not con-tain useful information,e.g.,T W EET2in Example 2, but it gives meaningful insights that the topic space given by the experts can be further enriched.
1. World court orders Japan to stop whaling in Antarctic waters - Christian Science Monitor[TWEET1] Crowd Relevance Score: 1 -Similarity Score: 0.24 2. In a Major Victory, Court Orders a Halt on Japanese
Whaling - Slate Magazine (blog) [TWEET2] Crowd Relevance Score: 1 -Similarity Score: 0.13 On N ewsDS3, we computed the semantic similarity be-tween the article title i.e., the event of whaling, and each text snippet from the article. As a general trend, we ob-served that overlapping text snippets usually have higher similarity scores, while the non-overlapping text snippets have lower scores. However, the relevance scores provided by the automated method have a much smaller interval, between 0 and 0.66. We computed the Spearman corre-lation between the two relevance values, from the crowd and machine. For the entire set of overlapping and non-overlapping sentences we got a positive Spearman corre-lation of 0.53. A manual exploration of the differences between the automatically assigned similarity scores and the crowd relevance score shows there is still room for im-provement for the automatic methods and that news
sys-tems, more oriented to capturing relevance rather than sim-ilarity, need to be developed. Below we illustrate some ex-amples where the use of similarity is not always the best choice to compute relevance. In particular, in Example 3 we notice that machines are not aware of the fact that Japan’s scientific research program is called JARPA II, while in Example 4 machines do not understand that the “rescued whales” were stranded about 200 meters from the shore.
3. Japan to hunt 950 whales for ”scientific research” [TITLE]
Japan plans to kill over 900 minke whales and ten fin whales during the next six months as part of its whal-ing program, JAPRA II, markwhal-ing a sharp escalation in Japan’s whaling activities. [TEXT SNIPPET] Crowd Relevance: 0.9 -Similarity Score: 0.16 4. 500 stranded melon-headed whales rescued in
Philip-pine bay[TITLE]
The whales were about 200 meters from the shore. [TEXT SNIPPET]
Crowd Relevance: 0.73 -Similarity Score: 0.11
relevant for the news article title. The tweets datasets how-ever, had a smaller overlap with the seed words, only 14/36, with a total of 835 occurrences. The seed words covered by the crowd annotations is 11/36, with a total of 1860 occur-rences. In addition, we gathered other 1239 mentions that the crowd consider relevant for the whaling event. Among the seed words not identified by the crowd we find some generic wordse.g., “shops” and “scientists”. We also find words that overlap partially,e.g, “Sea Shepherd Conserva-tion Society” (provided by the experts) and “Sea Shepherd” or “Sea Shepherd Conservation” (provided by the crowd).
5.2.
Crowdsourcing Tweets Novelty
From the“Novelty Ranking”crowdsourcing task we obtain a comparison of each tweet with the rest of the tweets pub-lished on the same day. Thus, for each tweet we derive an aggregated novelty score in comparison with the rest, by us-ing a weighted schema: weight1if the tweet is more novel, weight0.5if the tweets are equally novel and weight−1if the tweet if less novel. Tweets contain a lot of redundant information. Out of 966 tweets, more than 70% were re-curring tweets. Even though we conducted the experiments independently on the two tweet datasets, we observed that the content overlap between the two years is also consider-able. For these initial experiments we chose to remove the tweets’ short links because it is very difficult to analyze if they point to new or redundant information.
The results of the “Novelty Ranking”task show that the tweets that were published earlier are more prone to be novel. As an example, T W EET5 in Example 7 is con-sidered less novel that a similar tweet published before, T W EET4from Example 6. At the beginning of the pe-riod of time in analysis, there were more unique tweets but also more tweets that contain new information, while the end of the period of time contained less unique tweets but also less novel tweets. In short, the amount of novel tweets decreases significantly day by day. The relevance score of the tweets with respect to the event of “whaling” shows to influence the novelty ranking as well. This means that the crowd is also able to distinguish between tweets that have qualitative mentions of the whaling event (e.g.,T W EET3 in Example 5) and tweets that do not contain highly relevant information, (e.g.,T W EET6shown in Example 8). Sample of tweets and their novelty score on the same day:
5. Japanese whaling fleet leaves port weeks after International court delivers ban verdict - WDC: http://t.co/BeuDUh5NO8[TWEET3]
Crowd Novelty Score: 1
6. Denounce Japan 4 Whale Slaughter - ForceChange #Japanpoli #STOPkillingwhales obey the law #bar-baricJapan stop lying![TWEET4]
Crowd Novelty Score: 0.62
7. Denounce Japan for Resuming Whale Slaughter -ForceChange[TWEET5]
Crowd Novelty Score: 0.30
8. becook1964 fella may be into whaling even it small bait i tried to use a minnow could it be this 100 million for shark and tunna - oh ok[TWEET6]
Crowd Novelty Score: -0.45
5.3.
Crowdsourcing Sentiments - Tweets & News
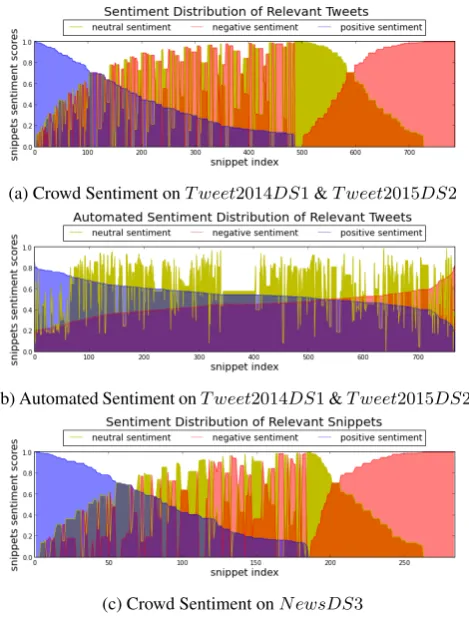
The last part of our methodology focuses on the sentiment and magnitude analysis. In Figure 3 we extracted from T weet2014DS1andT weet2015DS2a subset of relevant tweets that contain relevant event mentions about “whal-ing ban”. There is a strong positive sentiment about the decision to ban whaling in Japan. However, this drasti-cally transforms into a negative sentiment immediately af-ter facts such as Japan plans to continue whaling are pub-lished. An overall overview of the sentiment distribution on theT weet2014DS1andT weet2015DS2is shown in Fig-ure 4a. Similarly, in FigFig-ure 4c we see the sentiment distri-bution across theN ewsDS3dataset. We observe a similar trend across datasets, both the tweets and the text snippets are well distinguished as either positive or negative, while only a small portion clearly identifies as being neutral.
5.3.1. Automated Tweets Sentiment Detection
We compared our crowdsourcing results for the sentiments expressed in the tweets using an existing approach8. The choice of using this tool was made based on the fact that the tool returns, for a text, a vector space of senti-ments,i.e., each sentiment type gets a score, similarly as in CrowdTruth. Tools that focus specifically on tweets, tend to return only the primary sentiment type with/out the score. Computing the Pearson and Spearman correlations, how-ever, between each sentiment type score of the crowd and the automated measure, showed a very weak to no correla-tion: positive sentiment -0.026and0.014, negative senti-ment -0.15and0.12, neutral sentiment -−0.16and−0.15. In Figure 4b we plotted the sentiment scores across all the tweets. Comparing this outcome with the one provided by the crowd, in Figure 4a, we observe this tool gives very am-biguous score, and for the majority of the tweets the scores are almost evenly distributed across sentiment types.
5.4.
Discussion
The methodology performed in this research aims at under-standing event salience from two perspectives:
1. “centrality”: “central” discourse elements are the tar-gets of the information flow and those more prone to be associated with novel and relevant information. In this respect we assessed the relevance of tweets and news snippets and the novelty of tweets with regard to a tar-get event, “whaling”. Using automated semantic similarity measures instead of relevance, however, proved to be in-accurate as such methods have a poor performance when dealing with language ambiguity. The low semantic sim-ilarity correlation between domain experts “whaling” seed words and non-experts’ tweets showed that the way people address/refer to a given event is broadi.e., the crowd found a large set of relevant event mentions in all dataset, without using many domain-specific keywords.
2. “saturation”: discourse elements ultimately reach a point when no new and relevant information is ex-pressed,i.e., an information saturation level.
This level can be investigated and identified by means of linguistic data which combines “objective information” (e.g., the events an entity is involved as a participant), and
Figure 3: Sentiment Distribution ”Whaling ban” Use Case
(a) Crowd Sentiment onT weet2014DS1&T weet2015DS2
(b) Automated Sentiment onT weet2014DS1&T weet2015DS2
(c) Crowd Sentiment onN ewsDS3
Figure 4: Sentiment Analysis
“subjective information” (e.g., the sentiment and intensity reactions an entity or an event can trigger). We addressed the “subjective information” by crowdsourcing sentiments of tweets and news snippets. Using existing tools prove to be difficult, as current methods either give a single classifi-cation of the text, without addressing difference in opinions or give an inconclusive sentiment space, where clear deci-sions over the sentiment prove to be difficult to take.
6.
Related Work
The definition of salience is not trivial and different disci-plines such as Linguistics, Computational Linguistics, In-formation Extraction have used this notion and declined it in different ways. Notwithstanding the differences with
re-spect to the cues which signal salience and the way to iden-tify it, salience is best describes as something which is no-table or prominent.
score to each entity in a document. The authors define salience on the line of (Boguraev and Kennedy, 1999),i.e., as those discourse objects which have a prominent position in the focus of attention of the speaker/hearer9. Salience labels are automatically generated by exploiting summary pairs from the annotated New York Times corpus (Sand-haus, 2008), containing 1.8 millions of news articles ac-companied by a summary written by an expert.
7.
Conclusion and Future Work
Current state-of-the-art approaches for relevance or similar-ity assessment, novelty or salience detection and sentiment analysis need large amounts of ground truth data that are typically difficult to acquire. Given the overwhelming load of information people are surrounded by, such systems are essential in order to get a relevant and concise overview. The results that we obtained from the current crowdsourc-ing experiments give us input for the challenge of identi-fying the topic space of the “whaling” event by obtaining a diverse set of entities and features that can be associated with salient information. We derived a methodology to ob-tain such features from streams of tweets and we have per-formed initial steps to apply it on news streams. First, there is little information known about a given topic,i.e., domain experts’ seed words. We extent this space with relevant tweets and news snippets and relevant event mentions in those. However, relevant information can be redundant as well. Thus, we search for novel information in terms of new content and new subjective perspectives such as sentiments in order to track the way the sentiment changes across a given mention. We compared the crowd results for rele-vance assessment with state-of-the-art approaches for sim-ilarity assessment which strengthen our insight that seman-tic similarity does not always perform well when dealing with ambiguous data or everyday people conversations. As future work, we plan to (1) build a salience event-timeline by employing the relevant, novel and subjective features identifying in the current research,(2)deduce how every event mention influences the big picture of the event in terms of salient information or change in sentiment and intensity, and (3) identify when the event space gets sat-urated. Furthermore, using the lessons learnt from the tweets streams, we plan to conduct more experiments on news streams to identify novel information at the document level but also across news articles collections. Next step is to compare our results with more state-of-the-art NLP ap-proaches and provide a set of salient features of online data streams to help training salience detection tools.8.
Acknowledgements
One of the authors wants to thanks the NWO Spinoza Prize project Understanding Language by Machines (sub-track 3) for partially supporting this work.
9.
Bibliographical References
Alonso, O. and Mizzaro, S. (2009). Can we get rid of TREC assessors? Using Mechanical Turk for relevance assessment. InProceedings of the SIGIR 2009 Workshop on the Future of IR Evaluation, volume 15, page 16.
9The referential cognitive status of a discourse entity.
Aroyo, L. and Welty, C. (2014). The Three Sides of CrowdTruth.Journal of Human Computation, 1:31–34. Balahur, A., Steinberger, R., Kabadjov, M., Zavarella,
V., Van Der Goot, E., Halkia, M., Pouliquen, B., and Belyaeva, J. (2010). Sentiment analysis in the news. In Proceedings of the 7th International Conference on Lan-guage Resources and Evaluation, pages 2216–2220. Boguraev, B. and Kennedy, C. (1999). Salience-based
con-tent characterisation of text documents. Advances in au-tomatic text summarization, pages 99–110.
Dunietz, J. and Gillick, D. (2014). A new entity salience task with millions of training examples. EACL 2014, page 205.
Fern´andez, R. T. and Losada, D. E. (2007). Novelty de-tection using local context analysis. roceedings of the 30th annual international ACM SIGIR conference on Re-search and development in information retrieval. ACM. Grady, C. and Lease, M. (2010). Crowdsourcing
docu-ment relevance assessdocu-ment with mechanical turk. In Pro-ceedings of the NAACL HLT 2010 workshop on creat-ing speech and language data with Amazon’s mechanical turk, pages 172–179.
Han, L., Kashyap, A., Finin, T., Mayfield, J., and Weese, J. (2013). UMBC EBIQUITY-CORE: Semantic textual similarity systems. In Proceedings of the Second Joint Conference on Lexical and Computational Semantics, volume 1, pages 44–52.
Inel, O., Aroyo, L., Welty, C., and Sips, R.-J. (2013). Domain-independent quality measures for crowd truth disagreement. Detection, Representation, and Exploita-tion of Events in the Semantic Web, page 2.
Inel, O., Khamkham, K., Cristea, T., Dumitrache, A., Rut-jes, A., van der Ploeg, J., Romaszko, L., Aroyo, L., and Sips, R.-J. (2014). Crowdtruth: Machine-human com-putation framework for harnessing disagreement in gath-ering annotated data. InThe Semantic Web–ISWC 2014, pages 486–504. Springer.
Kumaran, G. and Allan, J. (2004). Text classification and named entities for new event detection. Proceedings of the 27th annual international ACM, pages 297–304. Rao, Y., Lei, J., Wenyin, L., Li, Q., and Chen, M. (2014).
Building emotional dictionary for sentiment analysis of online news. World Wide Web, 17(4):723–742.
Sahami, M. and Heilman, T. D. (2006). A web-based ker-nel function for measuring the similarity of short text snippets.WWW 06, pages:377.
Sandhaus, E. (2008). The new york times annotated corpus. Linguistic Data Consortium, Philadelphia, 6(12):e26752.
Verheij, A., Kleijn, A., Frasincar, F., and Hogenboom, F. (2012). A comparison study for novelty control mecha-nisms applied to web news stories. InWeb Intelligence and Intelligent Agent Technology (WI-IAT), volume 1, pages 431–436. IEEE.
Wei, Z. and Gao, W. (2014). Utilizing microblogs for au-tomatic news highlights extraction. COLING.