EXPRESS LETTER
Temporal changes in inflation sources
during the 2015 unrest and eruption of Hakone
volcano, Japan
Masatake Harada
*, Ryosuke Doke, Kazutaka Mannen, Kazuhiro Itadera and Mikio Satomura
Abstract
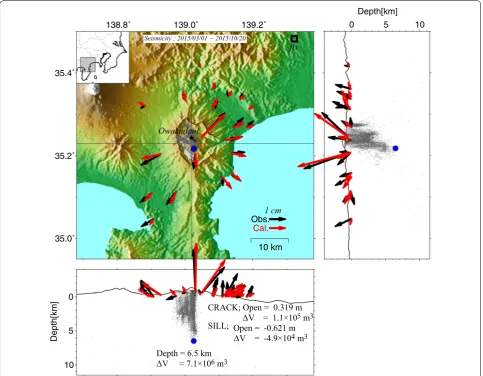
Global navigation satellite system data from Hakone volcano, central Japan, together with GEONET data from the Geospatial Information Authority of Japan, were used to investigate the processes associated with the volcanic activ-ity in 2015, which culminated in a small phreatic eruption in late June 2015. Three deep and shallow sources, namely spherical, open crack, and sill, were employed to elucidate the volcanic processes using the observed GNSS displace-ments, and the MaGCAP-V software was used to estimate the volumetric changes of these sources. Our detailed analysis shows that a deep inflation source at 6.5 km below sea level started to inflate in late March 2015 at a rate of ~ 9.3 × 10⁴ m3/day until mid-June. The inflation rate then slowed to ~ 2.1
× 104 m3/day and ceased at the end of
August 2015. A shallow open crack at 0.8 km above sea level started to inflate in May 2015 at a rate of 1.7 × 10³ m3/
day. There was no significant volumetric change in the shallow sill source during the volcanic unrest, which is evident from interferometric synthetic aperture radar analysis. The inflation of the deep source continued even after the erup-tion without a significant slowdown in inflaerup-tion rate. The inflaerup-tion stopped in August 2015, approximately 1 month after the eruption ceased. This observation implies that the transportation of magmatic fluid to a deep inflation source (6.5 km) triggered the 2015 unrest. The magmatic fluid may have then migrated from the deep source to the shallow open crack. The phreatic eruption was then caused by the formation of a crack that extended to the surface. However, steam emissions from the vent area during and after the eruption were apparently insufficient to mitigate the internal pressure of the shallow open crack.
Keywords: GNSS, Magma chamber, Hydrothermal system, Open crack, Phreatic eruption, Hakone
© The Author(s) 2018. This article is distributed under the terms of the Creative Commons Attribution 4.0 International License
(http://creativecommons.org/licenses/by/4.0/), which permits unrestricted use, distribution, and reproduction in any medium,
provided you give appropriate credit to the original author(s) and the source, provide a link to the Creative Commons license, and indicate if changes were made.
Introduction
Phreatic eruptions are the result of perturbations of the volcanic hydrothermal system (e.g., Barberi et al. 1992). Recent phreatic eruptions in the Japanese Islands have caused significant human casualties, with 61 fatalities during the September 27, 2014, Mt. Ontake eruption and one fatality during the January 23, 2018, Mt. Kusatsu Shi-rane eruption. Monitoring and forecasting are often diffi-cult because the signals, such as excitation processes, are often subtle, which have severe implications for human safety (e.g., Kato et al. 2015).
Hakone volcano, located in the central part of Honshu Island, central Japan, recently generated a small phreatic eruption on June 29, 2015, at the Owakudani fumarole area, which is the largest fumarolic area on the volcano (Fig. 1). Although there were no fatalities, the volcanic activity caused serious human safety concerns since the area is an internationally famous sightseeing loca-tion in Japan, with many visitors to the fumarole area year-round. Furthermore, the elevated fumarolic activi-ties caused serious damage to some of the steam wells that are used to make hot springs for the surrounding hotels, and these hotels were forced to temporarily stop providing hot springs to their visitors, resulting in sig-nificant economic losses to the area. Therefore, although the phreatic eruption was not a large event, its impact raised an important question regarding how intensively
Open Access
the volcano should be monitored to evaluate the risk of an eruption and mitigate the disasters related to the eruption.
The Hot Springs Research Institute of Kanagawa Pre-fecture (HSRI) has monitored Hakone volcano since 1989 using a seismometer array to detect seismic activi-ties, GNSS and tiltmeters to detect crustal deformations, and gas sensors to observe fumarolic activities. Here, we use the GNSS data to examine the temporal changes in ground deformation and then attempt to elucidate how volcanic processes at depth, which we model as hydraulic processes, influenced the observed volcanic activity from April to September 2015.
Hakone volcano has a long eruption history, extending more than 400 kyr and including caldera-forming erup-tions from 250 to 60 kyr ago (Takada et al. 2007). The
most recent magmatic activity took place along a N–S trending line that traverses the center of the volcano, forming several small stratovolcanoes and lava domes. The seismic activity along the line appears to be related to a hydrothermal activity (Yukutake et al. 2011). The seismic activity of the volcano is relatively high, even dur-ing its inactive period, and several earthquakes, most of which are M≤ 1, are observed in a given month.
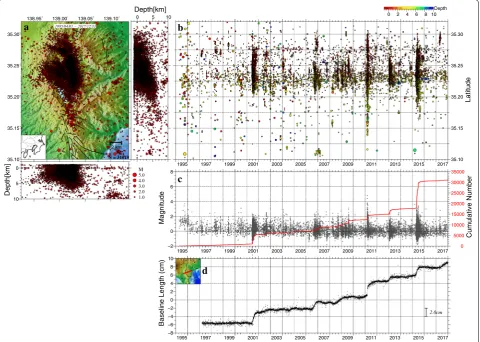
We have observed major earthquake swarm activi-ties accompanied by the inflation of the volcano since the installation of the GNSS monitoring network in the 1990s (Harada et al. 2010). As shown in Fig. 2, such volcanic unrest has been observed in 2001, 2006, 2008–2009, 2013, and 2015. With the exception of the volcanic unrest in 2001 and 2015, these observed vol-canic episodes were only accompanied by earthquake
10 km Obs.
Cal.
1 cm
Seismicity ; 2015/03/01 − 2015/10/20
138.8˚ 139.0˚ 139.2˚
35.0˚ 35.2˚ 35.4˚
0
5
10
Depth[km]
0 5 10
Depth[km]
Depth = 6.5 km ΔV = 7.1×10⁶ m3
CRACK; Open = 0.319 m ΔV = 1.1×10⁵ m3 SILL; Open = -0.621 m ΔV = -4.9×10⁴ m3
fix
Owakudani
swarms and inflation of the volcano. However, the 2001 unrest was accompanied by intensified steaming activity, and the 2015 event, which is discussed here, culminated in a small phreatic eruption.
The 2015 activity was first recognized by the GNSS network prior to mid-April as an inflation of the vol-canic edifice. The earthquake swarm activity began in late April, and the steaming activity intensified in early May in Owakudani (Harada et al. 2015). Although the seismic activity declined since early June, there was a sudden and significant increase on the morning of June 29 that culminated in a small phreatic eruption (Yuku-take et al. 2017; Mannen et al. 2018). Here, we estimate the locations of the inflation sources and their infla-tion rates during the 2015 volcanic activity based on GNSS data analysis.
GNSS data and location of inflation sources
Here, we used GNSS data from 20 observation stations in and around the volcano (Fig. 1). Ten stations are maintained by HSRI, with the other ten GEONET sta-tions installed by the Geospatial Information Authority of Japan (GSI). One of the HSRI stations, located 2 km west of Owakudani, was excluded from the analysis because unrelated landslide movement appears to have contaminated the data from this station. Here, GNSS data from March 1, 2015 to June 30, 2016 were ana-lyzed. The daily coordinates of the HSRI stations and one GEONET station were determined by our routine analy-sis using Bernese ver. 5.0 software (Dach et al. 2007) with IGS (International GNSS Service) precise ephemerides (Doke et al. 2018b). Furthermore, we used the F3 solu-tion released by GSI to obtain the daily coordinates of
35.10
1995 1997 1999 2001 2003 2005 2007 2009 2011 2013 2015
0 2 4 6 8 10
1995 1997 1999 2001 2003 2005 2007 2009 2011 2013 2015
−8
1995 1997 1999 2001 2003 2005 2007 2009 2011 2013 2015
2.0cm
Fig. 2 Seismic activity and inflation of Hakone volcano from April 1995 to December 2017. The hypocenters were determined by HSRI. a
the GEONET stations. We needed to combine the two network solutions since the coordinate estimations were conducted independently between HSRI and GSI. We therefore first calculated the offset of the three-dimen-sional (3D) coordinates at the commonly occupied observation station at Odawara (GEONET station code: 950230) and then subtracted the daily offsets from each of the HSRI sites, relying on the GSI F3 solution. We derived the coordinated time series at each of the sites from the obtained 3D coordinates, with velocity vectors estimated from the difference between the average coor-dinates for March 1–10, 2015 and the average coordi-nates for October 11–20, which are shown in Fig. 1.
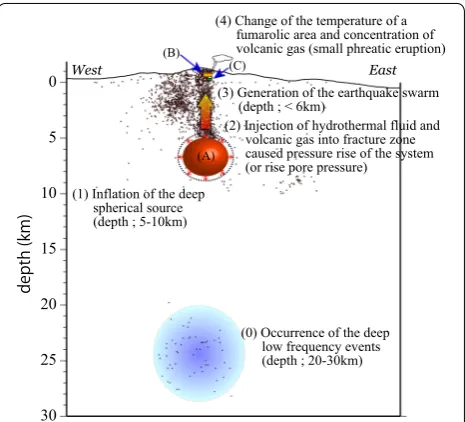
We assumed three inflation sources in the shallow crust to estimate the potential sources that may have caused the observed crustal deformation associated with the volcanic activity (see Fig. 1). Our preliminary evalua-tion suggested a single inflaevalua-tion source at ~ 5.4 km depth that reasonably reconstructed the surface dislocation (root-mean-square (RMS) error = 1.2 × 10⁻³). However, an interferometric synthetic aperture radar (InSAR) analysis implied that a crack opened at shallow depths in the volcano during the phreatic eruption (Doke et al. 2018a). They also implied the existence of a deflation sill at ~ 250 m above sea level, which appears to deflate during the eruption and is assumed to be the source of the hydrothermal fluid that erupted. In this study, we employed the three sources obtained by the following procedure (Table 1; Fig. 3). In our model, we used loca-tions of the open crack and deflation sill deduced by InSAR analysis (Doke et al. 2018a) and then estimated the location of the deep source based on the MaGCAP-V software (Fukui et al. 2013). We used the inverse analysis function of this software by first defining the initial val-ues and deviations of the models for GNSS data at each observation site. We then obtained the optimal solu-tion using a least squares method and weighting factors, where we assigned a weight of 1.0 to the two horizontal components and 0.2 to the vertical component.
The optimal solution, which yields the best fit location and inflation volume during the 2015 volcanic unrest, is shown in Table 1. We estimated a deep spherical infla-tion source beneath the central cone at ~ 6.5 km below
sea level and a volume change of 7.1 × 10⁶ m3 (RMS error = 2.0 × 10⁻³). This deep source corresponds to the low seismic Vp/Vs region detected via tomographic analysis (Yukutake et al. 2015). Yukutake et al. (2015) suggested that this deep region contained a developed hydrothermal system.
Calculation of the inflated volume during unrest
We estimated the temporal changes in the inferred vol-ume of each source position during the 2015 volcanic unrest and eruption. The locations of the three sources listed in Table 1 were fixed such that only the volume changes of the three sources were calculated via the MaGCAP-V inversion analyses, with the same weights given to the horizontal and vertical components as in the previous analyses. The initial position of each GNSS sta-tion was fixed as the origin, which was determined as the average of the coordinates over the March 1–10 period, about one and a half months prior to the onset of the vol-canic unrest. The 10-day average positions of the GNSS
Table 1 Parameters of the assumed sources
The crack and sill parameters are based on Doke et al. (2018a)
Longitude (°) Latitude (°) depth (below
sea level in m) Length (m) Width (m) Strike (°) Dip (°) Opening (m) Volume change (m3)
(A) Spherical
source 139.025872 35.217863 6466.5 – – – – – 7.1 × 10
6
(B) Crack 139.030707 35.233585 − 827.6 1192.1 298.6 323.83 88.52 0.3186 1.1 × 10⁵
(C) Sill 139.027414 35.235381 − 224.9 261.4 304.1 0.00 0.00 − 0.6210 − 4.9 × 10⁴
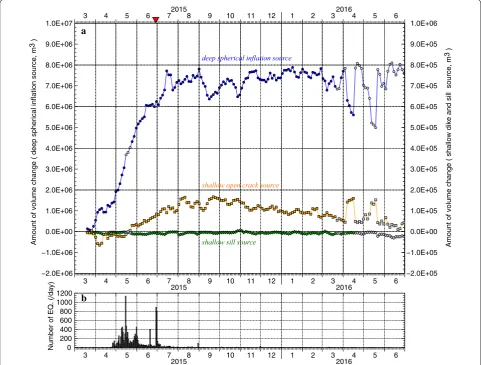
stations were calculated for each 3-day shift (e.g., March 4–13 and March 7–16), with the initial position of the station origin subtracted from its 10-day averaged station positions to obtain the displacements from the origin. The resultant displacements at the GNSS stations were then used to estimate the volume changes of the three inflation sources. The best fit volume changes of the infla-tion sources are shown in Fig. 4. Note that the plots are at the last day of the selected 10-day intervals for monitor-ing purposes (which means that we cannot take the aver-age using the “future” data).
Results
The inflation of the deep spherical source, labeled (A) in Fig. 3, appears to have started in late March 2015 (Fig. 4). The inflation rate does not appear to have been stable during the initial phase, with the volume change rates
estimated via linear regressions of four intervals dur-ing this initial phase. First, there was a rapid increase of 7.9 × 10⁴ m3/day from late March to early April, which then slowed to 2.4 × 10⁴ m3/day in early to mid-April. The deep source underwent another rapid inflation at ~ 9.3 × 10⁴ m3/day from late April to mid-June. The deep source appeared to be relatively stable after mid-June, with another inflation after the eruption, which occurred from June 29 to July 1. This inflation continued until the end of August at ~ 2.1 × 10⁴ m3/day.
The inflation of the shallow open crack source, labeled (B) in Fig. 3, appears to have started gradually in mid-May and continued until early August at an inflation rate of 1.7 × 10³ m3/day. It is noteworthy that there was no rate change for this source that was related to the erup-tion. This shallow open crack source appears to have deflated slowly after mid-September at 0.4 × 10³ m3/day.
−2.0E+06 −1.0E+06 0.0E+00 1.0E+06 2.0E+06 3.0E+06 4.0E+06 5.0E+06 6.0E+06 7.0E+06 8.0E+06 9.0E+06 1.0E+07
−2.0E+05 −1.0E+05 0.0E+00 1.0E+05 2.0E+05 3.0E+05 4.0E+05 5.0E+05 6.0E+05 7.0E+05 8.0E+05 9.0E+05 1.0E+06
3 4 5 6 7 8 9 10 11 12 1 2 3 4 5 6
2015 2016
3 4 5 6 720158 9 10 11 12 1 2 320164 5 6
0 200 400 600 800 1000 1200
3 4 5 6 7 8 9 10 11 12 1 2 3 4 5 6
2015 2016
Amount of volume change ( deep spherical inflation source,
m
3 )
Amount of volume change ( shallow dike and sill source,
m
3 )
deep spherical inflation source
shallow sill source
shallow open crack source
a
b
Number of EQ. (/day)
Fig. 4 a Volume changes of the three sources before and after the 2015 volcanic unrest at Hakone volcano (from March 2015 to June 2016). The blue, orange, and green symbols are the total volume changes of the deep spherical inflation, shallow open crack, and sill sources, respectively. Gray plots mean that an estimated error is large (RMS error ≥ 3.0 × 10⁻³). b Daily number of earthquakes at Hakone volcano during the same period as
Although fluctuations are still evident in the last stage, after April 2016, these may be due to the unstable solu-tion of the inversion since the RMS error for this period (3.0 × 10⁻³) is much larger than the other periods. The deflation pattern continued until June 2016, but the vol-canic crustal deformation subsequently became obscured by the tectonic movements of the Philippine Sea Plate.
The inflation of the shallow sill source, labeled (C) in Fig. 3, showed no significant contribution to the crustal deformation detected by this GNSS analysis. We consider that the sparse GNSS observation network was unable to detect such a local and small sill in the shallow crust in the Hakone volcano region.
Discussion
Our GNSS analysis detected the inflation of a deep spherical source in late March 2015, well before the onset of the seismic swarm activity in late April. It is interesting to note that a deep low-frequency event (DLF) began at approximately the same time as the inflation (Yukutake and Abe 2018; Mannen et al. 2018). However, the DLF occurred at 15–30 km depth, much deeper than the deep spherical source at 5–6 km depth (see Fig. 3). Yukutake and Abe (2018) hypothesized that the DLF event may be due to an increase in magmatic fluid pressure. This suggests that such fluid may have migrated to shallower depths, potentially generating inflation of the deep spher-ical source discussed here.
The inflation of the deep source initially ceased by mid-April but was later reactivated. The second inflation in late April appears to coincide with the April 26 onset of the earthquake swarm. This sequence is potentially related to the inflation of a hydrothermal system beneath the volcano due to the injection of hydrothermal flu-ids separated from the underlying magma chamber. It is expected that this injection increased the pore fluid pres-sure within the fracture zone and enhanced the shallow seismic activity (Yukutake et al. 2011), coinciding with the shallow inflation that initiated in late May. The con-tinued shallow inflation during the post-eruption period notably persists after the eruption, indicating that the eruption did not ease the pore pressure to stop inflation beneath the volcano.
Here, an open crack, which is indicated by a set of InSAR images before and after the eruption (June 18– July 2 and June 7–July 5 pairs; Doke et al. 2018a), repre-sents the shallow inflation source. As shown above, the shallow inflation began in mid-May. However, the infla-tion of the open crack prior to June 18 was unclear in the InSAR images. We therefore consider the shallow infla-tion as an inflainfla-tion of the fracture system beneath the volcano instead of an open crack inflation.
The inflations in the deep spherical and shallow open crack sources appear to have ceased in late August. Late August may be considered the end of the hydrothermal fluid injection from the deep magma source since there was significantly reduced seismic activity prior to August. The shallow open crack then began to deflate from mid-September. We interpret the crack deflation as the with-drawal of hydrothermal fluid due to closure of the crack or fracture system. The hydrothermal fluid may have been released to the surface gradually from the newly formed fumarole area in Owakudani just above the open crack.
However, there is no evidence of deep source deflation, which is evident from the unchanged baseline length (Fig. 2d). The lack of deflation at depth indicates that the deep spherical source remained inflated. Magma intru-sion within the crust (~ 6.5 km below sea level) could also be possible, but there are no other observations to sup-port this hypothesis. We surmise that the lack of deflation implies the accumulation of magma and/or hydrother-mal fluid at depth. Since accumulation of hydrotherhydrother-mal fluid and magma could be a preparatory process of larger eruptions in the future (e.g., Murase et al. 2016), volume change monitoring and hydrothermal system modeling in this depth range are critically important in the erup-tion forecasting of Hakone volcano.
Conclusion
and disaster mitigation measures to better prepare for future eruptions.
Abbreviations
DLF: deep low-frequency event; GEONET: GNSS Earth Observation Network System; GNSS: Global Navigation Satellite System; GSI: Geospatial Information Authority of Japan; HSRI: Hot Springs Research Institute of Kanagawa Prefec-ture; IGS: International GNSS service InSAR, interferometric synthetic aperture radar; RMS: root-mean-square.
Authors’ contributions
MH engaged in the GNSS analysis and drafted the manuscript. RD processed the GNSS data and determined the daily coordinates of our original GNSS sites. KM, KI, and MS assisted in the study and edited the manuscript. All authors read and approved the final manuscript.
Acknowledgements
The authors would like to acknowledge the helpful support of Dr. Akio Yoshida, Dr. Ryou Honda, Dr. Yohei Yukutake, Dr. Yuki Abe, and Dr. Teruyuki Kato. Gratitude is extended to the Geospatial Information Authority of Japan for providing the GNSS data used in this study. We used the MaGCAP-V soft-ware (Fukui et al. 2013) for the analysis. This manuscript was greatly improved by constructive comments from two anonymous reviewers and Editor Mitsuhiro Nakagawa.
Competing interests
The authors declare that they have no competing interests
Availability of data and materials
The data that support the findings of this study are available upon request from the corresponding author, with the exception of the GEONET data, which are available through the GSI Web site.
Consent for publication
Not applicable.
Ethics approval and consent to participate
Not applicable.
Funding
This study was implemented as an ordinary research project of HSRI.
Publisher’s Note
Springer Nature remains neutral with regard to jurisdictional claims in pub-lished maps and institutional affiliations.
Received: 28 March 2018 Accepted: 14 September 2018
References
Barberi F, Bertagnini A, Landi P, Principe C (1992) A review on phreatic erup-tions and their precursors. J Volcanol Geotherm Res 52:231–246. https :// doi.org/10.1016/0377-0273(92)90046 -G
Dach R, Hugentobler U, Fridez P, Meindl M (2007) Bernese GPS Software Ver-sion 5.0. Astronomical Inst. Univ., Bern, p 612
Doke R, Harada M, Mannen K, Itadera K, Takenaka J (2018a) InSAR analysis for detecting the route of hydrothermal fluid to the surface during the 2015 phreatic eruption of Hakone Volcano, Japan. Earth Planets Space 70:63. https ://doi.org/10.1186/s4062 3-018-0834-4
Doke R, Harada M, Miyaoka K (2018b) GNSS observation and monitoring of the Hakone Volcano and the 2015 unrest. J Disaster Res 13:526–534. https :// doi.org/10.20965 /jdr.2018.p0526
Fukui K, Ando S, Fujiwara K, Kitagawa S, Kokubo K, Onizwa S, Sakai T, Shimbori T, Takagi A, Yamamoto T, Yamasato H, Yamazaki A (2013) MaGCAP-V: Win-dows-based software to analyze ground deformation and geomagnetic change in volcanic areas. IAVCEI 2013 Scientific Assembly, Kagoshima, pp 2C–P8
Harada M, Hosono K, Ito H, Aketagawa T, Kobayashi A, Honda R, Yukutake Y, Yoshida A (2010) Swarm activity and crustal deformation in Hakone. Programme and abstracts of the Volcanological Society of Japan 2010 Fall Meeting, p 29 (in Japanese)
Harada M, Itadera K, Honda R, Yukutake Y, Doke R (2015) Earthquake swarm activities and crustal movement of the 2015 volcanic event at Hakone Volcano (Rapid results). Bull Hot Springs Res Inst Kanagawa Pref 47:1–10
(in Japanese with English abstract)
Kato A, Terakawa T, Yamanaka Y, Maeda Y, Horikawa S, Matsuhiro K, Okuda T (2015) Preparatory and precursory processes leading up to the 2014 phreatic eruption of Mount Ontake, Japan. Earth Planets Space 67:111. https ://doi.org/10.1186/s4062 3-015-0288-x
Mannen K, Yukutake Y, Kikugawa G, Harada M, Itadera K, Takenaka J (2018) Chronology of the 2015 eruption of Hakone volcano, Japan—geological background, mechanism of volcanic unrest and disaster mitigation meas-ures during the crisis. Earth Planets Space 70:68. https ://doi.org/10.1186/ s4062 3-018-0844-2
Murase M, Kimata F, Yamanaka Y, Horikawa S, Matsuhiro K, Matsushima T, Mori H, Ohkura T, Yoshikawa S, Miyajima R, Inoue H, Mishima T, Sonoda T, Uchida K, Yamamoto K, Nakamichi H (2016) Preparatory process preced-ing the 2014 eruption of Mount Ontake volcano, Japan: insights from precise leveling measurements. Earth Planets Space 68:9. https ://doi. org/10.1186/s4062 3-016-0386-4
Takada A, Mannen K, Ukawa M, Chiba T (2007) Fuji and Hakone Volcanoes, field trip guidebook cities on Volcanoes 5 conference. Bull Volcanological Soc., Japan, p 41p
Yukutake, Y, Abe Y (2018) Deep low-frequency earthquakes beneath Hakone volcano, central Japan, and their relation to the volcanic activity, JpGU Meeting 2018, SVC41-03
Yukutake Y, Ito H, Honda R, Harada M, Tanada T, Yoshida A (2011) Fluid-induced swarm earthquake sequence revealed by precisely determined hypo-centers and focal mechanisms in the 2009 activity at Hakone volcano, Japan. J Geophys Res 116:B04308. https ://doi.org/10.1029/2010J B0080 36 Yukutake Y, Honda R, Harada M, Arai R, Matsubara M (2015) A
magma-hydrothermal system beneath Hakone volcano, central Japan, revealed by highly resolved velocity structures. J Geophys Res Solid Earth 120(5):3293–3308