111 Copy right © The Society of Geomagnetism and Earth, Planetary and Space Sciences (SGEPSS); The Seismological Society of Japan; The Volcanological Society of Japan; The Geodetic Society of Japan; The Japanese Society for Planetary Sciences.
Equatorial electrojet studies from rocket and ground measurements
H. Chandra1, H. S. S. Sinha1, and R. G. Rastogi1,2
1Physical Research Laboratory, Ahmedabad, India 380 009 2Gujarat University, Ahmedabad, India 380 009
(Received July 5, 1999; Revised November 4, 1999; Accepted November 15, 1999)
Combining the data of in-situ measurements of ionospheric current, J
m by rocket-borne instruments and the ground based geomagnetic H field close to the magnetic equator a linear relation has been found between the peak current density J
m and the daily range of H, (RH). This relationship has been used to convert long series of RH data into Jm. Combining Jm and the E-region peak electron density Nm, the electron velocity in the ionosphere, VE has been calculated. It is shown that after all corrections are made of the solar zenith angle variations, the ionospheric current as well as electron drift in American and Indian sectors show strong equinoctial maxima, the mean values of both the parameters are larger at American than in Indian sector. The solar cycle variation of the electrojet current is primarily due to the variations of NmE, and not due to the variations of electric field. The diurnal variation of the electric field with peak at 09–10 LT interacting with noon peak of NmE making ΔH to peak at an hour earlier than noon. It is stressed to realise the importance of electric field in diurnal, seasonal and longitudinal variations of the equatorial electrojet current.
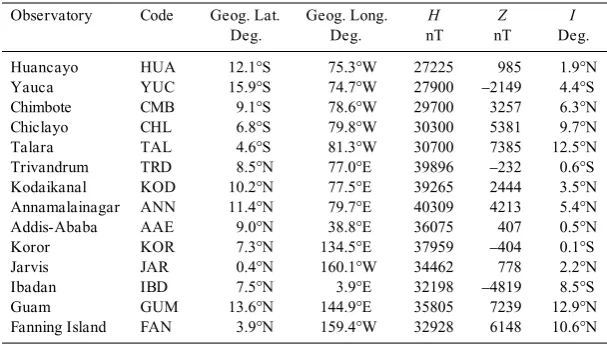
at Yauca, Chimbote, Chiclayo and Talara covered the whole width of the EEJ. In India new observatories were established at Trivandrum and Annamalainagar. EEJ observatories were organised at Koror, Jarvis and Ibadan. Table 1 gives the coordinates and the magnetic field parameters of some of these observatories.
Chapman and Rajarao (1965) showed that the seasonal variations of the range in H as well as in Z at the equatorial electrojet stations have strong semi-annual wave with maxima during equinoctial months. Analysing the lunar tides in the critical frequency of the F2 layer, foF2, at equatorial stations in Peru and in India during the IGY period, Rastogi (1962a) predicted that the equatorial electrojet current strength must be stronger in Peru than in India. Later using the geomagnetic data from the equatorial observatories during IGY, Rastogi (1962b) confirmed that the electrojet current is indeed stronger in Peru than in India. The strength of the electrojet current was shown to vary roughly inversally to the background mean value of the geomagnetic field H at the station. It was suggested that the electrical conductivity over the magnetic equator is inversally proportional to the strength of the H field.
If equatorial electrojet is a part of the global Sq current system, modified close to the magnetic equator, the day to day variations in the strength of the equatorial electrojet should correlate with the corresponding variations in the strength of the Sq currents at low latitudes outside the electrojet belt. However the daily ranges of H at different latitudes were found not to correlate well (Osborne, 1966; Schlapp, 1968; Kane, 1971). James et al. (1996) has shown that the correlation of ΔH at an equatorial station, Trivandrum, with ΔH at other stations in India decreases with increasing latitude. It becomes almost zero around 25°N geographic latitude, negative around 35°N latitude
1. Introduction
The first regular geomagnetic observatory close the magnetic equator was established at Trivandrum, India in 1841. The observations were restricted to the declination component and significant solar daily, seasonal and solar cycle variations were shown (Broun, 1874). Later, a standard geomagnetic observatory was established in India at Kodaikanal in 1902 by the Survey of India, as a base station for the magnetic survey, which is located within three degrees from the magnetic equator. An ionospheric radio sounding station was also established at Kodaikanal in 1952 and both the ionospheric and the magnetic observations are continued even today. It is clear now that the latitudinal variation of ΔH has significant longitudinal effects.
However it was the establishment of a geomagnetic observatory at Huancayo, Peru in 1922 that brought into attention the abnormally large solar daily variations of the horizontal component, H, at an equatorial station. Combining the data from Huancayo with the data from the low latitude stations Kodaikanal, Madras in India and Antipolo and Batavia, Egedal (1947) showed that an enhancement in the solar daily variation of H,SqH, occurs within 5° latitude centred on the dip equator. He suggested this enhancement was caused by a band of electric current of about 300 km in width flowing over the dip equator which was later named “Equatorial electrojet” by Chapman (1951).
and again becomes zero at a station north of the S
q focus. This was suggested due to the superimposition of an additional current system over the normal S
q current system. Later James et al. (1997) isolated a low latitude current system centred at 5° dip latitude superimposed on the normal S
q current system centred at 20° dip latitude, during a partial equatorial counter electrojet day.
Onwumechilliet al. (1973) showed a close relationship between the equatorial electrojet and polar magnetic variations on a day to day basis. Rastogi et al. (1994) showed that the seasonal variation of the daily range of H shows equinoctial maxima at Trivandrum, Kodaikanal and Annamalainagar and slowly vanishes at stations further north. It was suggested that the equatorial stations are affected by the imposition of east-west electric field in addition to that generated by the dynamo action of the earth’s ionosphere. Thus, the equatorial electrojet current is far more complex than the picture accepted after the understanding of the abnormal electric conductivities.
Chandraet al. (1971) observed equinoctial maxima in ionospheric drift speed at an equatorial station Thumba, similar to that seen in the range of H. Similar equinoctial maxima have been reported in the vertical F-region drifts
at Jicamarca by Fejer et al. (1979) and at Thumba
(Vikramkumaret al., 1984). Rastogi et al. (1994) showed that it is the semi-annual wave in S
qH, which is enhanced over the magnetic equator in the same way as the solar diurnal range of H itself. The seasonal variation of ΔH at non electrojet stations shows predominantly an annual wave with a maximum around summer months.
The current intensity in the ionosphere depends on the ionisation density as well as on the electric field. The daily, seasonal or solar cycle variation of the S
qH could be primarily due to one of these parameters or due to the simultaneous effects of both. The relative roles of these two parameters cannot be estimated from the observations of only the geomagnetic field. Using the simultaneous observations of the maximum E-region electron density, N
mE, and ΔH at Indian observatories, Rastogi (1993) showed that the solar cycle variation of ΔH at low latitudes is contributed primarily by the corresponding variation of N
mE, the electric field remaining fairly constant. The
seasonal variation of ΔH is contributed primarily by the corresponding variation of electric field. The daily variation of S
qH at an electrojet station is due to the combined effect of the daily variations of the electric field andE layer ionisation. Extending similar analysis Rastogi (1996a) suggested that the electric field is larger in the American than in the Indian region.
The establishment of a rocket launching station near the magnetic equator in India enabled Indian scientists to obtain direct observations of the equatorial electrojet current. In this paper we have attempted to combine rocket and ground based data to derive some new information about the variations of the equatorial electrojet current.
2. Solar Diurnal Variation of H
First of all we describe in Fig. 1 the quiet day solar daily variations of the northward field (ΔX) at the equatorial stations Huancayo (HUA), Koror (KOR), Trivandrum (TRD) and Addis-Ababa (ADB) during the three Lloyd seasons of the year 1958. The features common to all stations are (1) the midday value of ΔX is largest during the E-months and least during the local winter, (2) ΔX continues to increase rapidly after the sunrise to reach a peak at 1100–1200 hr almost in a linear progression, and (3) the decrease of ΔX in the afternoon is gradual and continues even after the sunset. These features are in conformity with those described earlier by Rastogi and Iyer (1976). Some of the features differing with stations are (1) ΔX at Huancayo during E and J months continues to increase from the midnight to sunrise when there is no solar radiation, (2) at Addis-Ababa, ΔX continues to decrease significantly from the midnight to sunrise. Takeda et al. (1986) simulated the ionospheric currents assuming a constant mode tidal winds and IRI model for electron density. They showed that nocturnal currents are not negligible during high solar activity. Rastogi et al. (1996b) had also shown that the night-time variations of ΔH at Huancayo during different seasons compared very well with the corresponding variations of the electric field derived from the E-region horizontal and F-region vertical drifts at Jicamarca. It is still a question as to what are the
sources of these night-time electric fields.
The daily range in H is usually defined with midnight
value or a mean of few hours around midnight as the base value. Due to the changes of few nT in the night time as seen in the daily variations described here one has to consider the overall implications when comparing the data at different stations or different epochs.
3. Latitudinal Variation of the Daily Range of H
Figure 2 shows the variation of the mean solar daily range of H with dip angle for equatorial stations during the IGY/IGC period (Rastogi, 1964). The names of the stations and the values of the mean horizontal component of the geomagnetic field (in units of 1000 nT) are also indicated in the figure. The latitudinal variations can be obtained
only for the longitude regions around 75°W (Peru) and
around 75°E (India). The ΔH values in the American
sector are invariably larger than at corresponding latitude in the Indian region. This was first explained by Rastogi
(1962b) as due to the fact that the mean H field was 40,000
nT in India and about 28,000 nT in Peru. There are few
exceptions to this however. At Addis-Ababa where the H
field was 36075 nT the range of H is smaller than at
Trivandrum with mean value of H of 39896 nT. It is also
to be noted that the two stations are separated by only
three hours in longitude. Also the range in H at Ibadan is
significantly larger than the corresponding value at Chimbote and Chiclayo having the same magnetic inclination.
For a comparative study of the electrojet range over the magnetic equator in the American and Indian longitudes,
we have to extrapolate the range H at Huancayo and
Kodaikanal to the values over the magnetic equator in their respective longitudes. In the plots shown in Fig. 2,
the range H has been extrapolated at the dip equator for
both the longitude sectors. The daily range in H at
Huancayo was 167 nT while the extrapolated value over the equator was 176 nT with a correction factor of 1.05. Similarly the daily range at Kodaikanal was 107 nT while the extrapolated value over the magnetic equator was 129 nT. Thus the correction factor for Kodaikanal was 1.21. The ratio of range at Huancayo to that at Kodaikanal (1.56) has therefore to be multiplied by 0.87 for extrapolation to the magnetic equators in the respective regions. The ratio of range H at the magnetic equator in the two longitude sectors therefore reduces to 1.36. The factor of 0.87 has to be kept in mind while comparing the longitudinal effects in the electrojet in the American and Indian sectors using observed data at Huancayo and Kodaikanal.
Using the equatorial electrojet data from the POGO satellite, Cain and Sweeney (1973) noted significant
departures from the accepted fact that the range H is
inversely proportional to the background H field. They
observed that the amplitudes ΔH over the longitude range
50–90°W averaged 60% higher than elsewhere as expected
due to weaker main field but the expected minimum in
Fig. 1. Daily variations of ΔH at Huancayo (HUA), Koror (KOR), Trivandrum (TRD) and Kodaikanal (KOD) during different seasons of 1958.
based on the mean of five international quiet days for each month. It is well known that the diurnal component of the
range in H in the electrojet region remains unchanged
during counter electrojet days however the semi-diurnal component undergoes drastic changes on such days (Somayajulu, 1988). A non-electrojet station like Alibag
Ai = ai(1 + biRz) (1)
and the resultant expressions are given below
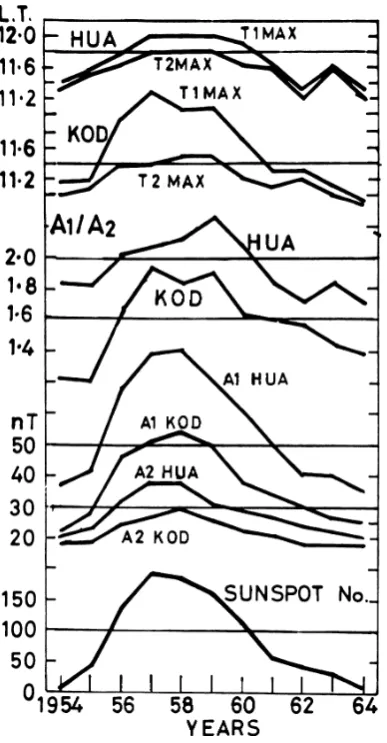
A1 (KOD) = 22 (1 + 0.0072R) nT,
A1 (HUA) = 33 (1 + 0.0074R) nT,
A2 (KOD) = 16 (1 + 0.0041R) nT,
A2 (HUA) = 20 (1 + 0.0043R) nT.
It is seen that the value of A1 at Huancayo is 1.5 times the
value at Kodaikanal. The value of A2 at Huancayo is 1.25
times the value at Kodaikanal. Further the value of b1 at
Kodaikanal or at Huancayo is about 0.007 while the value ofb2 at both the stations is about 0.004. This shows that the diurnal component of the equatorial electrojet is significantly more important than the semi-diurnal component.
The time of maximum of the diurnal component varies from 11.3 to 12.0 hr. LT at for Huancayo with the variation of the solar activity. For the semi-diurnal component the variation is from 11.2 to 11.8 hr. LT. This causes the daily
peak of ΔH to occur nearer to the noon during high solar
activity years. At Kodaikanal the time of maximum of the semi-diurnal component varies from 11.0 to 11.5 hr. LT with the variation of solar activity. However the time of maximum of the diurnal component, T1, varies from 11.2 to 12.3 hr. LT from minimum to maximum solar activity. The delaying of the time of maximum with increasing solar activity is in conformity with the earlier results of Rastogi and Iyer (1976). Patel and Rastogi (1978) have made a detailed study of the coefficients of diurnal and
semi-diurnal components in the solar daily variations of H
at Huancayo and Trivandrum. They showed that the
semi-diurnal component a2 is greater at Huancayo than at
Trivandrum during the months of September to March
while during April to August the amplitude a2 is larger at
Trivandrum than at Huancayo. The diurnal component a1
is larger at Huancayo than at Trivandrum during any of the
months of the year. Thus whereas a2 is affected by the
local season, being larger during local summer months;
the amplitude a1 is maximum at any longitude during
equinoxes and for any particular month it is larger in the American than in the Indian longitudes. The importance of the solar diurnal component points to the role of the
solar thermal tides to have a major role in the atmospheric dynamics.
A closer scrutiny of the coefficients a and b shows that the values of coefficient b are practically the same at both Kadaikanal and Huancayo. This means that the longitudinal inequality in the equatorial electrojet exists during the quietest periods of the solar activity. With the rise of solar activity the ranges at the two stations increase in same proportion. Thus the source of the inequality remains the same for different epochs. It is to be ascertained that the solar activity effects in the equatorial electrojet are due to the electrical conductivity and one needs other ionospheric data to answer these questions. The solar activity recorded its minimum during 1954, maximum in 1958 and back to another minimum in 1964. The solar cycle variations of
range of H at Huancayo as well as Kodaikanal following
the variations of the sunspot numbers is very clear at least on an annual basis.
The magnitude of the electrojet current is generally identified as the solar daily range of the H field, RH, at an electrojet station. In Fig. 4 are shown the average month
to month variations of RH(HUA),RH(KOD) and the ratio
RH(HUA)/RH(KOD). The seasonal variations of RH(HUA)
andRH(KOD) show clearly the equinoctial maxima during
any solar epoch year. The ratio RH(HUA)/RH(KOD) varied
from 1.0 to 3.0 on individual months and does not indicate any systematic variation with solar cycle. The ratio seems to be larger during December when it is summer at Huancayo and winter at Kodaikanal. It is clearly seen that in spite of large equinoctial maxima in the seasonal
variations of the ranges, the ratio does not show any semi-annual wave. It has a maximum value of 1.9 during
December–January and a minimum value of 1.4 around
April. The annual average value of RH(HUA)/RH(KOD) is
1.63. Normalised to the magnetic equator at the respective longitudes the ratio of diurnal range in American to Indian
zones comes to 1.63 × 0.90 = 1.47.
5. Ionospheric Drift Observations of Equatorial Electrojet
With the establishment of an equatorial rocket launching station at Thumba in India an ionospheric research station was set up. Many important results came out from the ionospheric drift measurements made at Thumba during
1964–69 using the spaced receiver method of Mitra (1949).
The drifts were found to be westward during daytime and eastward during nighttime (Deshpande and Rastogi, 1966, Chandra and Rastogi, 1970). A high correlation between the drift speed and the range in H was established later and thus the drift measurements provided an excellent means of monitoring the equatorial electric field (Chandra et al., 1971). Some new results on equatorial electrojet and counter electrojet, especially during geomagnetic periods were obtained by combining the drift data with the ground measurement of geomagnetic field. The occasional
depressions in H (below the night level) were found to be
associated with the reversal of the electric field and the
disappearance of the ionospheric E-region irregularities
(Rastogiet al., 1971).
One rather unexpected result obtained from the long
series of drift observations at Thumba was that the peak
drift speed occurred around 09–10 LT, which is earlier
than the time of peak E-region electron density at 12 LT.
Figure 5 shows the mean daily variations of the E-region
drift speed at Thumba, range in H at Kodaikanal and the
maximumE-region electron density, NmE averaged over
the years 1964–65. It must be noted that while the daily
variation of H is based on five quiet days, that of NmE is based on monthly mean values. The daily variation of the drift speed is based on large number of observations (minimum of 200 at any hour) and a typical value of the standard error in mean is also indicated in the figure (about 2%). The observed daily variation of the drift speed explained for the first time the peak in ΔH occurring
before noon (11 LT). This is because of the fact that ΔH,
results due to the combined effects of the electron density
and the electric field which peak at 12 LT and around 09–
10 LT respectively. VHF radar measurements of the F
-region vertical drift velocity over Jicamarca, in the American longitude sector, also show daytime peak
between 09 and 11 LT (Fejer et al., 1979).
The solar activity for the period 1964 to 1969 varied from a flux (at 2800 MHz) of 70 units to 140 units. The
mean drift speed in the E or F region did not show any
significant change (Misra et al., 1971). It was concluded
that the ionospheric electric field over the magnetic equator probably remains constant with the solar cycle and the observed variations of the electrojet strength are due to
the corresponding change of E region electron density and
hence of E region electric conductivities. There are not
many E-region measurements made from Jicamarca
however the vertical F-region drift measurements over
Jicamarca also showed that daytime drifts are usually
larger during low sunspot years (Fejer et al., 1979).
One of the very first rocket-borne experiments in India had been the detection and measurement of the altitude profile of the electrojet current by means of proton precession magnetometers. The results of these
observations have been consolidated in a series of papers by Sampath and Sastry (1979a, b). It was found that the maximum value of the ionospheric current was linearly
related to the ground measurements of ΔH at Kodaikanal.
When the observed profiles during different rocket flights were plotted with individual peak current normalised to a constant value then the profile of current remained remarkably constant. Figure 6 shows the composite result of four rocket flights conducted around midday hours
normalised to the peak current of 10 A/km2. Thus for a
comparative study of the electrojet, ΔH at ground can be
taken as precise indication of the electrojet current in the
E-region.
The second series of rocket experiments on the equatorial electrojet studies in India had been the measurements of
electron density profiles in the E-region using Langmuir
probe and the resonance probe (Prakash et al., 1972).
Figure 7 shows the superposed altitude profiles of electron
density for midday (10–14 h) over Thumba (Subbaraya et
al., 1983). The date and time of the measurements of the
12 profiles is provided in Table 2. It is seen that in spite of different days of the experiments when the equatorial electrojet current could have been different the electron density profiles were similar. Leaving apart the two profiles with extreme values (which were on counter electrojet days) the electron density at 100 km altitude differ by only
about±15%. One can conclude therefore that during an
epoch of time, in which solar activity did not alter
appreciably,NmE (maximum E region electron density)
did not change very much. Therefore the day to day variability in the equatorial electrojet (or in the range of
H) is largely due to the corresponding variations of the
electric field.
Fig. 5. The daily variations of the E-region drift (eastward) over Thumba, range in H at Kodaikanal and the maximum E-region electron density over Kodaikanal averaged over the years 1964–65.
6. Variations of Range in H and E-region Electron Density
The solar daily range of H at equatorial station is due to
an eastward current in the E region. Rastogi (1993),
assuming the currents to be proportional to the product of the conductivity or N
mE and the electric filed (ξ), suggested
that the ΔH at any time t, can be given as
ΔH(t)∝N
mE(t)ξ(t)
and an index K related to the electric field can be computed by
K = ΔH(t)/N mE(t).
Fortunately, for a limited number of years 1958–1966,
the parameter f
bEs, which is a measure of the critical
frequency of the E layer ( f
oE in MHz) are available at both
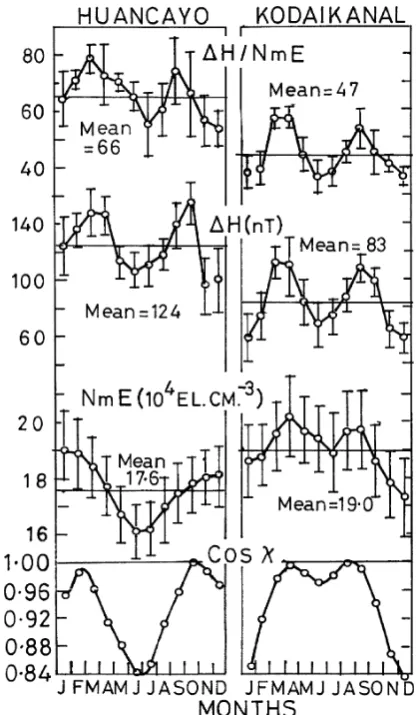
the stations Huancayo and Kodaikanal. In Fig. 8 we have
plotted the mean month to month values of N
mE,ΔH and ΔH/N
mE for both Huancayo and Kodaikanal averaged
over the years 1958–65. These are also compared with the
seasonal variations of the cosine of the solar zenith angle
(cosχ) for both the stations. It may be recalled that
Huancayo is situated at 12.1°S and Kodaikanal at 10.2°N
and hence the seasonal variations of cosχ are inverse to
each other. The seasonal variations of N
mE at Huancayo
and Kodaikanal are very similar to the corresponding variations of the solar zenith angle at the respective places. This is in conformity with the fact that the E-layer ionisation density follows very closely the zenith angle of
the Sun according to the modified Chapman’s law of
ionisation in upper atmosphere. The mean value of N
mE is
19.0× 10⁴ el. cm–3 at Kodaikanal compared to a value of
17.6× 10⁴ el. cm–3 at Huancayo and this seems to be due
to the lower geographic latitude of Kodaikanal than of Huancayo.
Fig. 7. Mass plot of the electron densities obtained from twelve daytime rocket experiments conducted at Thumba during the period 1966 to 1978 (after Subbaraya et al., 1983).
Serial No. Flight Number Date Time Rz
1 N.A. 20.05 07-07-66 1345 58 2 N.A. 20.07 29-08-68 1415 64 3 N.A. 10.37 28-01-71 1040 109 4 N.A. 10.38 28-01-71 1110 109 5 N.A. 10.43 07-04-72 1230 71 6 N.A. 10.44 13-10-72 1229 15 7 N.A. 10.45 03-03-73 1220 35
8 Co. 16 17-08-72 1532 55
9 Co. 04 19-02-75 1105 0
10 Co. 22 21-04-75 1341 0
11 Co. 40 04-06-77 1120 25
12 P. 159 09-02-75 1233 22
Table 2. Details of rocket flights conducted from Thumba around midday to measure electron density.
7. Ground Based and Rocket-Borne Measure-ments of the Electrojet Current
The measurements of equatorial electrojet current by the fluxgate magnetometer using rocket-borne instruments have been made in India (Maynard and Cahill, 1965; Sastry, 1968). Similar measurements were made in the American sector, off the coast of Peru (Maynard, 1967;
Davieset al., 1967; Schuman, 1970). Direct comparison
of the electrojet strength in the two longitudes could not be made as these few measurements were made during different epochs of time. Sampath and Sastry (1979a, b) have consolidated the data from the series of observations in India and showed that the peak current measured by the rocket-borne instrument over Thumba varies linearly with
the magnitude of ΔH at Kodaikanal at the same time. A
similar comparison has been now made between the rocket measurements of electrojet current in Peru and the
amplitude of ΔH at Huancayo at the time of the rocket
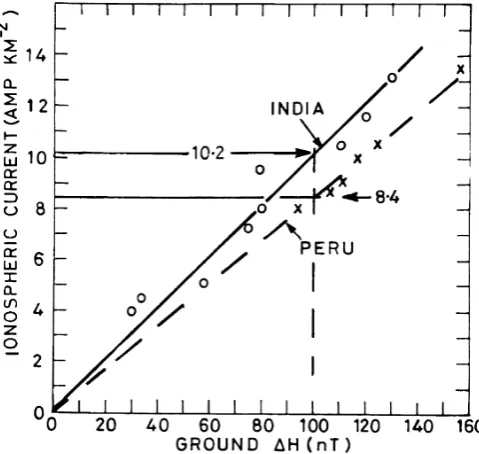
experiment (Sinha et al., 1999). Figure 9 shows the
relationships between the two parameters for the two longitude sectors. It is seen that for the Western Hemisphere too the peak electrojet current, Jm is linearly related to the
ground measurements of ΔH, however the regression
lines are different. A change of 100 nT at ground is
equivalent to an ionospheric current of 10.2 Amp km–2 for
the Indian longitudes and of only 8.4 Amp km–2 for the
American longitudes. In other words a current of 10 Amp km–2 in the E region would produce a value of ΔH of 98 nT
in the Indian and of 119 nT in the American longitudes. Comparison of the altitude profiles of current density in the two longitude sectors shows the altitudes of peak current density are at 106 and 108 km with half widths of
12 and 10 km respectively at Thumba and Peru (Sinha et
al., 1999). Thus the larger value of range in H at Peru
could possibly be either due to a greater width of the electrojet along N-S over Peru than over Thumba.
The relationship between Jm and ΔH is not affected by
induction, magnetospheric or any other effects. If we
assume that the relationship between Jm and ΔH remains
practically the same during different epochs then the long
series of ground measurements of ΔH in the two longitude
sectors can be converted into series of E-region current
strengthJ.E-region peak electron densities (NmE) are also available for certain epoch both at Huancayo and
Kodaikanal. The electron velocity V (ms–1) can be
calculated using the equation
Fig. 9. Relationship between the peak current density in ionosphere as measured by rocket-borne measurements in India and Peru and ΔH measured at ground at same time.
J = N·e·V.
WhereN is the electron density (m–3),e is the electronic
charge (Coulumb) and J is the current (Amp m–2). The
month to month variations of the peak electron density
N
mE at midday, current density J and the electron velocity V
E over Huancayo and Kodaikanal are shown in Fig. 10
for the years 1958–1965. The ratios of the values at
Huancayo to that at Kodaikanal are also plotted in the figure. From the figure it is seen that all the parameters N
m, J or V
E show very distinct solar cycle variations. The ratio
N
m(HUA)/Nm(KOD) shows consistent and similar seasonal
variation year after year with a minimum around June and maximum around December months. This confirms the
earlier conclusion that the E region peak electron density
strictly follows the law N
m∝ cos
ηχ (Rastogi, 1958)
The current density J does not follow the seasonal
variation of N
m as would be expected if the conductivity
was the main controlling factor for J. However distinct
semi-annual waves are seen during any of the years. The ratio of the current over Huancayo to over Kodaikanal,
J
(HUA/KOD), varies between 1.0 and 1.5 in general with
highest values around December solstice. The estimated electron velocity, V
E also show distinct equinoctial maxima
at both the stations. However the values are much larger over Huancayo than over Kodaikanal especially during
high sunspot years. The V
E over Huancayo show clear
solar cycle variation with values exceeding 400 m/s during high sunspot years and between 250 to 400 m/s during low
sunspot years. The ratio V
E(HUA/KOD) varies between 1.0 and
2.0 with no clear seasonal variation.
The mean seasonal variations of the current density J
and velocity V
E for Huancayo and Kodaikanal averaged
over the years 1958–65 are shown in Fig. 11. The current
Fig. 12. Mean seasonal variations of the ratios of the values over Huancayo to that at over Kodaikanal for the parameters NmE,ΔH,J andVE averaged over the years 1958–65.
Fig. 10. Month to month variations of the midday values of the E region electron density (NmE), estimated ionospheric current density (J) and the estimated horizontal electron velocity (VE) at Huancayo (HUA) and Kodaikanal (KOD) for the epoch 1958–65 compared with corresponding variation of the sunspots. The ratio of these parameters (HUA/KOD) are also shown in the figure.
Fig. 11. Mean seasonal variations of the estimated current density and electron velocity over Huancayo and Kodaikanal averaged over the years 1958–65.
maxima at both the stations. The average values are 10.6 Amp·km–2 for Huancayo and 8.6 km–2 for Kodaikanal. The
drift velocity also shows clear equinoctial maxima with average values of 345 m/s and 270 m/s respectively over Huancayo and Kodaikanal.
Finally we show the seasonal variations of the ratios of values at Huancayo and Kodaikanal for the parameters
N
mE,ΔH,J and VE averaged over the epoch 1958–65 in
Fig. 12. The ratio of N
mE shows clearly an annual wave
with values varying from 1.05 in December-January to
0.85 in June with a mean value of 0.94. The ratio of ΔH
varies from about 1.85 during December–January to about
1.4 during June with a mean value of 1.63. The ratio in J
varies from about 1.4 in December-January to about 1.1
during June with a mean value of 1.24. The ratio in V
E does
not show a clear seasonal variation however and has mean value of 1.33.
8. Conclusion
The present analysis has shown that when corrections are made for the solar zenith angle variation with month, the seasonal variation of electrojet current maximises during equinoctial months. At other low latitude stations
ΔH is maximum around summer months. This clearly
References
Broun, J. A., Trivandrum magnetic observations Vol. I, 576 pp., Henry S. King and Co., London, 1874.
Cain, J. C. and R. E. Sweeney, The POGO data, J. Atmos. Terr. Phys., 35, 1271–1247, 1973.
Chandra, H. and R. G. Rastogi, Daily variation of F-region drifts at Thumba,J. Atmos. Terr. Phys.,32, 1309–1311, 1970.
Chandra, H., R. K. Misra, and R. G. Rastogi, Equatorial ionospheric drift and the electrojet, Planet. Space Sci.,19, 1497–1503, 1971. Chapman, S., The equatorial electrojet as detected from the abnormal
electric current distribution above Huancayo, Peru and elsewhere, Arch. Meteorol. Geophys. Bioclimatal,A4, 368–390, 1951. Chapman, S. and K. S. Rajarao, The H and Z variations along and near
the equatorial electrojet in India, Africa and the Pacific, J. Atmos. Terr. Phys.,27, 559–581, 1965.
Davies, T. N, K. Burrows, and J. D. Stolarik, A latitude survey of the equatorial electrojet with rocket-borne magnetometers, J. Geophys. Res.,72, 1845–1861, 1967.
Deshpande, M. R. and R. G. Rastogi, Ionospheric horizontal drifts within the equatorial electrojet region in India, Ann. Geophys.,22, 418–421, 1966.
Egedal, J., The magnetic diurnal variation of the horizontal force near the magnetic equator, Terr. Magn. Atmos. Electr., 52, 449–451, 1947.
Fejer, B. G., D. T. Farley, R. F. Woodman, and C. Calderon, Dependence of the equatorial F-region vertical drifts on season and solar cycle, J. Geophys. Res.,84, 5792–5796, 1979.
James, M. E., D. Tripathi, and R. G. Rastogi, Day to day variability of ionospheric current system, Ind. J. Radio & Space Phys.,25, 36–43, 1996.
James, M. E., R. G. Rastogi, and D. R. K. Rao, Identification of the current system associated with a partially reversed equatorial electrojet,J. Geomag. Geoelectr.,49, 633–640, 1997.
Kane, R. P., Relationship between H ranges at equatorial and middle latitudes,J. Atmos. Terr. Phys.,33, 319–327, 1971.
Maynard, N. C., Measurements of ionospheric currents off the coast of Peru,J. Geophys. Res.,72, 1863–1875, 1967.
Maynard, N. C. and L. J. Cahill, Measurement of the equatorial electrojet over India, J. Geophys. Res.,70, 5923–5936, 1965.
Misra, R. K., H. Chandra, and R. G. Rastogi, Solar cycle effects in the electron drifts over the magnetic equator, J. Geomag. Geoelectr.,23, 181–186, 1971.
Mitra, S. N., A radio method of measuring winds in the ionosphere, Proc. IEEE,96, 441–446, 1949.
Onwumechilli, C. A. and C. E. Agu, Longitudinal variation of equatorial electrojet parameters derived from POGO satellite observations, Planet. Space Sci.,29, 627–634, 1981.
Onwumechilli, C. A., A. K. Kawasaki, and S.-I. Akasofu, Relationship between the equatorial electrojet and the polar magnetic variations, Planet. Space Sci.,21, 1–16, 1973.
Osborne, D. G., Correlations between quiet-day magnetic ranges, J. Atmos. Terr. Phys.,28, 45–51, 1966.
1024, 1964.
Rastogi, R. G., Geomagnetic field variations at low latitudes and ionospheric electric field, J. Atmos. Terr. Phys., 55, 1375–1381, 1993.
Rastogi, R. G. and K. N. Iyer, Quiet day variation of geomagnetic H field at low latitudes, J. Geomag. Geoelectr.,28, 461–478, 1976. Rastogi, R. G., H. Chandra, and S. C. Chakravarty, The disappearance
of equatorial Es and the reversal of electrojet current, Proc. Ind. Acad. Sci.,74, 62–67, 1971.
Rastogi, R. G., S. Alex, and A. Patil, Seasonal variation of geomagnetic D,H and Z fields at low latitudes, J. Geomag. Geoelectr.,46, 115–
126, 1994.
Rastogi, R. G., M. E. James, and D. Tripathi, Longitudinal inequalities in equatorial ionospheric electric field, Ind. J. Radio & Space Phys., 25, 27–35, 1996a.
Rastogi, R. G., H. Chandra, and M. E. James, Nocturnal variations of geomagnetic horizontal field at equatorial stations, Geophys. Res. Lett.,23, 2601–2604, 1996b.
Richmond, A. D., Modeling the ionosphere wind dynamo: A review, PAGEOPH,131, 413–435, 1989.
Sampath, S. and T. S. G. Sastry, Results from in-situ measurements of ionospheric currents in the equatorial region—I, J. Geomag. Geoelectr.,31, 373–379, 1979a.
Sampath, S. and T. S. G. Sastry, Depth of non conducting layer in the Indian ocean region around Thumba, derived from in situ investigations of equatorial electrojet—II,J. Geomag. Geoelectr., 31, 381–389, 1979b.
Sastry, T. S. G., Quiet day electrojet over Thumba, India, J. Geophys. Res.,73, 1789–1794, 1968.
Schlapp, D. M., World-wide morphology of day-to-day variability of Sq,J. Atmos. Terr. Phys.,30, 1761–1776, 1968.
Schuman, B. M., Rocket measurement of the equatorial electrojet, J. Geophys. Res.,75, 3889–3901, 1970.
Sinha, H. S. S., H. Chandra, and R. G. Rastogi, Longitudinal inequalities in the equatorial electrojet, Proc. Nat. Acad. Sci., India,69(A), I, 89–
96, 1999.
Somayajulu, V. V., Behaviour of harmonic components of the geomagnetic field during counter electrojet events, J. Geomag. Geoelectr.,40, 111–130, 1988.
Subbaraya, B. H., S. Prakash, and S. P. Gupta, Electron densities in the equatorial lower ionosphere from the Langmuir probe experiments conducted at Thumba during the years 1966–1978, Scientific Report ISRO-PRL-SR-15-83, 1983.
Takeda, M., Y. Yamada, and T. Araki, Simulation of ionospheric currents and geomagnetic field variations of Sq for different solar activity,J. Atmos. Terr. Phys.,48, 277–287, 1986.
Vikramkumar, B. T., K. S. Viswanathan, and P. B. Rao, VHF backscatter radar observations of the equatorial electrojet irregularities, Ann. Geophys.,2, 495–500, 1984.