Inversion analysis of the 2004 off the Kii peninsula earthquakes
using seismic intensity data
Katsuhisa Kanda and Masayuki Takemura
Kobori Research Complex, Kajima Corporation, Akasaka, Minato-ku, Tokyo 107-8502, Japan
(Received November 30, 2004; Revised April 16, 2005; Accepted April 16, 2005)
An inversion analysis has been developed to evaluate short-period radiation zones on an earthquake fault plane using seismic intensity data. It is robust and widely applicable even for historical earthquakes without ground motion, tsunami and geodetic data observed by instruments. It was applied to the 2004 off the Kii peninsula earthquakes that occurred in the Philippine Sea plate along the Nankai Trough. The short-period seismic wave radiation zone of each event during the 2004 off the Kii peninsula earthquakes from the inversion analysis was included in epicenter area of the corresponding aftershocks and slipped fault zone derived from the waveform inversion analysis as well. It may be also found that there were slip areas where little short period energy radiated. It also applied to the 1899/3/7 earthquake whose felt area was similar to that of the 2004 off the Kii peninsula earthquakes. However, it was indicated that the short-period radiation zones of the 1899 earthquake was located near the coast of the Kii peninsula and departed from that of the 2004 earthquake. The 1899 event might be an intermediate-depth earthquake in the Philippine Sea plate or a relative small interplate event at the west margin of the Tonankai earthquake source region.
Key words:Seismic intensity, inversion analysis, historical earthquake, Nankai trough, radiation energy.
1.
Introduction
The 2004 off the Kii peninsula earthquakes occurred in the Philippine Sea plate along the Nankai Trough where the Philippine Sea plate is subducting beneath the Eurasian plate. Fortunately, since the hypocenter was located more than 100 km away from the coast, it caused little damage instead of M7 class. The source region along the Nankai Trough, however, is one of the areas that attract attention most on disaster prevention these days. It reminds us of the huge interplate earthquakes called the Tonankai and Tokai earthquakes, which have repeatedly occurred in the neigh-boring region and have caused severe damage. Therefore it is important to evaluate the source characteristics of the 2004 earthquakes and its past neighboring earthquakes and to clarify the sequence of major events for the estimation of an imminent interplate earthquake.
We have found an earthquake of M7 class occurred in 1899 in the vicinity of this source region. Its felt-area was quite similar to that of the 2004 earthquake. The 1899 earth-quake occurred just at the time intermediate between the 1854 Ansei Tokai and the 1944 Showa Tonakai earthquake. The source characteristics of the 1899 earthquake should be compared to the 2004 earthquake.
Since there was no ground motion, tsunami and geodetic data measured by instruments before modernization, the number of earthquakes available for the analysis of source characteristics is restricted. In order to solve the issue, we have developed an inversion analysis method to evaluate the
Copy right cThe Society of Geomagnetism and Earth, Planetary and Space Sci-ences (SGEPSS); The Seismological Society of Japan; The Volcanological Society of Japan; The Geodetic Society of Japan; The Japanese Society for Planetary Sci-ences; TERRAPUB.
energy distribution radiated from an earthquake fault plane using seismic intensity data in JMA scale (Kanda et al., 2003, 2004). There is much seismic intensity data not only for recent earthquakes but also for historical earthquakes in Japan. Some seismic intensity data have been presumed from earthquake damage recorded in historical documents (e.g. Usami, 2003).
The seismic intensity inversion analysis applies to the 2004 off the Kii peninsula earthquakes. The earthquakes consisted of the sequence of large foreshocks, a main shock and aftershocks. The three largest events in moment magni-tude MW scale are adopted for the analysis as shown in Ta-ble 1. Accuracy of the analysis is discussed based on corre-spondence with an aftershock epicenter region and slipped fault area from the waveform inversion. And we discuss the difference of the analytical results among the events as well. It also applies to the 1899 earthquake to compare to the 2004 earthquake.
2.
Methodology
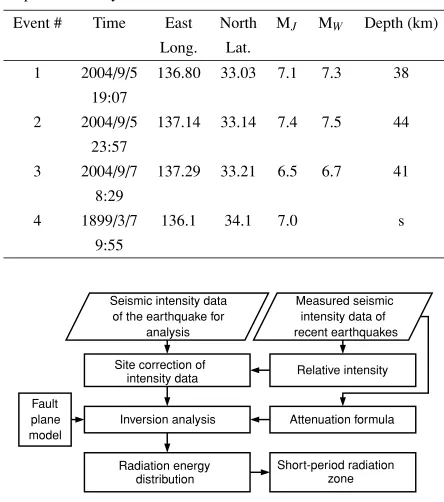
Figure 1 shows the overview of data processing and anal-ysis pipeline for the inversion analanal-ysis using seismic inten-sity data.
The attenuation formula of seismic intensity for the in-version analysis is expressed as:
I = −alogXeq
+bMI +c (1)
wherea,b,care constants estimated from the regression analysis using the measured seismic intensity data of mod-erate recent earthquakes near the source region. We adopt a=4.1,b=1.1 andc=4.7 for the Tonankai area (Kanda
et al., 2004). The relative intensity representing the local
Table 1. List of large events during the 2004 off the Kii peninsula earthquakes (JMA, 2004) and the 1899 earthquake (Utsu, 1982). s in the depth’s row denotes that the hypocenter was located in the vicinity of plate boundary.
Event # Time East North MJ MW Depth (km)
Long. Lat.
1 2004/9/5 136.80 33.03 7.1 7.3 38
19:07
2 2004/9/5 137.14 33.14 7.4 7.5 44
23:57
3 2004/9/7 137.29 33.21 6.5 6.7 41
8:29
of the earthquake for analysis
Fig. 1. Overview of data processing and analysis pipeline (Kandaet al., 2004).
soil amplification is evaluated as a mean of seismic inten-sities of observation subtracted from estimation from the attenuation formula (1) and is used for empirical site cor-rection of seismic intensity data. A fault plane is modeled to spread wide so that it may include whole slip area. The depth of assumed fault plane is assumed from the informa-tion of the hypocenter of past earthquakes and crustal struc-tures (Baba, 2003).
Once energyEi radiated from the ith sub-fault is given, the seismic intensity at an arbitrary station can be calculated using the attenuation formula (1) with equivalent hypocen-tral distanceXeq and the relative intensity Ir el. Xeq at the kth station is derived from the following equation (Ohnoet al., 1993):
In the inversion analysis, energy distribution on the fault plane is evaluated so as to minimize the estimated error J in Eq. (3) using the least square method:
J =
where the second term in right-hand side represents con-straint condition for normalization and the third to fifth
132° 133° 134° 135° 136° 137° 138° 139° 140°
Fig. 2. Relative intensity for earthquakes along the Pacific coast of middle Japan evaluated from measured seismic intensity data of recent earthquakes (Kandaet al., 2004).
terms for smoothing of energyEI. N is the number of sub faults.νis a parameter for smoothing of energy distribution, which can be estimated so as to minimize ABIC (Akaike and Bayesian Information Criteria) (Akaike and Kitagawa, 1999) in Eq. (4):
whereK is the number of observation stations, and P, Q and R are the number of sub-faults adjoining two to four other sub-faults, respectively. The source area of concen-trated energy where the radiation energy level is quite high is hereafter referred to as SPRZ (Short-Period Radiation Zone).
Figure 2 shows the contour map of relative intensity es-timated from recent earthquakes occurring in the Pacific coast side of middle Japan except shallow earthquakes. It shows the tendency that relative intensity is small in a mountain area and is large in a plain or a basin. It is mainly due to the local site effect such as soil amplification of sed-iment.
In the following sections, we evaluate SPRZs of the 2004 off the Kii peninsula earthquakes and the 1899 earthquake using the inversion method.
3.
Analysis of the 2004 Off the Kii Peninsula
Earthquakes
The source model of the 2004 off the Kii peninsula earth-quakes has been analyzed using tsunami waveforms (Baba
et al., 2005; Satakeet al., 2005) and strong ground motions
134° 136° 138° 34°
36°
0.5 1.5 2.5 3.5 4.5 5.0
134° 136° 138° 140°
34° 36°
134° 136° 138° 140°
34° 36°
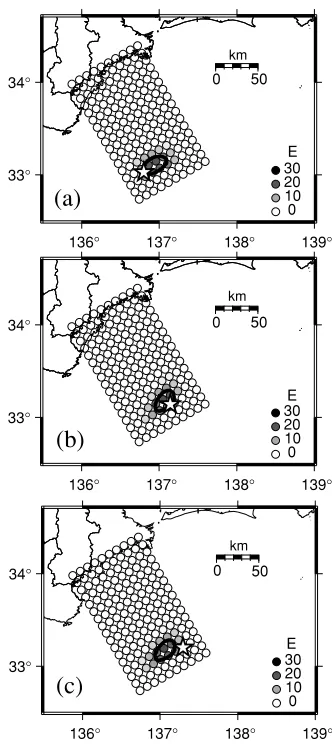
Fig. 3. Contour map of seismic intensity distribution (JMA, 2004): (a) event #1 (b) event #2 and (c) event #3 as shown in Table 1. Stars show epicenters.
of the event #3 is just 1.0 less than that of the event #2. The seismic intensity distribution represents ground mo-tions with short periods of around 1 second. The amplifi-cation of ground motions in the sedimentary basins is not so significant compared to longer-period waves (Hayakawa
et al., 2005)
In order to obtain an outline of results, the fault plane for the inversion analysis is modeled to extend so wide as to identify a SPRZ located from trough axis to in-land as shown in Fig. 4. Baba (2003) suggested that depth of the boundary of the Philippine Sea plate. Since the focal depth of the 2004 off the Kii peninsula earthquakes is around 40 km as shown in Table 1, the depth of fault model is assumed to be 30 km deeper than the plate boundary. The depth of fault model represents the source region of intraslab earth-quakes. The inversion analysis was carried out based on the measured seismic intensity data in Fig. 3 rectified for site correction by relative intensity in Fig. 2.
Figure 5 shows the results of inversion analysis. The area surrounded by solid line shows SPRZ for each event. The SPRZ of the event #1 is located in the west of that of the event #2 and #3. The SPRZ of the event #2 is quite similar to that of the event #3. It can’t be supposed that the aftershock re-ruptured the SPRZ of the main shock.
136° 137° 138° 139°
33°
34° 0 50 100
km
Kii-Peninsula
70 60 50 40 40km
Depth of sub-fault (km) 50km
60km
Fig. 4. Depth of sub-faults for inversion analysis of the 2004 off the Kii peninsula earthquakes.
136° 137° 138° 139°
33°
34° 0 50
km
30 20 10 0 E
136° 137° 138° 139°
33°
34° 0 50
km
30 20 10 0 E
136° 137° 138° 139°
33°
34° 0 50
km
30 20 10 0 E
(a)
(b)
(c)
Fig. 5. SPRZ (Short-Period Radiation Zones) for the 2004 off the Kii peninsula earthquakes: (a) event #1 (b) event #2 and (c) event #3 shown in Table 1. Areas surrounded by curved solid lines show fault zones ra-diating more than ten times of average energy. Stars represent epicenters reported from JMA.
136°00' 136°30' 137°00' 137°30' 33°00'
33°30'
0 20 40
km
40km30km 20km
20km 30km
40km event #1
event #2
40 30 20 10
Depth (km)
Fig. 6. Depth of sub-faults of Model B for event #1 and #2.
0 100 200 300 400 500 600 700 800
-1.5 -1.0 -0.5 0 0.5 1.0 1.5 Estimated intensity -Observed intensity
Frequency
Fig. 7. Frequency distribution of estimation error denoted as a difference between estimated intensity and observed intensity and in case of event #2 of Model B.
136°00' 136°30' 137°00' 137°30'
33°00' 33°30'
136°00' 136°30' 137°00' 137°30'
33°00' 33°30'
(b) (a)
0 50
km event #2a
7.0 6.0 5.0 4.0 M
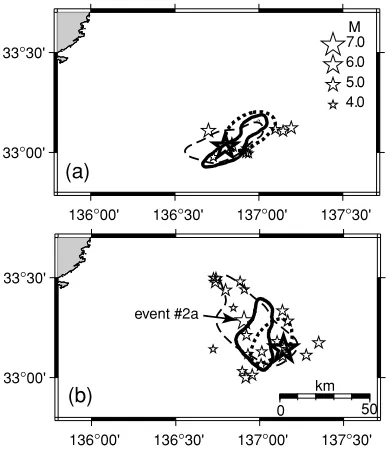
Fig. 8. SPRZs, slip zones and epicenters of aftershocks for (a) event #1 and (b) event #2. An area surrounded by a dotted line shows the SPRZ for Model A. An area surrounded by a solid line shows the SPRZ for Model B. Stars show epicenters of felt-earthquakes (JMA, 2004): (a) from event #1 though just before event #2, and (b) from event #2 though just before event #3. An area surrounded by a broken line shows more than 1.5 m slip of each event obtained from waveform inversion by Yamanaka (2004).
difficulty due to geographical features that an epicenter is located more than 100 km away from the coast. It may cause low resolution of SPRZ.
The modeling of fault geometries as shown in Fig. 4 (hereafter referred to as Model A) is effective in practi-cal use such as an early warning system and disaster
as-0 1 2 3 4 5
10 100 1000
hypocentral distance (km)
int
ens
it
y
I=-4.1log(X)+1.1M+4.7 measured intensity
Fig. 9. Attenuation of seismic intensity of event #2a (see Fig. 8). The solid line shows the attenuation model expressed as Eq. (1).
sessment, while there is little information immediately after the occurrence of an earthquake. However, it is difficult to discuss the analytical result from a seismological aspect in detail. Therefore, seismic intensity inversion analysis for event #1 and #2 is implemented using the fault geometries proposed from the waveform inversion (Yamanaka, 2004). The fault model is hereafter referred to as Model B. The strikes and dips of Model B are 71 and 56 degrees for event #1, 135 and 40 degrees for event #2, respectively. It means that a south-dipping model is used for event #1 and a southeast-dipping model for event #2 as shown in Fig. 6. Figure 7 shows the frequency distribution of estimation er-ror. Standard deviations of estimation errors are 0.46 for event #1 and 0.47 for event #2 in case of Model B. These er-rors are relatively small compared to historical earthquakes such as 0.67 for the 1854 Ansei Tokai earthquake and 0.82 for the 1707 Hoei earthquake (Kandaet al., 2004).
The obtained SPRZs of the event #1 and #2 are compared to large slip area obtained from the waveform inversion (Ya-manaka, 2004) and the epicenter distribution of correspond-ing aftershocks as shown in Fig. 8. The discrepancy of SPRZs between Mode A and Model B depends on not the size of fault plane but the depth of sub-faults. It seems to be not so significant from the view of methodological accu-racy. However, it may be reasonable that SPRZs of Model B resembles slip area rather than SPRZs of Model A for both the events. Especially, SPRZ of event #1 spreads along the trough and is rather consistent with the slip area. In case of event #2, the slip areas are wider than respective SPRZs and the northwest part of slip area of event #2 radiated little short period seismic energy. Figure 9 shows the attenuation of seismic intensity of event #2a (MJ5.9) whose epicenter is shown in Fig. 8(b). The seismic intensities are quite smaller than the proposed attenuation model of Eq. (1). It suggests that the northwest area of slip zone may not radiate short-period energy so much. It may interpret the difference of the northwest part of slip area. The phenomenon is also true to aftershocks located in the southeast of the epicenter of event #2. It may be suggested that the slip area is not always consistent with SPRZ.
4.
Analysis of the 1899 Earthquake
in-132° 134° 136° 138° 140°
34°
36°
1 2 3 4 5- 5+ 6- 6+
Fig. 10. Seismic intensity distribution of the 1899 earthquake.
version analysis is carried out to confirm these facts. Figure 10 shows seismic intensity distribution of the 1899 earthquake. The intensity data were basically derived from record of JMA (Hamamatsu and Usami, 1985). Some of seismic intensities in the Kii Peninsula were estimated from damage records (Usami, 2003) as well. There was a high seismic intensity area in the southeast of the Kii Penin-sula, where it caused fatalities and collapsed houses.
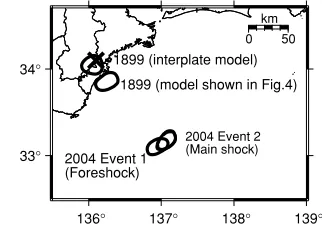
Figure 11 shows the result of inversion analysis for the 1899 earthquake compared to the 2004 earthquakes. Since the focal depth of the 1899 earthquake is not obvious, two inversion analyses were implemented using the intraslab model in the Philippine Sea plate shown in Fig. 4 and the interplate model which was 30 km shallower than it. The SPRZ of the 1899 earthquake for both models is located near the coast of the Kii Peninsula and departs from that of the 2004 earthquake. It shows a distinct difference be-tween both models. The SPRZ for the interplate model corresponds to the epicenter by Utsu (1982). M6 class earthquakes occurred near the epicenter on April 26, 1950 (M6.5, H47 km) and Dec. 26, 1960 (M6.0, H49 km). The 1899 earthquake is supposed to be a larger event of such intermediate-depth earthquakes in the Philippine Sea plate or a relative small interplate event at the west margin of the Tonankai earthquake source region.
5.
Summary
An inversion analysis has been developed to evaluate SPRZs (short-period radiation zones) on an earthquake fault plane using seismic intensity data. It is robust and efficient especially for historical earthquakes without strong mo-tions, tsunami and geodetic data recorded by instruments. It is efficient to discuss the discrepancy of source character-istics among recent earthquakes and historical earthquakes. The fault geometries modeled possible wide area is ef-fective in practical use such as an early warning system and disaster assessment, while there is little information just af-ter the occurrence of an earthquake. As a second step of analysis, it is necessary to model accurate depth of fault plane to discuss the analytical result from a seismological aspect in detail.
The SPRZ of each event of the 2004 off the Kii peninsula earthquakes from the inversion analysis was included in epicenter area of the corresponding aftershocks and slipped fault zone derived from the waveform inversion analysis as
136° 137° 138° 139°
33°
34°
0 50
km
2004 Event 2 (Main shock)
2004 Event 1 (Foreshock)
1899 (model shown in Fig.4) 1899 (interplate model)
Fig. 11. SPRZ of the 1899 earthquake compared to the 2004 earthquakes. X mark shows the epicenter of the 1899 earthquake (Utsu, 1982). The interplate model is 30 km shallower than the model shown in Fig. 4.
well. It may be also indicated that there are some slip areas where little short-period energy radiated.
The SPRZ of the 1899 earthquake was located near the coast of the Kii Peninsula. It was indicated that the 1899 earthquake was different from the 2004 earthquake and might be an intermediate-depth earthquake in the Philippine Sea plate near the coast of the Kii Peninsula or a relative small interplate event at the west margin of the Tonankai earthquake source region.
References
Akaike, H. and G. Kitagawa (Eds.),The Practice of Time Series Analysis: Information Science and Statistics, Springer, 386 pp., 1999.
Baba, T., Slip distributions of the 1944 Tonankai and 1946 Nankai earth-quakes estimated from tsunami inversion using a new plate model, Doc-tor thesis of Kanazawa Univ., Japan, 2003.
Baba, T., P. R. Cummins, and T. Hori, Compound fault rupture during the 2004 off the Kii peninsula earthquake (M7.4) inferred from highly resolved coseismic sea-surface deformation,Earth Planets Space,57, 167–172, 2005.
Hamamatsu, O. and T. Usami,Investigation Tables of Seismic Intensity in Japan [I]-[IV], 866 pp., 1985 (in Japanese).
Hayakawa, T., T. Furumura, and Y. Yamanaka, Simulation of strong ground motions caused by the 2004 off the Kii peninsula earthquakes, Earth Planets Space,57, 191–196, 2005.
Japan Meteorological Agency, Monthly report on Earthquakes and Volca-noes in Japan, September, 2004 (in Japanese).
Kanda, K., M. Takemura, and T. Usami, Inversion analysis of distribution of energy radiated from an earthquake fault based on the seismic inten-sity data,J. Seism. Soc. Jpn.,56, 39–57, 2003 (in Japanese).
Kanda, K., M. Takemura, and T. Usami, Short-period seismic wave radia-tion zones of a megathrust fault along the Nankai Trough deduced from inversion analysis of seismic intensity data,J. Seism. Soc. Jpn.,57, 153– 170, 2004 (in Japanese).
Ohno, S., T. Ohta, T. Ikeura, and M. Takemura, Revision of attenuation formula considering the effect of fault size to evaluate strong motion spectra in near field,Tectonophysics,218, 69–81, 1993.
Satake, K., T. Baba, K. Hirata, S. Iwasaki, T. Koto, S. Koshimura, J. Tak-enaka, and Y. Terada, Tsunami source of the 2004 off the Kii penin-sula earthquakes inferred from offshore tsunami and coastal tide gauges, Earth Planets Space,57, 173–178, 2005.
Suzuki, W., T. Iwata, K. Asano, and N. Yamada,Estimation of the source model for the foreshock of the 2004 off the Kii peninsula earthquakes and strong ground motion simulation of the hypothetical Tonankai earthquake using the empirical Green’s function method,Earth Plan-ets Space,57, this issue, 345–350, 2005.
Usami, T.,Conspectus of Damage Earthquakes in Japan [416]-2001, 650 pp, University of Tokyo Press, 606 pp., 2003 (in Japanese).
Utsu, T., Catalog of large earthquakes in region of Japan from 1885 through 1980,Bull. Earthq. Res. Inst.,57, 401–463, 1982.
Yamanaka, K., EIC Seismological Note, No.152 and 153, http://www. eri.u-tokyo.ac.jp/sanchu/Seismo Note/, 2004 (in Japanese).