Solar-Terrestrial Environment Laboratory, Nagoya University, Honohara 3-13, Toyokawa, Aichi 442-8507, Japan
(Received October 15, 2002; Revised May 20, 2003; Accepted May 20, 2003)
The auroral electrojet is enhanced in the polar ionosphere associated with charged particle precipitation and field-aligned currents during substorms. In this paper the geometry of the elctrojet is determined by using the ionospheric equivalent current systems for every 5 minutes during March 18 and 19, 1978. The latitudinal and local time shifts of the oval are examined. Possible relationship of the electrojet oval with expansion of the auroral oval and the field-aligned current belts during substorms are discussed. The electrojet oval in the polar region consists of westward and eastward electrojets, varying with AE index. As the magnetic activity increases, the westward electrojet has distinct latitudinal shifts in different local time sectors: it shifts poleward around the midnight (23:00–03:00 MLT), while moves equatorward in the morning sector (03:00–10:00 MLT) and afternoon sector (20:00–23:00 MLT. The eastward electrojet includes two insulated parts: a higher-latitude part around 80◦latitude in the nighttime sector (21:00–03:00 MLT) and a lower-latitude part between 60◦–70◦ latitudes in other local time sectors. As AE index increases, the higher-latitude part of the eastward electrojet expands eastward from 03:00 to 08:00 MLT, while the lower-latitude part shows a equatorward shift in the afternoon sector, which is more or less similar to the westward electrojet.
Key words:Auroral electrojet, AE index, substorm.
1.
Introduction
The current system in the polar region, including an in-tense auroral electrojet, is mainly driven by particle pre-cipitation and field-aligned currents, although the dynamo process has minor contribution (Akasofu, 1972; Matsushita and Xu, 1982; Newell, 2001; Lui, 2001). The field-aligned current belt expands both equatorward and poleward during magnetic disturbed condition (Iijima and Potemra, 1976a, b; 1978). Akasofu (1972) studied extensively auroras and pointed out that the auroral oval expands both equatorward and poleward during magnetic substorms. Kamide and Mat-sushita (1979a, b) calculated the ionospheric current system caused by field-aligned currents, and showed how the current pattern in the polar region, especially the electrojet, strongly depends upon the distribution of the field-aligned currents and ionospheric conductivity. Using the method of natural orthogonal components, Sunet al. (1998, 2000) separated the eigen mode representing auroral electrojet, which is lo-cated between 65◦–70◦ latitude around the midnight sector. However, examination of latitudinal profiles of magnetic dis-turbances using meridian chain data shows very complicated behaviors instead of systematic latitudinal shift.
In this paper the ionospheric equivalent current systems in the polar region, constructed at 5-minute interval for March 18–19, 1978, are used to examine latitudinal and local time shift of the electrojet oval for different magnetic activities. Possible relationship of the electrojet shift with the
latitu-Copy right cThe Society of Geomagnetism and Earth, Planetary and Space Sciences (SGEPSS); The Seismological Society of Japan; The Volcanological Society of Japan; The Geodetic Society of Japan; The Japanese Society for Planetary Sciences.
dinal expansion of the field-aligned current belt and auroral oval is discussed.
2.
Data Analysis
The magnetic variations recorded at a meridian chain of magnetometers in the polar region are usually used to study the auroral electrojet. The latitude of the electrojet center is determined by the maximum deviation of H component or the zero Z component (Kamide and Akasofu, 1974, 1983; Akasofuet al., 1983; Feldsteinet al., 1997). It is expected that the electrojet belt would shift in latitude, when sub-storms occur. In some cases, unfortunately, it is hard to ob-tain definite results by a single meridian chain.
An examination is made using the magnetic data from Alaska chain for 38 days in 1998, when substorms occur. In Fig. 1 AU and AL indices are shown for the 38 days. The latitude of the westward electrojet determined by the maximum H component is shown in the upper part. It is hard to recognize a definite relationship between the latitude of the electrojet center and magnetic activity.
It seems to be necessary to use the data at least in the whole polar region to definitely determine the auroral elec-trojet, including its location and intensity. Kamide et al.
(1982a, b) extensively collected the magnetic records from a total of 71 stations in the north polar region during the In-ternational Magnetospheric Study (IMS), and calculated the ionospheric equivalent current functions with time resolution of 5 minutes on the basis of this IMS dataset. This is a very heavy work so that the calculations have been made only for three days, 17, 18 and 19, March 1978. These data sup-ply useful information for studying the dependence of the
Fig. 1. AU and AL indices and the latitude of the westward electrojet center determined by the maximum H component for 38 days, 1998.
Fig. 2. Auroral electrojet indices AE, AL and AU during March 18–19, 1978.
current system configuration on solar wind parameters and magnetic activity, and have been widely used to study auro-ral electrojet indices and other substorm-related phenomena. Since there are no complete solar wind data on 17, March,
the data on 18 and 19, March have been more frequently used (see Sunet al., 1998, 2000).
(a)
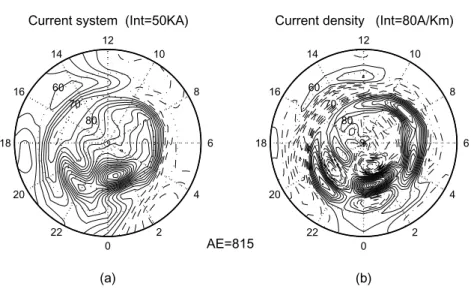
Fig. 3. Ionospheric equivalent current system (a) and east-westward current density (b) for UT 15:20 of March 18, 1978.
during this two-day period is shown in Fig. 2 by 5-minute averaged auroral electrojet indices AE, AL and AU. In the two-day duration there are at least 4 disturbed periods, each of which includes one or more substorms. The maximum 5-minute averaged AE is 1584 nT at 10:05 UT of March 18. As an example, Figure 3(a) shows the ionospheric equiv-alent current system at 15:20 UT on March 18 (AE=815 nT, AL= −542 nT, AU =293 nT. The contour interval is 50 kA. A two-cell current pattern dominates in the polar region with an enhanced westward electrojet in the midnight-morning sector around 70◦latitude.
Figure 3(b) shows the east-westward current density cal-culated from the current function. In this paper the westward (eastward) current is defined as positive (negative) and repre-sented by solid (dashed) contour lines. It is noted in Fig. 3(b) that the westward electrojet distributes mainly along an oval-shaped belt between 60◦ and 80◦ latitudes, and latitudinal variation of the current density is dependent on local time. Similarly, the eastward electrojet distributes mainly in an-other oval-shaped belt, which consists of two insulated parts, one at lower latitudes (60◦–65◦) from early morning to af-ternoon and another at higher latitudes (around 80◦) in the midnight sector.
In order to study the variation of the electrojet with mag-netic activity, all 576 current patterns are divided into 5 groups for AE=0–200, 200–400, 400–600, 600–800 and
>800 nT. The average current systems for each group are shown in the upper row of Fig. 4. It is noted that a two-cell current structure exists for all cases, and both westward and eastward electrojets are enhanced as AE index increases.
The east-westward current densityJ(unit: A/km is calcu-lated from the current functions and shown in the lower row of Fig. 4. It is noted in the figure that in the nighttime-to-morning sector an intensive westward electrojet, JW, flows around 70◦latitude, and an eastward currentJEflows at high latitudes with the central location at 80◦latitude. In the after-noon sector a low-latitude eastward electrojet and diffusive high-latitude westward currents composite the afternoon cur-rent cell.
3.
Auroral Electrojet Oval
The general shape of the electrojet oval can be roughly de-scribed by the maximum electrojet JWmaxor JEmaxfor each
local time, as shown in Fig. 5. It is noted in Fig. 5(a) that as AE index increases, the westward electrojet oval has dis-tinct latitudinal shift for different local time sectors. Namely, the oval steadily shifts poleward around the midnight (23:00– 03:00 MLT), while it moves equatorward in the morning sec-tor (03:00–10:00 MLT) and afternoon section (20:00–23:00 MLT.
The eastward electrojet oval in Fig. 5(b) includes two sep-arated parts, a higher-latitude part around 80◦latitude in the midnight-morning section (21:00–03:00 MLT) and a lower-latitude part between 60◦–70◦ latitudes in other local time sections. The higher-latitude part of the eastward electro-jet oval expands eastward from 03:00 MLT to 08:00 with increasing AE index without obvious latitudinal movement, while the lower-latitude part shows a equatorward shift in the afternoon section, more or less similar to the westward electrojet.
4.
Local Time Dependence of the Electrojets
It is noted in the lower panel of Fig. 4 that JW and JEof the average auroral electrojet ovals vary with local time. The maximum densities JWmaxand JEmaxat each MLT are
shown in Fig. 6 for 5 activity levels. The maximum westward electrojet density (Fig. 6(a)) occurs in the morning (about 00–03 MLT) for disturbed cases (AE >400 nT), while it occurs around 06 MLT for moderate disturbances (AE = 200–400 nT) and around noon for quiet period (AE <200 nT. The maximum eastward electrojet density (Fig. 6(b)) occurs around the midnight for the high-latitude part, and around 15 MLT for the low-latitude part.
In order to judge how well the AE index represents the maximum electrojet density, all 576 samples are examined in detail. The maximum westward electrojetJWmaxand
east-ward electrojetJEmaxare found for each UT instant. Figure 7
co-Fig.
4.
Upper
panel:
A
v
erage
ionospheric
equi
v
alent
current
systems
for
dif
ferent
AE
ranges.
The
contour
interv
al
is
50
kA
.
Lo
wer
panel:
A
v
erage
ionospheric
current
density
for
dif
ferent
AE
ranges.
The
contour
interv
al
is
50
A/
Fig. 5. Westward and eastward electrojet ovals for different AE ranges. Arrows indicate the oval’s movements with increasing AE index.
Fig. 6. The maximum westward electrojetJWmax(a) and eastward electrojetJEmax(b) in the electrojet ovals for different activity levels.
efficient 0.925. Similar correlation is obtained for the east-ward electrojetJEmax,JEmax(A/km)= −164.30−0.49 AE
(nT) with correlation coefficient 0.768.
5.
Discussions and Conclusion
The dataset of current functions by Kamideet al.(1982a, b) is the best data source until now, however, it should be pointed out that the results obtained in this paper are prelim-inary, since only 576 samples of two days have been used, that are not sufficient for detailed statistical study. Fortu-nately, these data include various activity levels from quiet condition, through weak and moderate disturbances to
se-vere substorms, which allow us to group the data according activity.
As analyzed by Kamide et al. (1982a, b), ununiformity and sparseness of stations in some areas, for instance, in the very high latitudinal region and East Siberian sector, cer-tainly result in some bias and restrict the spatial resolution. Fortunately, the stations are much denser in latitude than in longitude, consequently, the spatial resolution in latitude is much better than in longitude, that is favorable to our main concern—the latitudinal shift of the electrojet oval.
elec-Fig. 7. Comparison of the maximum westward and eastward electrojets with AE index.
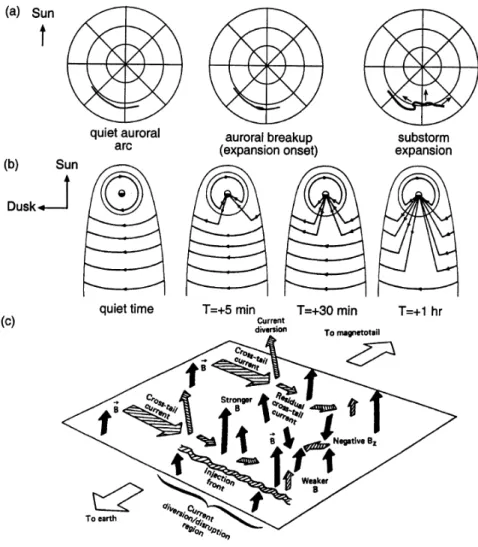
Fig. 8. Disruption of the cross-tail currents and the evolution of the substorm current wedge.
trojet around midnight is considered to be intimately tied to the diversion of the cross-tail current to the ionosphere, which is referred to as substorm current wedge. Figure 8 illustrates schematically the evolution of the substorm cur-rent wedge, accompanied within it by a significant increase of magnetic field normal to the equatorial plane, known as dipolization (Akasofu, 1972; Lui, 2001). It is noted that disruption of the cross-tail current may take place firstly at distances X = −6RE–−10RE. The blocked part of the cross-tail current must find a new circuit, and the obvious one would be the polar ionosphere circuit. In this way, a sub-storm current wedge is formed (Atkinson, 1967; McPherron
et al., 1973). Along with tailward expansion of the blocked part of the cross-tail currents, the ionospheric partner of the current wedge as well as the westward electrojet will move poleward.
As for the equatorward expansion of the electrojet oval in the afternoon and morning sectors, it might be related with an earthward expansion of the partial ring currents.
trojet with AE increase during the stronger substorm. It is impossible, in principle, to separate these two different ef-fects by using magnetic observations made on the Earth’s surface alone (Kamide, 1988). Therefore, the scheme in Fig. 8 only gives a tentative relation between the expansion of the auroral electrojet oval and the development of the mag-netotail current interruption. More comprehensive study by using much more data, such as SuperDARN data, and ad-vanced technique, such as AMIE, is needed (Greenwaldet al., 1995; Richmond, 1992; Luet al., 1994).
The main results obtained in this paper is summarized as follows:
(1) The auroral electrojet oval consists of westward and eastward electrojets, the shapes and locations of which vary with AE index.
(2) The westward electrojet oval has distinct latitudi-nal shift in different local time sectors. Namely, the oval shifts poleward around the midnight (23:00–03:00 MLT), while moves equatorward in the morning sector (03:00– 10:00 MLT) and afternoon sector (20:00–23:00 MLT.
(3) The eastward electrojet oval includes two separated parts: a higher-latitude part around 80◦latitude in the night-time sector (21:00–03:00) and a lower-latitude part between 60◦–70◦ latitudes in other local time sectors. The higher-latitude part of the eastward electrojet expands eastward with increasing AE index, while the lower-latitude part shows an equatorward shift in the afternoon sector, more or less simi-lar to the westward electrojet.
(4) The auroral electrojet is closely related to a diversion of the cross-tail current to the ionosphere, or the substorm current wedge in the magnetosphere.
Acknowledgments. We would like to thank the team of Alaska chain for providing the geomagnetic data. Also we thank WDC-C2 for supplying auroral indexes. This work was supported by the National Key Basic Research Science Foundation of China (Grant No. G2000078406) and the National Natural Science Foundation of China (Grant No. 40236058).
References
Akasofu, S.-I., Magnetospheric substorms: A model, inSolar-Terrestrial Physics, Part 3, edited by E. R. Dyer, 131 pp., D. Reidel, Norwell, Mass., 1972.
Akasofu, S.-I., B. H. Ahn, Y. Kamide, and J. H. Allen, A note on the
Walker, N. Sato, and H. Yamagishi, DARN/SuperDARN,Space Sci. Rev., 71(1-4), 761–791, 1995.
Iijima, T. and T. A. Potemra, The amplitude distribution of field-aligned currents at northern high latitudes observed by Triad,J. Geophys. Res., 81, 2165–2174, 1976a.
Iijima, T. and T. A. Potemra, Field-aligned currents in the dayside cusp observed by Triad,J. Geophys. Res.,81, 5971–5979, 1976b.
Iijima, T. and T. A. Potemra, Large-scale characteristics of field-aligned currents associated with substorms,J. Geophys. Res.,83, 599–615, 1978. Kamide, Y., Electrodynamic processes, inThe Earth’s Ionosphere and Mag-netosphere, Kyoto Sangyo University Press, Kyoto, Japan, pp. 156–189, 1988.
Kamide, Y. and S.-I. Akasofu, Latitudinal cross section of the auroral elec-trojet and its relation to the interplanetary magnetic field polarity,J. Geo-phys. Res.,79, 3755–3771, 1974.
Kamide, Y. and S.-I. Akasofu, Notes on the auroral electrojet indices,Rev. Geophys.,21, 1647–1665, 1983.
Kamide, Y. and S. Matsushita, Simulation studies of ionospheric electric fields and currents in relation to field-aligned currents, 1. Quiet periods,
J. Geophys. Res.,84, 4083–4098, 1979a.
Kamide, Y. and S. Matsushita, Simulation studies of ionospheric electric fields and currents in relation to field-aligned currents, 2. Substorms,J. Geophys. Res.,84, 4099–4115, 1979b.
Kamide, Y.,et al., Global distribution of ionospheric and field-aligned cur-rents during substorm as determined from six IMS meridian chains of magnetometers: initial results,J. Geophys. Res.,87, 8228–8240, 1982a. Kamide, Y.,et al., Changes in the global electric fields and currents for
March 17–19, 1978 from six IMS meridian chains of magnetometers,
Rep. UAG-87, World Data Center A, Boulder, Colo., 1982b.
Lu, G.,et al., Interhemispheric asymmetry of the high-latitude ionospheric convection pattern,J. Geophys. Res.,99, 6491–6510, 1994.
Lui, A. T. Y., Current controversies in magnetospheric physics,Rev. Geo-phys.,39, 535–563, 2001.
Matsushita, S. and W.-Y. Xu, Equivalent ionospheric current systems repre-senting solar daily variations of the polar geomagnetic field,J. Geophys. Res.,87, 8241–8254, 1982.
McPherron, R. L., C. T. Russell, and M. P. Aubry, Satellite studies of mag-netospheric substorm on August 15, 1968, 9. Phenomenological model for substorm,J. Geophys. Res.,78, 3131–3149, 1973.
Newell, P. T., The role of the ionosphere in aurora and space weather,Rev. Geophys.,39, 137–149, 2001.
Richmond, A. D., Assimilative mapping of ionospheric electrodynamics,
Adv. Space Res.,12, 59–68, 1992.
Sun, W., W.-Y. Xu, and S.-I. Akasofu, Mathematical separation of directly driven and unloading components in the ionospheric equivalent currents during substorms,J. Geophys. Res.,103, 11695–11700, 1998.
Sun, W., W.-Y. Xu, and S.-I. Akasofu, An improved method to deduce the unloading component for magnetospheric substorms,J. Geophys. Res., 105, 13131–13140, 2000.