MICROBIAL BIOTRANSFORMATION OF
POORLY WATER-SOLUBLE NITRILE
COMPOUNDS
By Stephen Geoffrey Cull
A thesis submitted to the
University of London
for the degree of
Doctor of Philosophy
Department of Biochemical Engineering
University College London
All rights reserved
INFORMATION TO ALL USERS
The quality of this reproduction is dependent upon the quality of the copy submitted. In the unlikely event that the author did not send a complete manuscript and there are missing pages, these will be noted. Also, if material had to be removed,
a note will indicate the deletion.
uest.
ProQuest 10014327
Published by ProQuest LLC(2016). Copyright of the Dissertation is held by the Author. All rights reserved.
This work is protected against unauthorized copying under Title 17, United States Code. Microform Edition © ProQuest LLC.
ProQuest LLC
789 East Eisenhower Parkway P.O. Box 1346
The biotransformation of poorly water-soluble aromatic dinitriles is o f scientific and industrial interest. Although processes do exist for the transformation of water-soluble compounds, such as acrylonitrile, no description of a process suitable for the large scale biotransformation of poorly water soluble nitriles currently appears in the literature. This work investigates the systematic design and optimisation o f a process for the production o f 3-cyanobenzamide from the poorly water soluble 1,3-dicyanobenzene (1,3-DCB) and defines criteria for successful scale-up of the process to 75 L scale. A two-liquid phase process was initially designed at the laboratory scale (10 mL) which utilised the nitrile hydratase (NHase) activity o f a whole cell Rhodococcus R312 biocatalyst. Toluene was selected as the carrier solvent and the process was optimised for amide production. This allowed the definition o f a suitable operating window where the maximum space-time yield of amide formation could be obtained.
The use o f a room temperature ionic liquid, 1 -butyl-3-methylimidazolium hexafluorophosphate [bmimJfPFô], was also investigated for the first time as a potential replacement for organic solvents in such multiphase bioconversion processes. Transformations carried out in aqueous-ionic liquid systems showed similar kinetic profiles for amide and acid production and enhanced stability o f the whole cell biocatalysts.
CONTENTS
Title Page 1
Acknowledgements 2
Abstract 3
Contents 4
Index of Figures 12
Index of Tables 16
Nomenclature 17
1
INTRODUCTION
191.1 The industrial importance of nitriles 19
1.2 Nitrile conversions 19
1.2.1 The importance o f nitrile hydratase 19
1.2.2 The nitrile metabolism pathway 20
1.2.3 The characteristics of nitrile hydratase (NHase) 21
1.2.4 Regioselective two-step hydrolysis 23
1.2.5 Amidase selectivity 27
1.2.6 Nitrilase selectivity 27
1.3 Rhodococcus R312 27
1.4 Two-phase biotransformations 29
1.4.1 Catalyst form 29
1.4.1 Immobilisation of the biocatalyst 31
1.5 Selection of an organic solvent phase 32
1.5.1 Solvent characteristics 32
1.5.2 Solvent biocompatibility 33
1.5.3 Solvent selection strategy 34
1.5.4 Phase ratio 34
1.6 Bioreactor design and optimisation 36
1.6.1 Reaction location 37
1.6.3 Mass transfer 38
1.6.4 Windows o f operation 40
1.7 Scale-up of two-liquid-phase bioreactors 40
1.7.1 Mixing 41
1.7.2 Scale-up 42
1.8 Drop size measurements in agitated two-phase 45
systems
1.9 Aims and objectives of the project 46
2
MATERIALS AND METHODS
48
2.1 Chemicals and microorganism 48
2.1.1 Main chemicals 48
2.1.2 Synthesis and purification o f [bmim] [PFô] 48 2.1.2.1 1-Butyl-3-methylimidazolium chloride, 48
[bmim] Cl
2.1.2.2 l-Butyl-3-methylimidazolium 48
hexafluorophosphate, [bmim][PF^]
2.1.3 Organism source 49
2.1.4 Culture storage (short term) 49
2.1.5 Culture storage (long term) 50
2.1.5.1 Agar slopes ^0
2.1.5.2 Glycerol stocks 50
2.2 Media composition and conditions for growth 50
2.2.1 Rich growth medium (ROM) 50
2.2.2 Tryptic soy broth (TSB) medium 51
2.3 Fermentation conditions and biomass harvesting 51
2.3.1 Shake flask fermentations 51
2.3.2 Stirred tank fermentations 51
2.3.2.1 7 L Fermentation 52
2.3.2.2 20 L Fermentation 52
2.3.2.3 450 L Fermentation 53
2.4 Cell preparation 53
2.4.2 Large scale 54
2.5 NHase and amidase activity assays 54
2.6 Biotransformation of l^-D C B by 55
R312
2.6.1 Shake flask biotransformations 55
2.6.1.1 Single-phase biotransformations 55
2.6.1.1.1 Amidase inhibition study 55 2.6.1.1.2 Stability of Rhodococcus 55
R312 NHase activity with variable pH and
temperature
2.6.1.2 Two-phase biotransformations 56
2.6.1.2.1 Solvent selection and 56
partition coefficients
2.6.1.2.2 NHase and amidase activity 57 o f Rhodococcus R 312 in a
aqueous-toluene system
2.6.1.2.3 Biotransformation with 57
variable biomass concentrations
2.6.1.2.4 Biotransformations with 58 variable phase volume
ratios
2.6.1.2.5 Biotransformation activity 58 with variable initial
substrate concentrations
2.6.1.2.6 25 mL shake flask two- 58
2.6.1.2.7 Comparative two-phase 59 biotransformations o f
1,3-DCB using aqueous- toluene and aqueous- [bmim][PF^] systems
2.6.1.2.8 PiCXWity o f Rhodococcus 59 R312 cells after exposure to
a second phase
2.6.2 Stirred tank biotransformations 60
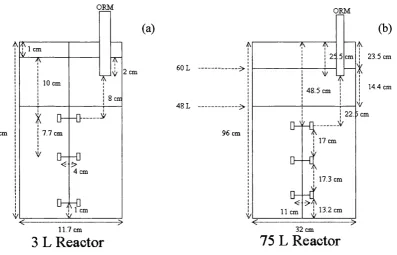
2.6.2.1 Stirred tank geometry and operation 60 2.6.2.2 Two-phase biotransformations o f 1,3- 61
DCB (3 L scale)
2.6.2.3 Two-phase biotransformations of 1,3- 61 DCB using an aqueous-toluene system (75
L scale)
2.6.2.4 On-line measurement of droplet size 62 distributions
2.6.2.5 Droplet size measurement 63
2.6.2.6 Power consumption and phase continuity 63
2.7 Analytical techniques and physical measurements 64
2.7.1 Off-line fermentation growth measurements: optical 64 density, wet weight and dry cell weight
2.7.2 Density 65
2.7.3 Viscosity 65
2.7.4 Surface tension and interfacial tension 66
2.7.5 Quantitative HPLC assay 67
3
BIOCATALYST SELECTION AND
69
PRODUCTION
3.1 Introduction 69
3.1.1 Objectives 69
3.2 Materials and methods 70
3.2.2 Experimental methods 70
3.3 Results and discussion 71
3.3.1 Biocatalyst selection and form 71
3.3.2 Shake flask fermentations 73
3.3.2.1 Growth o f Rhodococcus R312 on ROM 73 3.3.2.2 Growth o f Rhodococcus R312 on TSB 73 3.3.3 Scale-up of stirred tank reactor (STR) fermentations 74 3.3.3.1 7 L Stirred tank reactor fermentation 74 3.3.3.2 20 L and 450 L Stirred tank reactor 75
fermentations
3.3.4 Biocatalyst recovery and separation 79
3.4 Conclusions 79
4
PROCESS SELECTION AND
81OPTIMISATION FOR AROMATIC
NITRILE HYDRATION
4.1 Introduction 81
4.1.1. The importance o f nitrile hydration 81
4.1.2 Objectives 82
4.2 Materials and methods 83
4.2.1 Chemicals and microorganism 83
4.2.2 Experimental methods 84
4.3 Results and discussion 84
4.3.1 Single-phase biotransformation of 1,3-DCB 84
4.3.2 Two-phase biotransformation of 1,3-DCB 85
4.3.2.1 Solvent selection 87
4.3.3.2 Operating parameters for the two-phase 88 process
4.3.3 Biotransformation process design and operating 94 conditions
5
USE OF ROOM TEMPERATURE IONIC
99
LIQUIDS AS ORGANIC SOLVENT
REPLACEMENTS
5.1 Introduction 99
5.1.1 Can ionic liquids replace organic solvents in two-phase 99 bioprocesses?
5.1.2 Obj ectives 101
5.2 Materials and methods 101
5.2.1 Chemicals and microorganism 101
5.2.2 Experimental methods 101
5.3 Results and discussion 103
5.3.1 Ionic liquid selection and physical properties 103
5.3.2 Two-phase biotransformation o f 1,3-DCB 104
5.4 Conclusions 108
6
TWO PHASE REACTOR
109
HYDRODYNAMICS AND SCALE-UP
6.1 Introduction 109
6.1.1 The hydrodynamics o f two-phase bioreactors 109
6.1.2 Current scale-up methodologies 112
6.1.3 Objectives 112
6.2 Materials and methods 113
6.2.1 Chemicals and microorganism 113
6.2.2 Experimental methods 113
6.3 Results and discussion 114
6.3.1 Phase physical properties 114
6.3.2 Power curves for agitated liquid-liquid systems (3 L 115 scale)
6.3.3 Effect o f agitation rate and phase composition on drop 119 size distribution (3 L scale)
6.3.4 Criteria for reactor scale-up to 75 L scale 122
6.4 Conclusions 128
7
SCALE-UP OF TWO-PHASE AROMATIC
129
NITRILE HYDRATION
7.1 Introduction 129
7.1.1 Objectives 129
7.2 Materials and methods 130
7.2.1 Chemical and microorganism ^ 130
7.2.2 Experimental methods 130
7.3 Results and discussion 130
7.3.1 Selection o f agitation rates for scale-up studies 130
7.3.2 Biomass production and processing 133
7.3.3 3 L scale biotransformation experiments 133
7.3.4 75 L scale biotransformation experiments 133
7.4 Conclusions 137
8
GENERAL DISCUSSION AND
138
CONCLUSIONS
8.1 General discussion 138
8.1.1 Biocatalyst production 138
8.1.2 Bioconversion process design and optimisation 139
8.1.3 Use of ionic liquids 141
8.1.4 Two-phase bioreactor hydrodynamics 142
8.1.5 Two-phase bioconversion scale-up 143
8.2 Conclusions 144
8.3 Future work 145
REFERENCES
147
APPENDICES
164A 1.1 Operating procedure for toluene/aqueous 164 mixing studies in the 75 L reactor
A 1.2 Operating procedure for toluene/aqueous 165 biotransformation and mixing studies in
the 75 L reactor
INDEX OF FIGURES
1.1 Two pathways for nitrile metabolism 20
1.2 The proposed mechanism o f NHase (Asano et al, 1982) 21 1.3 The three-dimensional structure o f NHase from 22
Rhodococcus R312 at a resolution o f 2.65 À
1.4 Hydrolysis o f dinitriles by SP361 (Cohen et at. (1990) 25
2.1 Scale diagrams of the 3 L and 75 L vessels 60
2.2 (a) 1,3-DCB and (b) 3-cyanobenzoic acid calibration 68 curves as measured by HPLC
3.1 Shake flask fermentation profile for growth o f 72 Rhodococcus R312 on ROM
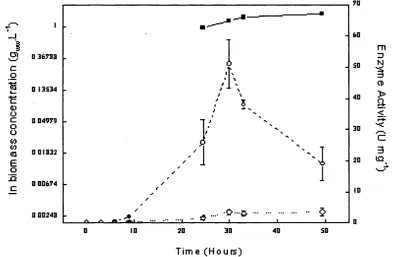
3.2 Off-line measurements for 7 L fermentation profile for 76 growth of Rhodococcus R312 on TSB
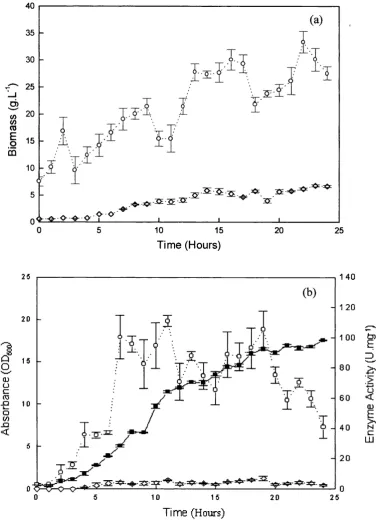
3.3 On-line fermentation data for a 7 L TSB fermentation 77
3.4 On-line fermentation data for a 450 L TSB 78
fermentation
4.1 Mass transfer and reaction steps in the two-phase 82 biotransformation of 1,3-DCB using the two-step nitrile
degradation pathway o f Rhodococcus R312
4.2 Single-phase R312 biotransformation 86
kinetics
4.3 Single-phase NHase and amidase activities as a 86
function of temperature
4.4 Single-phase NHase and amidase activities as a 87
function of pH
4.5 Two-phase Rhodococcus R312 biotransformation for a 90 mass transfer limited system
4.6 Initial rates of amide and acid production as a function 92 of biocatalyst concentration in an aqueous-toluene
4.7 Initial rates o f amide and acid production as a function 92 of phase volume ratio
4.8 Initial rates o f amide and acid production as a function 93 o f initial substrate concentration in the toluene phase
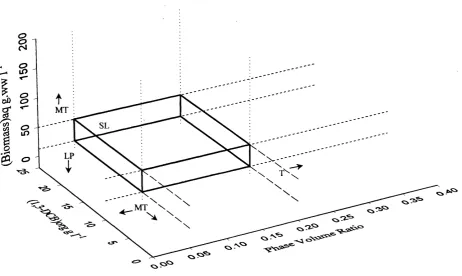
4.9 Operating window for the Rhodococcus R312 catalysed 95 transformation of 1,3-DCB in an aqueous-toluene
two-phase system at pH7 and 30°C
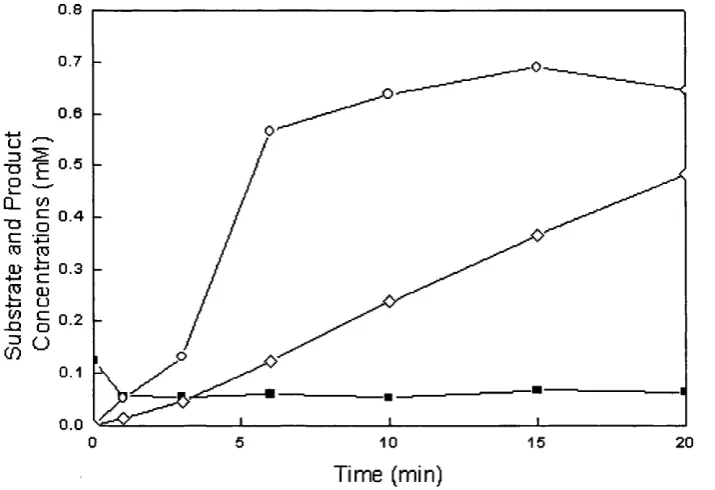
4.10 Two-phase Rhodococcus R312 biotransformation 96 kinetics for final optimised conditions
5.1 Chemical structure o f [bmim] [PFg] and examples o f 102 cations and anions commonly used in the creation of
ionic liquids (from Roberts and Lye, 2001)
5.2 Rhodococcus R312 catalysed transformation of 1,3- 106
DCB in an aqueous-toluene two-phase system
5.3 Rhodococcus R312 catalysed transformation o f 1,3- 106 DCB in an aqueous-[bmim] [PFô] two-phase system
5.4 Retention o f Rhodococcus R312 nitrile hydratase 107 activity in aqueous-toluene and aqueous-[bmim] [PFe]
two-phase systems
6.1 Power curves for a variety o f agitated two-liquids phase 116 systems
6.2 Droplet size frequency distribution by volume as a 117 fimction of agitation rate for a 20 % v/v
aqueous-toluene system in the 3 L reactor in the absence o f substrate and biomass
6.3 Droplet size frequency distribution by volume for a 20 117 % v/v aqueous-toluene system agitated at 600 rpm in
the 3 L reactor
6.4 Droplet size frequency distribution by volume for a 20 118 % v/v aqueous-toluene system agitated at 700 rpm in
the 3 L reactor
the 3 L reactor
6.6 Sauter mean diameter (d3 2) against agitation rate in 122 20% v/v toluene-aqueous systems in the 3 L reactor
6.7 Sauter mean diameter (d3 2) for a 20 % v/v toluene- 124 aqueous system in the 3 L scale-down reactor and the
75 L pilot scale reactor for scale-up under constant P/V and constant tip speed criteria
6.8 Droplet size frequency distribution by volume for a 20 125 % v/v toluene-aqueous system in the absence of
substrate or biomass: 600 rpm
6.9 Droplet size frequency distribution by volume for a 20 125 % v/v toluene-aqueous system in the absence of
substrate or biomass: 700 rpm
6.10 Droplet size frequency distribution by volume for a 20 126 % v/v toluene-aqueous system in the absence of
substrate or biomass: 800 rpm
6.11 Droplet size frequency distribution by volume for a 20 126 % v/v toluene-aqueous system in the absence of
substrate or biomass: 900 rpm
6.12 Sauter mean diameter (d3 2) against agitation rate in 127 20% v/v toluene-aqueous systems in the 75 L reactor
7.1 Kinetics of 3-cyanobenzamide production over a range 132 o f agitatiop rates in the 3 L bioreactor
7.2 Two-phase Rhodococcus R312 biotransformation 132 kinetics at an agitation rate of 600 rpm in a 3 L
bioreactor
7.3 Two-phase Rhodococcus R312 biotransformation 135 kinetics at an agitation rate o f 700 rpm in a 3 L
bioreactor
7.4 Two-phase R312 biotransformation 135
kinetics at an agitation rate of 218 rpm in a 75 L bioreactor
kinetics at an agitation rate o f 305 rpm in a 75 L bioreactor
7.6 Two-phase Rhodococcus R312 biotransformation 136 kinetics at an agitation rate o f 357 rpm in a 75 L
bioreactor
8.1 Operating window for operation at [1,3-DCB]org = 25 141 g.L'^ showing further constraints imposed by
INDEX OF TABLES
1.1 Characteristics of nitrile hydratase purified from a 24 selection of nitrile metabolising microorganisms
1.2 Desired characteristics of solvents for use in two-phase 32 biotransformations. From Bruce and Daugulis (1991)
2.1 Buffer comparison and pH range used in 56
biotransformation experiments
3.1 STR fermentation tip speed scale-up data 74
3.2 Fermentation process comparison data 80
4.1 Log P values and 1,3-DCB saturation concentrations o f 88 the solvents screened for use in a two-phase
biotransformation process.
4.2 Process constraints table for the hydration o f 1,3-DCB 89 by the whole cell NHase of Rhodococcus R 312
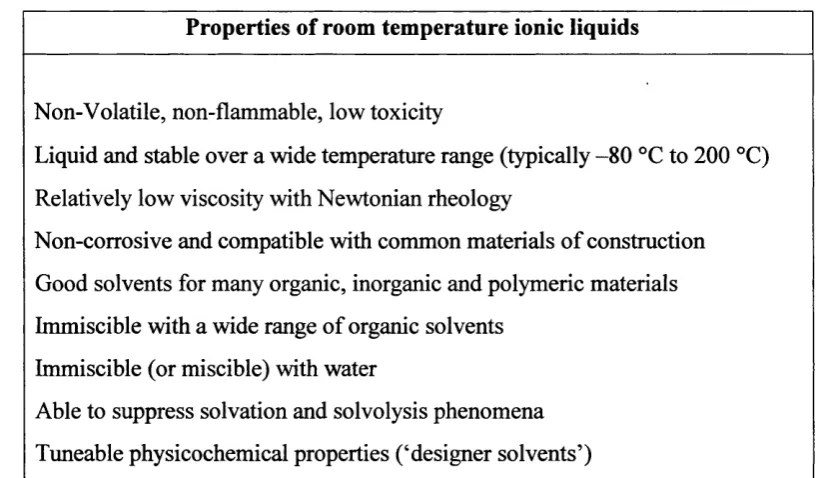
5.1 Physicochemical properties of ionic liquids (from 100 Roberts and Lye, 2001)
5.2 Physical and equilibrium properties of toluene and 104 [bmim][Pp6] systems
6.1 Literature correlations for the prediction o f Sauter mean 111 drop diameter in agitated liquid-liquid systems
(compiled from Zhou and Kresta (1998))
6.2 Experimentally determined phase physical properties 114 6.3 Reactor agitation rates at 3 L and 75 L scales for scale- 123
[bmim][PF6] 1 -butyl-3-methylimidazolium hexafluorophosphate
1,3-DCB 1,3-dicyanobenzene
1,3-DCB 1,3-dicyanobenzene
3-CA 3-cyanobenzoic acid
3-CB 3 -cyanobenzamide
A interfacial area
C concentration (g.L'^)
C],C2y~’ constant (dimensionless)
d32 sauter mean drop diameter (pm)
D, impeller diameter (m)
dvaax maximum drop diameter (pm)
E enzyme concentration in aqueous phase (g.L'^)
H tank height (m)
H liquid height (m)
K substrate partition coefficient (K = Caq/ Corg, or Caq/ Cü) kl enzyme activity reaction rate constant (mmol.g'\min'^) kuj enzyme michaelis-menton constant (mmol.L"^)
ks substrate mass transfer coefficient ^mg.L'^)
rris equilibrium partition coefficient (S w/S*w) (dimensionless)
N rotational speed of the impeller (s'^)
P power (W)
Po power number: Po = PIpb^D^ (dimensionless)
P/V power input per unit volume (kW.m'^)
Re reynolds number: Re = pND^/fj, (dimensionless)
S substrate concentration (mmol.L'^)
SRR substrate reaction rate (mmol. L'\min"^)
STR substrate transfer rate (mmol. L'\min'^)
STR stirred tank reactor
T tank diameter (m)
V volume (m^)
Vi viscosity group: Vi = jUdH(pdO'd) (dimensionless)
Vr volume ratio, Vr = Vorg/Vaq
We,T weber number: We,r = AVcr (dimensionless)
Greek symbols
y shear rate (s'^)
<!> volume flaction of dispersed phase: ^ = YJVtotai (dimensionless)
p density (kg.m'^)
(T interfacial tension (kg.s'^)
P dynamic viscosity (Pa.s)
aq aqueous
bio biomass
c continuous phase
d dispersed phase
dew dry cell weight
ex experimental
il ionic liquid
lit literature
m mixture
0 solvent
org organic
sat saturation
toi toluene
w water
1. INTRODUCTION
1.1 THE INDUSTRIAL IMPORTANCE OF NITRILES
The biotransformation o f nitriles is o f interest because a number o f economically important organic compounds are currently produced from nitrile starting materials (Jallageas et al., 1980). A biological method o f production offers a greener, more selective process and in one case, that of acrylamide production, the yield and purity is better than the original chemical method (Yamada and Kobayashi, 1996). Nitrile hydratase (NHase) is the enzyme of greatest interest for the hydrolysis of nitriles to amides. Consequently over the past decade several processes have been developed for the production o f commodity chemicals including acrylamide and nicotinamide and for the treatment o f waste (Yamada and Kobayashi, 1996; Kobayashi and Shimizu, 1998). The most significant to date is the Nitto process which utilises NHase for the production of acrylamide, one of the most important commodity chemicals (Yamada and Kobayashi, 1996). NHase catalysed production of acrylamide currently yields 30,000 tonnes of product per annum. The application o f NHase for the production of acrylamide removed the use of a toxic copper catalyst in the Nitto process and simplified the process due to a reduction in the number o f reaction steps and waste material. Due to the success o f the Nitto process NHase is of intense scientific interest both for its application in process biotransformations and its novel biochemistry (Kobayashi and Shimizu, 2000; Endo et a l, 2001). Currently the process options for the biotransformation o f poorly water soluble nitriles have not been thoroughly investigated.
1.2 NITRILE CONVERSIONS
1.2.1 The importance of nitrile hydratase
potentially perform nitrile hydrolysis reactions more precisely and more efficiently than chemical catalysts and are considered to be a ‘green’ technology.
1.2.2 The nitrile metabolism pathway
The ability to metabolise substrates with nitrile side-groups is possessed by plants and microorganisms. The nitrile metabolism pathway consists of two enzymes. The enzymes are nitrile hydratase (NHase) which hydrolyses the nitrile to its corresponding amide and an amidase which hydrolyses the amide to a carboxylic acid and ammonia. A second similar pathway catalysed by the enzyme nitrilase is also found in microorganisms but transforms the nitrile substrate into a carboxylic acid in one step. The two-step NHase pathway and nitrilase pathways are shown in Figure 1.1.
H2O
H2O
R-CN ---
^R-CNOH^
> R-COOH + NH^
NHase
Amidase
+ 2 H 2 O
R-CN ---
> R-COOH + NH3
Nitrilase
Figure 1.1 Two pathways for nitrile metabolism: the two-step nitrile hydratase pathway initially produces an amide intermediate which is then further metabolised to acid and ammonia. The nitrilase enzyme achieves this in a specific reaction step.
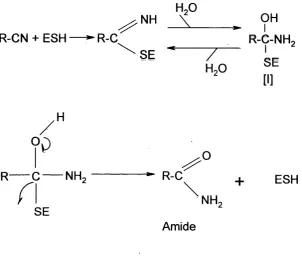
Figure 1.2 shows the mechanism proposed by Asano et al, 1982. Nucleophilic attack by a reactive sulfhydryl group of the enzyme forms an enzyme-bound imine, which is hydrated to form a tetrahedral amide intermediate [I]. An acyl-enzyme is formed from the intermediate [I], with the enzyme as a leaving group.
H2O
^ N H ^ OH
R-CN + ESH ^ R-C R-G-NH,
^ S E T - ■ •
H2 0
[I]
90
I
^
R 0 NHo ^ R-C
n
SE ■2Amide O
+ ESH
NH,
Figure 1.2 The proposed reaction mechanism of NHase (Asano et a l, 1982).
1.2.3 The characteristics of nitrile hydratase (NHase)
Nitrile hydratases are metalloenzymes that catalyse the hydratation of nitriles to their corresponding amides. Some NHase have been shown to be photosensitive and the enzyme activity is lost if incubated in the dark. However, activity is rapidly restored when irradiated with light (Nagamune et a l, 1990). NHases are formed from equal numbers of a and p sub-units which differ in structure and molecular weight. They incorporate non-heme iron or non-corrinoid cobalt (Payne et a l,
characterised by non-corrin low-spin Co (Payne et a i, 1997). The three-
dimensional structure of NHase was first determined for Rhodococcus R312 and is
shown in Figure 1.3. It consists o f a and (3 sub-units which each incorporate a non
heme iron ion.
Figure 1.3 The three-dimensional structure o f NHase from Rhodococcus R312 at a resolution o f 2.65 Â. Four copies of the a (3 dimer are shown. The dimer enzyme consists o f an a (cyan) and (3 (orange) with an iron centre (red) which also corresponds to the location of the active site (Huang et al., 1997).
The first extensive study o f the enzymes o f the 2-step pathway was undertaken on
Brcvibactcrium R312. This has recently been reclassified as Rhodococcus R312
(Briand ct al., 1994) and is one o f the most well-characterised o f the nitrile
hydratase microorganisms discovered so far (Briand ct al., 1994). However, due to
the strong interest in NHase enzymes the properties and structure o f the enzyme
has been studied in many other microorganisms and a search o f the literature
produced over a dozen nitrile hydratase containing microorganisms examples of
1.2.4 Regioselective two-step hydrolysis
An often cited advantage for using biotransformations to perform reactions is the ability of the biocatalyst to significantly increase the yield of product or manipulate a specific area of a substrate due the selective properties of the enzyme, Enzyme selectivity is usually due to; the chemoselectivity, stereoselectivity or regioselectivity of the enzyme. Initially it was thought that nitrilases hydrolysed only aromatic nitriles and nitrile hydratase only hydrolysed aliphatic nitriles. However, it has since been shown that both enzymes catalyse all nitrile forms (Kerridge, 1995).
Regiospecificity towards aromatic dinitriles was first demonstrated by Cohen et al. (1990) using a commercially available immobilised enzyme system SP361 (prepared from Rhodococcus CH5) from Novo Industries which contained a nitrile hydratase and amidase. Studies on SP361 showed a distinct trend indicated that meta- and para- substituted dinitriles were hydrolysed to cyanobenzoic acids while ortho- substituted dinitriles were hydrolysed to diacids (see Figure 1.4). As can be seen in Figure 1.4 hydrolysis of 1,3-dicyanobenzene and 1,4rdicyanobenzene leads to çyano-açid whereas the hydrolysis of 1,2-dicyanobenzene leads to the diacid, Regioselectivity was extremely prevalent in the hydrolysis of symmetrical dinitriles, however, regioselectivity of unsymmetrical dinitriles was poor. Thus, it seems that for regioselective monohydrolysis the symmetry of the molecule and the position of the disubstituted nitrile group is of importance.
Substrates Aliphatic & aromatic Aliphatic Aliphatic & aromatic Aliphatic
Enzyme Constituitive Induced Induced Induced
Mollec. Mlass (kDa) 90 100 500-530 80
No of Sub-units 2: a and 2 p 4 10 a and 10 p
-Sub-unit Mass (kDa) or26, p=27 25 a=26„p=29' 0^25, P=28
Metal Ions 4 F e 4 F e 11 Co Fe
O p t Temp. (°C) 25 20 35 25
Heat Stability (°C) 20 20 50 20-50
Opt. PH 7.8 7.5 6.6 7.5
pH Stability 6,5-8.5! 6.0-7.5 6.0-8.5 6.5-8.0
Activated! by Light - - -
-Reference 1,2 1,2 1,2,3 7
Organism Rhodococcus sp. N-774 Rhodococcus sp. N-771 Klebsiella pneumoniae Bacillus pallidus Dac521
Substrates Aliphatic & Aromatic Aliphatic & Aromatic
Enzyme - - Constitutive Constitutive
Molfec. Mlass (kDa) 70 60 -
-No of Sub-units 2: 2 -
-Sub-unit Mass (kDa) ap28.5i, p=29 0=27.5, p=28 -
-Metal Ions Fe 2 F e -
-Opt. Temp. (°C) <30 - 30 50
Heat Stability (°C) - - - 30-65
Opt. PH 7:7 - 8 7.5
pH Stability - - -
-Activated by Light + + -
-Reference 1,3 3,4 5 6
Table 1.1 Characteristics of nitrile hydratases purified from a selection of nitrile metabolising microorganisms. References: 1. Finnegan et al.
(1992); 2. Yamada et a l (1996); 3. Warhurst andlFewson. (1994); 4. Nagamune et a l (1991); 5. Nawaz et a l (1992), 6. Cramp et a l (1997); 7: Li e ta l (1992).
Substrate Product
mete-substituent
CN
CN
prt^o-substituent
CN
CN
para-substituent
CO2H
CO2H
C O2H
CN
COjH
Figure 1.4 Hydrolysis of dinitriles by SP361 (Cohen et al. (1990).
amides to be isolated in higher yields. A yield of 11% cyano-amide was obtained after 49 hours hydrolysis of 1,3-dicyanobenzene compared to a yield of 40% fluoro-cyano-amide after 21 hours hydrolysis of fluoro-1,3-dicyanobenzene. The addition of an amino group was also investigated. Selective hydrolysis o f the nitrile group ortho to the amine was found to take place indicating that both steric and electronic factors influence regioselectivity (Crosby et ah, 1994),
Investigation of regioselectivity in Rhodococcus equi A4 (Martinkova et a l, 1995) reconfirmed the regiospecificity of NHase for mono nitrile hydrolysis. However, unlike the SP361 system the NHase is regioselective for the ortAo-substituted dinitrile. The R. equi cells were significantly faster catalysts achieving 65% conversion to cyanoamides of 1,3-dicyanobenzene after 1 hour compared to 11% yield conversion after 49 hours with the SP361 system (Crosby et al, 1994). This is due to R. equi possessing a NHase activity 10-20 times higher than its amidase.
In the R. equi system product yield decreased with increasing proximity of the two side groups. Thus after 1 hour product yield with 1,4-dicyanobenzene was 81%, 1,3rdicyanobenzene product yield was 65% and after 5 hours l,2=dicyanobenzene product yield was 48%, This trend is approximately consistent with the findings of Crosby et a l, (1994) and Cohen et ah, (1990).
Indications that hydrolysis of dinitriles is not always regioselective have emerged from recent studies on Rhodococcus AJ270 (Blakey et a l, 1995; Meth-Cohn et a l,
More recent analysis of Rhodococcus AJ270 indicates that for effective hydrolysis, a molecular diameter of the substrate of no more than 7 Â appears to be a limit to rapid conversion (Meth-Cohn et al, 1997a). Thus slower rates of conversion are observed with molecules that exceed this diameter. However, Meth-Cohn et al. (1997b) also observed that regioselective hydrolysis of aliphatic dinitriles is dependent upon the position o f the heteroatom and not overall chain length which appears to contradict their earlier work.
1.2.5 Amidase selectivity
Regioselectivity in two-step nitrile hydrolysis occurs at the nitrile hydratase level as described in section 1.2.4. Regioselectivity by an amidase has so far not been observed. However, Mayaux et al, (1991) discovered an enantiomer-selective amidase.
1.2.6 Nitrilase selectivity
Regioselective and enantioselective selectivity have been observed in nitrilases. Both types of selectivity were found to occur in Rhodococcus rhodochrous NCIMB 11216. The nitrilase regioselectively converted 1,3-dicyanobenzene to 3- cyanobenzoic acid (Bengis-Garber and Gutman, 1989) as well as the asymmetric hydrolysis of enantiomers (Gradley and Knowles, 1994a; Gradley et al., 1994b).
1.3
Rhodococcus
R312
Recently reclassified as a Rhodococcus instead of a Brevibacterium (Briand et al, 1994), R312 has been well characterised (Briand et al, 1994; Kerridge, 1995). Rhodococcus R312 is an excellent microorganism for an investigation into regioselective aromatic amide production and was recently recommended by the Commission on Biotechnology (Faber, 1997b). Rhodococcus R312 possesses a constitutive (Bui et a l, 1984b) wide substrate spectrum (Bui et al, 1984a) NHase, a wide-spectrum amidase and an enantiomer-selective amidase (Mayaux et a l,
organism does not have a nitrilase (Kerridge, 1995) which is a further advantage for an investigation into amide production. A summary of the general features of Rhodococcus KI>\2 is shown below;
• General features. It is aerobic, non-motile, gram positive (tends to gram negative with ageing) soil microorganism. Colonies tend to be ‘salmon pink’. The degree of this pinkness appears to be linked to the concentration of NHase in the microorganism. It has a thiamine vitamin requirement and is considered a Hazard Group 1 microorganism.
• Enzyme synthesis and regulation. The ferrous NHase is constitutive and non inducible. Therefore while no inducement is required, ferric ions are required for NHase synthesis. NHase has been shovm to be inhibited by an excess of nitrile substrate and is known to be competitively inhibited by amide products (Bui et al., 1984b; Maestracci et al., 1988). The amidase is substrate induced by amide (Touneix et a l, 1986) and has been shown to be inhibited by aromatic amide susbtrates (Foumaud et al., 1998). A model developed by Toumiex et al, (1986) suggests that NHase and amidase biosynthesis is controlled by a single repressor gene and that amide represses NHase biosynthesis and induces amidase biosynthesis, For prppionitrile hydrolysis both e n ^ e s were found to have a pH optimum o f 7 but NHase maintains a significant activity between pH 3-11 whereas the amidase has a more narrow profile of pH 5-8. However, NHase has a temperature optimum of 30 °C whereas the amidase had a temperature optimum o f 50°C which rapidly declined above 60 °C.
1.4 TWO-PHASE BIOTRANSFORMATIONS
The utilisation of a biological catalyst to selectively transform a substrate molecule to a product is established in the literature from early fermentation processes such as the modem manufacture of antibiotics and other fine chemicals. However, many potently substrate/product molecules are poorly water soluble or ^ e toxic to the biocatalyst. Thus a process for the conversion of these substrates is inefficient and problematic (Lilly and Woodley, 1985). A potential solution to overcome poor aqueous solubility and/or toxicity is to dissolve the substrate in an organic solvent as a second phase in the reactor. This enables a constant supply o f substrate to be made available to the biocatalyst and also enables a degree of control over the delivery of toxic substrate into the vicinity o f the biocatalyst.
The use of an organic solvent as a substrate and product reservoir for two-liquid phase biotransformation was first reported in the 1930s (Hailing and Kvittingen, 1999). However, the potential of this technology was not fully realised at the time. In the early 1970s the technology was ‘rediscovered’, being initially used in the biotransformation of poorly water soluble steroids (Cremonesi et a l, 1975), and it was rapidly adapted for use with other poorly water soluble molecules (Buckland et a l, 1975; Klibanov et ah, 1975).
The use of organic solvents in bioreactors has been reviewed extensively e.g. Cabral et a l, 1997; Eggers et a l, 1989; Fernandes et a l, 1995; Woodley et a l, 1991; Lye and Woodley, 2001. There are several major advantages to their application in a two-liquid phase system:
• Increased solubility o f substrate and product. If a substrate/product is poorly water soluble dissolving it in solvent can make a process economically viable. Due to an increase in the availability of the substrate for the biocatalyst or extraction of the product i.e. use of organic solvent enabled dehydrogenation of the water-insoluble 6-a-methyl-hydro-cortisone-21-acetate by Arthrobacter simplex cells (Fernandes et a l, 1995).
• Reduce product inhibition. Inhibition of a biocatalyst can be reduced by the extraction o f the product from the aqueous phase.
• Shift reaction equilibria. Transfer of products to the organic phase can shift the apparent reaction equilibria.
• Product recovery. As the solvent may contain a higher product concentration and different physical properties compared to water this can facilitate improved product recovery by separation of the two phases and distillation of the product containing phase.
A measure o f a solute affinity for a particular solvent is the distribution coefficient. This is defined as the ratio of the solute concentration in the solvent to the solute concentration in the aqueous medium at equilibrium (Bruce and Daugulis, 1991). Therefore, it follows that as the distribution coefficient increases, the greater the affinity o f the substrate/product molecule for the solvent. Using the distribution coefficient workers can therefore determine whether a particular solvent will be useful for delivering substrate to the aqueous phase or whether it will be useful in extracting product from the aqueous phase.
The use o f organic solvents can also has potential disadvantages within a two- phase bioreactor such as inhibition or inactivation of the biocatalyst due to interfacial effects and molecular toxicity of the solvent. In extractive fermentations, unintentional formation of emulsions and protein stripping can also occur (Van Sonsbeek et a l, 1993). Therefore, an important consideration in the design o f a two-liquid phase biotransformation is the relationship between the solvent and biocatalyst. This depends on the choice of solvent and the form of the catalyst.
1.4.1 Catalyst form
the enzyme, whether or not the enzyme can be isolated, the type of reaction and the reaction conditions e.g. T °C (Faber, 1997a).
Generally whole cell catalysts are easy to prepare from a fermentation and can therefore be produced rapidly and cheaply. Whole cell catalysts tend to be more stable than isolated enzymes due to the presence of a cell membrane/wall (Woodley et al., 1990). However, side reactions on the substrate may occur inside the cell (Tramper, 1996) and larger substrates will not be easily transported across the cells membrane. Also, the physiology of the cell can lead to further process issues such as surfactant release (schmid et al., 1998) and increased viscosity of the aqueous phase. Enzymes are more expensive to prepare but are unlikely to produce side reactions and are able to interact with larger substrates. They can also be used in near anhydrous conditions where reactions can be reversed such as deyhdration instead o f hydrolysis (Westcott and Klibanov, 1994; Carrea et al.,
1995; Layh and Willetts, 1998).
1.4.2 Immobilisation of the biocatalyst
1.5 SELECTION OF AN ORGANIC SOLVENT PHASE
1.5.1 Solvent characteristics
Selection of an appropriate solvent for two-liquid phase biocatalysis will depend on the properties o f the solvent and its interaction with the biocatalyst, the substrate and product. The desirable characteristics for such a solvent have been compiled by Bruce and Daugulis (1991) and are shown in Table 1.2.
Solvents that do not tend to form emulsions increase the ease o f phase separation. Recovery o f the solvent phase is fiirther affected by density, viscosity and boiling point of the phases. The solvent should also be non-biodegradable so it is not utilised by the organism. In addition to the above characteristics the solvent must perform optimally for both the reaction and product recovery steps (Bruce and Daugulis, 1991).
Desirable solvent characteristics
Favourable distribution coefficient for product High selectivity
Low emulsion-forming tendency Low aqueous solubility
Chemical and thermal stability
Favourable properties for product recovery Non-biodegradability
Non-hazardous Inexpensive
Available in bulk quantities
Biocompatability__________________________
Table 1.2 Desired characteristics of solvents for use in two-phase
biotransformations. From Bruce and Daugulis (1991).
1.5.2 Solvent biocompatibility
biocatalyst. Hydrophilic solvents cause the membrane o f biocatalyst cells to become more fluid and this has the effect of reducing enzyme activity (Osborne et a l, 1990). A parameter Log P is usually used to indicate the relative polarity of a solvent. It is defined as the logarithm o f the partition coefficient o f a solvent in a water-octanol two-phase system (Laane et al, 1987) and is given by:
Log P = Log [solute]octanol
[solute]water / (1.1)
The more hydrophobic the solvent is (i.e. the greater proportion in the octanol phase) the higher the Log P value. Below are the three types of solvent as defined by Laane et al, (1987) relative to their Log P values:
1. Solvents having a Log P < 2. These are hydrophilic and are least suitable in biocatalytic systems as they rapidly result in a loss of activity.
2. Solvents having a Log P between 2 and 4. For some applications these solvents might be suitable, but harmful effects to the biocatalyst should be anticipated.
3. Solvents having a Log P > 4. These solvents are hydrophobic and are unlikely to damage the biocatalyst. They are the most applicable to biocatalytic processes.
1.5.3 Solvent selection strategy
Strategies for the selection o f an appropriate solvent have been developed by Bruce and Daugulis (1991). To aid in solvent selection they demonstrated methods to predict the biocompatibility and extractive capability of solvents. Biocompatibility is predicted by using heuristic data or the correlation between bioactivity and the Log P value of the solvent or the concentration of solvent in the cell membrane. To predict the behaviour o f a product in an aqueous/solvent system a computer program ESP (extractant screening program) was developed. They further demonstrated that a biocompatible yet poor solvent can be mixed with a toxic solvent that has better extractant properties to yield a mixture that is still biocompatible yet has improved extractant properties. As has already been mentioned solvents disrupt the membrane o f cells. However how much of an effect they have on the biocatalyst is relative to their concentration in the aqueous phase and also in the solvent phase. Bruce and Daugulis have derived an equation (1.2) that indicates whether or not a solvent will show dissolved toxicity in the aqueous phase. This is a further aid in selection o f a suitable solvent;
[Solventfnemb] ~-^^octanol [Solventaq] (L 2)
If the aqueous solubility of a solvent is known and its Log P value can be calculated the above equation can be used to determine the maximum concentration the solvent can reach in the cell membrane (Bruce and Daugulis, 1991). Therefore if the critical concentration cannot be attained then the solvent will not show dissolved toxicity.
1.5.4 Phase ratio
informed decision that will maximise the yield of the desired reaction and minimise toxic and interfacial effects on the catalyst.
In a two-liquid phase system an interface occurs between the two phases across which the transfer o f reactants and products may occur (Lilly et al, 1990). The two-phase ratio (<|)) as defined as ‘the fi*action o f the total reaction volume occupied by the organic phase’ and can determined using Equation 1.3.
<!> = ^ (1.3)
total
Lilly et al, (1990) suggested that three major constraints should be considered when selecting a phase ratio these are operational constraints, mass transfer, and product recovery:
• Operational constraints. The biocatalyst toxicity and inhibition may limit the choice o f phase ratio, therefore the characteristics of the reaction must be considered. For example any reaction that results in the removal or addition of hydrogen ions will result in a change in pH. A buffer may be used to control this if reactant amount is small compared to aqueous volume and it does not interfere with subsequent product recovery. Alternatively the addition of acid or base may be used but this will change phase ratio. Regions of high and low pH will be created by the addition o f acid/base therefore it is preferable to have an aqueous phase as the continuous phase as this will disperse acid/base in the reactor.
consequently the rate o f mass transfer is reduced. Thus maximum interfacial area is attained below the phase ratio for inversion, normally in the range, 0.4 - 0.7. However, other factors such as agitation rate influence the interfacial area at particular phase ratios e.g. the interfacial area is reduced when the interfacial tension and phase density differences are high.
• Product recovery. Phase ratio affects ease of phase separation and product recovery. At extreme values o f phase ratio {(jf< 0.1; (f>> 0.9) phase separation is poor. Intermediate phase ratio values give better recovery from the continuous phase whether this is aqueous or organic. However, improved recovery is counterbalanced by lower product concentration obtained as the volume of the; phase in which it is dissolved increases; this is known as the dilution effect (Chae and Yoo, 1997).
Recovery is also influenced by the Log P value of the product. At high (P > 20) and low values (P < 0.05) it is sensible to recover product only from the organic or aqueous phases respectively. However for intermediate Log P values it will be necessary to recover product from both phases. Alternatively, product can be recovered from one phase with minimal loss in the other by choosing a phase ratio in favour of the recovery phase. Selection o f this phase ratio involves the consideration of the amount of product recovered and its concentration in the phase which will be processed further. The properties o f the liquid phases should also be taken into consideration (Lilly et al., 1990).
1.6 BIOREACTOR DESIGN AND OPTIMISATION
The most common reactor selected for two-liquid phase biocatalysis is the stirred tank reactor. Other reactors employed in the study o f two-liquid phase catalysis have included an immobilised cell fluidised-bed reactor, column-type bioreactors, liquid-impelled loop reactors and membrane reactors (Van Sonsbeek et al, 1993; T)o\g et al, 1998).
1.6.1 Reaction location
The location o f the region where the reaction occurs in the reactor has a direct effect on the kinetics of the overall reaction. Knowing the location of catalysis enables the process to be optimised in that area. This was first demonstrated with the hydrolysis of benzyl acetate by pig liver esterase and toluene oxidation by a strain of Pseudomonas putida. In both instances catalysis was found to occur throughout the bulk of the aqueous phase (Woodley et a l, 1991). To determine the reaction location three parameters are required (Woodley, 1990): the saturation concentration of reactant within the aqueous phase, [Sa*], the biocatalytic reaction rate as a function of the aqueous phase reactant concentration (this is dependent on the catalyst concentration, [Ba]) and finally, the reactant transfer rate from organic to aqueous phase as a function of the aqueous phase reactant concentration. This is dependent on the saturation concentration of reactant within the aqueous phase [Sa*], and the reactant mass transfer coefficient, Klsl.
These parameters will yield information about the location o f catalysis within the reaction medium. This location can then be categorized into one of three reaction zones (Woodley, 1990): conversion o f reactant non-uniformly to product in the majority of the aqueous phase solution, exclusively at the liquid-liquid interface or in the bulk o f the aqueous phase.
1.6.2 Reaction kinetics
overall rate o f reaction. Chae and Yoo (Chae and Yoo, 1997) refer to the rate of reaction as the substrate rate of reaction (SRR). The SRR is defined as shown in Equation 1.4 assuming that the reaction obeys Michaelis-Menton kinetics and does not occur at the interface.
SRR= (1.4)
Where ki is the enzyme activity reaction rate constant (mmol.g’^mm ^), kui is the enzyme michaelis-menton constant (mmol.L'*) E is the enzyme concentration in aqueous phase (g.L"^) and S is the substrate concentration (mmol.L'^). So when designing the bioprocess the intrinsic kinetic values of the enzyme, its relative concentration and the concentration o f the substrate all need to be considered.
1.6.3 Mass transfer
Mass transfer of substrate and product between the two phases has a direct effect on the overall rate o f reaction and on the toxicity and the potential change in pH caused by an increase/decrease in substrate/product concentration. The transfer of mass across the liquid-liquid interface is affected by the size o f the interfacial area (A), the viscosity of the two liquids and the relative concentration of the substrate/product in either phase.
When a substrate containing solvent phase is brought into contact with a biocatalyst containing aqueous phase, substrate in the solvent partitions into the aqueous phase until an equilibrium is reached between the substrate concentration in the aqueous phase ( S \ ) and in the solvent phase (S \). This is defined as the equilibrium partition coefficient (ms) which is shown in Equation 1.5:
(1-^)
At equilibrium the net mass transfer rate is zero. However, as there is a biocatalyst in the aqueous phase equilibrium is never reached. Two reaction specific mathematical models have been developed to simulate the overall rate of reaction incorporating both mass transfer and reaction kinetics in an two-liquid phase system. Although both use different nomenclature they are almost identical in structure and prediction of reaction behaviour. The two models were developed for the tyrosinase catalysed hydroxylation o f phenol (Chae and Yoo, 1997) and the kinetic resolution of a-methylbenzylamine with co-transaminase (Shin and Kim,
1999).
Chae and Yoo refer to the rate of mass transfer as the substrate transfer rate (STR) which is defined in Equation 1.6:
STR = t A ( S , - m , S J
(1.6)The rate of product formation and partioning into the solvent phase can also be described in a similar manner.
The Chae and Yoo (1997) model were found to fit the data well and the conversion of substrate was found to depend strongly on initial substrate and enzyme concentrations and phase volume ratio as well as the size of the interfacial area which correlates with other observations in the literature (Westgate et al.,
1995; Collins et a l, 1995).
1.6.4 Windows of operation
Optimising a two-phase biotransformation involves the consideration of key quantitative parameters. Often these are the ‘bottle-neck’ or rate limiting steps of the biotransformation and extremes of these parameters will result in an inefficient reaction. Graphical representation of relevant constraints enables the identification of an area of the graph or a ‘window’ through which yield can be maximised or a process optimised. This concept is a ‘window of operation’ (Woodley and Titchener-Hooker, 1996). As the process scale is increased further bounds are introduced these reduce the size of the operating window (Woodley, 1990).
1.7 SCALE-UP OF TWO-LIQUID PHASE BIOREACTORS
1.7.1 Mixing
For effective mixing in a two-liquid-phase bioreactor there must be turbulent conditions in the fluids (Doran, 1997). This is created by agitation of the two phases by an impeller. The most common impeller design used is the 6-flat-blade disc-turbine or Rushton turbine because it can be operated in a broad range of viscous liquids. However, other designs such as the propeller, anchor and helical screw are also available. The application of impeller type is generally governed by the viscosity range o f the impeller.
The standard parameter used to measure fluid turbulence in stirred tank bioreactors is the impeller Reynolds number. Re, (Equation 1.8).
Re _ P (1.8)
Where is the stirrer speed, D, is the impeller diameter, p is the fluid density and p is fluid viscosity. Thus there is a corresponding decrease in Ret with increasing fluid viscosity.
1.7.2 Scale-up
Transport phenomena such as mass transfer which is one o f the most important functions of two-liquid-phase mixing are scale dependent (Atkinson and Mavituna, 1991). As an example the volume o f fluid mixing in a stirred tank reactor can be considered. If the reactor is scaled up geometrically the volume also increases as does the length o f path o f the fluid for bulk circulation. Therefore to keep the mixing time identical the velocity must be increased by increasing agitation. However, power per unit volume is proportional to the fluid velocity squared (Equation 1.9). Thus maintenance o f fluid velocity becomes expensive with increasing scale. This method of scale-up is inefficient therefore a practical ‘rule of thumb’ is to scale-up on the basis of constant power input per unit volume (PA^). This maintains the original parameters o f the small scale reactor but the mixing time (due to reduced fluid velocity) will now increase with increasing scale.
% a - v ^ (1.9)
In theory, complete similarity between bioreactors of different scale can only be achieved by preserving the geometric, kinetic, dynamic, biochemical and chemical properties o f the system. However, this is rarely possible. Therefore basic rules of thumb have to be applied. The two most common criteria for scale-up o f mixing systems are equal power per unit volume and equal impeller tip speed. Equal power per unit volume can be applied to a variety of mixing processes including those involving mass transfer and dispersion (Okufi et al., 1990). For turbulent systems possessing the same physical properties in geometrically similar tanks the scale-up under a power per unit volume regime (PA^) is related to Equation 1 . 1 0 which in turn is related to the power Equation in 1.11.
Thus the power number represents the ratio o f power to inertia forces and is constant at large Reynolds numbers. Therefore, this criterion o f equal power input per unit volume represents dynamic similarity under conditions o f negligible viscous forces. The relationship for scale-up under a tip speed regime is expressed in Equation 1.12.
N D i = Constant (1.12)
Therefore it is apparent that scale-up under a power per unit volume regime will lead to higher impeller speeds in the bioreactor compared to scale-up under a tip speed regime. This may be more beneficial for the biotransformation than tip speed because of the increased interfacial area associated with a higher impeller speed. Conversely the increase in speed could harm the biocatalyst in which case the slower speed under a tip speed regime would be a more appropriate selection. P/V and tip speed are the most common scale-up criteria other criteria that can be considered are constant mixing time and constant shear rate (relevant where the organism is shear sensitive or the liquid exhibits non-newtonian rheology) (Ju and Chase, 1992).
Many authors indicate the need to maintain geometric similarity during scale-up of a bioreactor (Hempel, 1988; Ju and Cheise, 1992; Woodley, 1990; Diaz and Acevedo, 1998). Maintenance of geometric similarity is essential because it reduces the variables of scale-up and has a direct impact on other scaleable parameters such as tip speed (Equation 1.1.3) (Wemesson and Trâgârdh, 1999):
VTip = 7TND (1.13)
1999). The OTR is a measure o f the oxygen mass transfer potential which is analogous to the STR (Equation 1.6) (Chae and Yoo, 1997) mentioned in section 1.6.3. The STR like the OTR is affected by both the physical constraint of interfacial area and the biological constraint of the rate of reaction. Therefore if STR is to be used as a scale-up parameter then SRR should be optimised i.e. the most efficient concentration of biocatalyst in relation to the substrate concentration and phase ratio.
1.8 DROP SIZE MEASUREMENTS IN AGITATED
TWO-PHASE SYSTEMS
To analyse the relative success of a given scale-up regime it will be necessary to measure the interfacial area of liquid-liquid dispersions at different scales. The rationale for this is that if mixing conditions appear to be the same in geometrically similar reactors of different scale then it should be possible to recreate the reaction conditions at different scales without the need for re optimisation or fresh experiments.
When two immiscible liquids are agitated, a dispersion is formed in which continuous break-up and coalescence of drops occurs. Drop break-up is caused by turbulent fluctuations near the surface o f the drop and coalescence occurs occasionally when drops collide. Eventually a dynamic equilibrium is created and this leads to a range of drop sizes in the mixture. The average drop size in this range will depend on the physical properties of the two liquids and any other components in the reactor as well as the level o f agitation in the reactor.
The most common term used for expressing drop size and distributions is the Sauter mean diameter (dgi), defined in Equation 1.14.
d32 = ^ (1.14)
/=1
^ = a ( l+ b « S ) ( N w e ) - " '’ (1 .1 5 )
1.9 AIMS AND OBJECTIVES OF THE PROJECT
The biotransformation of poorly water-soluble aromatic dinitriles is o f scientific and industrial interest. Although processes do exist for the transformation of water-soluble compounds, such as acrylonitrile, no description of a process suitable for the large scale biotransformation of poorly water soluble nitriles currently appears in the literature. This work will attempt to investigate the systematic design and optimisation of a process for the production of 3- cyanobenzamide from the poorly water soluble substrate 1,3-dicyanobenzene (1,3- DCB) and also to define the criteria for successful scale-up of the process to the 75 L scale. The production o f 3-cyanobenzamide is of interest as this molecule is not commercially available and is not manufactured industrially by a chemical catalyst.
The biotransformation of 1,3-DCB by Rhodococcus R312 was chosen because the microorganism has been extensively studied in the literature and the production of 3-cyanobenzamide from 1,3-dicyanobenzene has previously been shown in a closely related species (Martinkova et a l, 1995). Rhodococcus R312 is also known to possess only a regio-selective NHase and Amidase (Kerridge, 1995) so no nitrilase is present which may convert the subsrate directly into the acid product. Due to the poor water solubility of 1,3-DCB the selection o f a two-phase reactor is the most obvious process step to increase the supply of substrate. Use of an organic solvent may harm the biocatalyst but fortunately Rhodoccus R312 is known to be a tough and durable biocatalyst.
two-phase biotransformation can be demonstrated using an ionic liquid this will be an indicator of further novel applications for ‘green’ ionic liquid technology.
Having chosen the components for the bioprocess the next stage will be to optimise the process conditions to maximise the production of 3-cyanobenzamide. This can be achieved by using a combination o f experimental design, heuristics and process design tools such as windows of operation (Woodley and Titchener- Hooker, 1996).
Assuming that the optimisation stage is succesful and biomass can be produced in sufficient quantity the next stage of the project will be an investigation into the most appropriate scale-up regime for the biotransformation. Scale-up criteria of constant V N and tip speed will be tested. The result o f Sauter mean diameter studies and biotransformations will determine which is the better regime for scale- up of two-phase bioreactors on the basis of maintenance o f constant interfacial area.
The specific aims o f the project are therefore:
A) To maximise the fermentation production o f the biocatalyst Rhodococcus R312 to supply biomass for the 75 L bioprocess.
B) Evaluate the use o f a second liquid phase as a process option for making greater concentrations of the poorly water soluble 1,3-DCB available to the biocatalyst. Investigate, define and optimise the conditions of the biotransformation to achieve the maximum space-time yield of the 3-cyanobenzamide from the poorly water soluble substrate, 1,3-DCB.
C) Investigate the use and application of novel ionic liquids as potential replacements for organic solvents.
D) Define a reliable basis for scale-up of reactor hydrodynamics.
2. MATERIALS AND METHODS
2.1 CHEMICALS AND MICROORGANISM
2.1.1 Main chemicals
The organic solvent toluene and other solvents used in this work were purchased from Sigma-Aldrich Chemical Co. (Dorset, UK) and were o f the highest purity available. The reaction substrate 1,3-dicyanobenzene, buffer salts KH2PO4 and K2HPO4, other chemicals and medium components used were also purchased from Sigma-Aldrich Chemical Co. (Dorset, UK) except Oxid agar N o.l which was purchased from Oxoid (Basingstoke, UK).
2.1.2 Synthesis and purification of ionic liquid [bmimJfPFg]
The ionic liquid [bmim][Pp6] was synthesised by J.D. Holbrey o f the QUILL centre. Queen’s University of Belfast, Northen Ireland using the following protocol.
2.1.2.1 l-Butyl-3-methylimidazolium chloride, [bmimjCl
2.1.2.2 l-Butyl-3-methylimidazolium hexafluorophosphate, [bmim][PF6]
A stirred solution of [bmimJCl (313 g, 1.764 mol) (Section 2.1.2.1) in H2O (250 mL) was cooled to 0 °C in an ice-bath, and hexafluorophosphoric acid (264 mL, 40% aqueous solution) was added slowly with rapid stirring. The resulting biphasic mixture was stirred for 2 hours., then allowed to come to room temperature, whence the upper, aqueous phase was decanted. The lower, ionic liquid phase was washed with water (5 x 500 mL), and saturated aqueous NaHCOs solution (2 x 500 mL) to ensure neutrality, and then extracted into dichloromethane (400 mL). The organic phase was dried over MgS0 4, filtered, the solvent removed under reduced pressure and the ionic liquid dried for 6 hours at 70 °C in vacuo. Yield 400 g, (1.41 mol, 80%) as a colourless liquid (Calculated for C8H15N2PF6: C, 33.81; H, 5.32; N, 9.86. Found: C, 33.62; H, 5.37; N, 9.90%).
2.1.3 Organism source
The microorganism used, Rhodococcus R312, was a kind gift from Professor N. J. Turner (University of Edinburgh, UK) and was stored on nitrile-metabolising (Section 2.1.4) agar at 4°C (Kerridge, 1995).
2.1.4 Culture storage (short-term)
2.1.5 Culture storage (long term)
2.1.5.1 Agar slopes
Isolates were stored on ‘nitrile-metabolising’ agar slopes and were stored at 4 °C for up to 4 months. Subcultures were made at monthly intervals.
2.1.5.2 Glycerol stocks
A loopful of bacteria was transferred to growth media as described in either 2.2.1 or 2.2.2. This was mixed with sterile glycerol (final concentration 50% (v/v)) and stored at -20 °C for up to one year.
2.2
MEDIA
COMPOSITION AND
CONDITIONS
FOR
GROWTH
2.2.1 Rich growth medium (RGM)
2.2.2 Tiyptic soy broth (TSB) medium
To achieve greater biomass production the microorganism was also cultivated on a Trptic Soy Broth (TSB) medium adapted from Chartrain et a l (1998) containing 30 g.L'^ of TSB powder. This was dissolved into deionised water and autoclaved at 15 psi for 20 minutes.
2.3
FERMENTATION
CONDITIONS
AND
BIOMASS
HARVESTING
2.3.1 Shake flask fermentations
200 mL liquid volume fermentations were carried out in 2 litre baffled conical flasks in a orbital shaking incubator operated at 200 rpm and 30 °C. Cells were subsequently harvested by centrifugation at the end o f the exponential growth phase. This was typically two days after inoculation at an OD6 0 0 o f 1.0 with rich growth media and at an OD^oo of 12.0 with tryptic soy broth media (Section 2.2.1 and 2.2.2). The cells were then resuspended in an appropriate biotransformation buffer before use (usually 0.1 M KH2PO4-K2HPO4 phosphate buffer, pH 7) as described in Section 2.4.1. Shake flasks were regularly sampled using asceptic techniques to monitor optical density and biomass wet weight and cell dry weight (Section 2.7.1).
2.3.2 Stirred tank fermentations
online with an Ingold DO probe produced by Ingold Messtecknik Ag (Urdorf, Switzerland).
2.3.2.1 7 L Fermentation
The 5 L fermentation was performed in an Inceltech (Pangboume, UK) 7 L fermenter. The main tank was 40 cm high and 15 cm in diameter with an H:T ratio of 2.63. Agitation was provided by a two-stage 5 cm diameter Rushton turbine impeller. The reactor was filled with 4.5 L sterile 30 g.L'^ TSB in deionised water and 1 mL PPG (surfactant) which was sterilized in place at 121 °C for one hour. The reactor was run at 30 °C, 700 rpm, at aeration rate o f 0.5 VVM. The fermentation was initiated by inoculation with 500 mL o f Rhodococcus R312 cell suspension which had also been grown in 30 g.L'^ TSB (harvested at ODôoo = 12). pH was kept at 7 by the controlled addition o f 4M NaOH and 4M phosphoric acid. Foaming was regulated by the controlled addition of PPG antifoam in response to the antifoam probe. The fermentation was stopped at approximately 25 hours when ODôoo = 1 6 . Samples were collected from the sample port every hour and analysed for biomass wet weight, dry cell weight (Section 2.7.1) and activity (Section 2.5).
2.5.2.2 20 L Fermentation
![Figure 4.10 Two-phase Rhodococcusand harvested at 30 hours. The biotransformation was as described in Section 2.6.1.2.6 with a phase volume ratio of 0.2 and the initial [1,3-DCB] concentration in the toluene phases of 25 conditions; R312 biotransformation](https://thumb-us.123doks.com/thumbv2/123dok_us/8227354.1373663/97.595.40.380.88.324/rhodococcusand-harvested-biotransformation-described-section-concentration-conditions-biotransformation.webp)
![Figure 5.1 Chemical structure of [bmim][PF6] and examples of cations and anions commonly used in the creation of ionic liquids (from Roberts and Lye, 2001).](https://thumb-us.123doks.com/thumbv2/123dok_us/8227354.1373663/103.595.32.451.161.661/figure-chemical-structure-examples-cations-commonly-creation-roberts.webp)
![Figure 5.4 Retention of Rhodococcustoluene and (■) aqueous-[bmim] [PFô] two-phase systems; (••*) activity of single aqueous phase control](https://thumb-us.123doks.com/thumbv2/123dok_us/8227354.1373663/108.595.55.427.59.319/figure-retention-rhodococcustoluene-aqueous-systems-activity-aqueous-control.webp)
