Article
1
2DE-Pattern: A Database for Inventory of Human
2
Proteoforms
3
Stanislav Naryzhny1,2 ⃰, Nikolay Klopov2, Natalia Ronzhina2, Elena Zorina1, Victor Zgoda1, Olga
4
Kleyst2, Natalia Belyakova2, Olga Legina2
5
1 Orekhovich Institute of Biomedical Chemistry of Russian Academy of Medical Sciences, Pogodinskaya 10,
6
Moscow, 119121, Russia
7
2 B.P. Konstantinov Petersburg Nuclear Physics Institute, National Research Center "Kurchatov Institute",
8
Orlova roshcha, Gatchina, Leningrad region, 188300, Russia
9
10
* snaryzhny@mail.ru; Tel.: (+7) 9111764453
11
12
Abstract: The human proteome is composed from diverse and heterogeneous gene
13
products/proteoforms. Previously, we have been discussing the main technical aspects in
14
developing for inventory of human proteoforms that would be visually attractive, clear, and easy
15
to search (Naryzhny S. J. Proteomics 2018, S1874-3919(18) 30220-3). Here, we present our first draft
16
of the database of proteoforms that is based on this discussion. The database principles and structure
17
are described. The database is called “2DE-pattern” as it contains multiple isoform-centric patterns
18
of proteoforms separated according to 2DE principles.
19
Keywords: proteoforms; database; bioinformatics; pattern; 2DE
20
1. Introduction
21
Detailed information about all human proteins is a main target of the Human Proteome
22
Organization (HUPO). Until now, the main efforts of scientific community were pointed to finding
23
the proteins coded by the corresponding genes. This task is close to completion now as from the list
24
of 20199 predicted proteins only ~2000 proteins remain as so-called “missing proteins” and attract
25
the special attention of C-HPP community. But the situation is much more complicated as proteins
26
coded by the same gene can exist in different forms [1–3]. There are different processes generating
27
these forms. Some of them are using genetic variations at mRNA level, such as alternative splicing,
28
different promoters and translation initiation sites. These protein forms are called “isoforms”.
29
Additionally, these isoforms can be further chemically modified by post-translational modifications
30
(PTM). The final protein products are called “proteoforms” [3,4]. Because of different combinations
31
of these events, theoretically human proteome could encompass billions of proteoforms [5–8]. Under
32
the same protein name, multiple proteoforms that fulfill different functions can exist. Accordingly,
33
there is a need for a comprehensive inventory of this variety. Proteomics goes deeper and deeper into
34
heterogeneity of proteins; volume of information grows very fast, so there is high demand in
35
convenient ways to use this information. Because of huge amount of data generated, protein
36
databases are a crucial part of proteomics. Indeed, search of sequences databases is a first step in
37
proteomics based on mass spectrometry. In addition, multiple additional databases were developed
38
and are available. The well-known databases are in the National Center for Biotechnology
39
Information (NCBI; http://www.ncbi.nlm.nih.gov) and SIB Bioinformatics Resource Portal ExPASy,
40
https://www.expasy.org/. Some of them are NeXtProt, UniProt, SWISS-2DPAGE
41
(https://www.nextprot.org/,http://www.uniprot.org/,
https://world-2dpage.expasy.org/swiss-42
2dpage/) [9–11]. Usually the databases are based on the specific method by which the data were
43
generated. The separation method that ideally suit for proteome analysis is two-dimensional gel
44
electrophoresis (2DE). Because of parameters that are used in this method it fits very well for the
45
database development. Accordingly, multiple 2DE-based protein databases for different objects
46
including human samples, where bottom-up mass spectrometry is widely used, were built, [12]. Now
47
it became evident that for complete characterization of proteoforms top-down mass spectrometry is
48
necessary. So, a proteomics project, where top-down mass-spectrometry was used, was initiated [13].
49
Inside this project, a proteoform database (proteoform atlas) http://atlas.topdownproteomics.org,
50
was organized [13,14]. It makes sense to combine all information flows obtained by these and other
51
approaches. As we generated a body of information about proteoforms that is conveniently
52
organized in a graphical way we decided to build a database, where this information can be kept and
53
used by scientific society.
54
2. Materials and Methods
55
2.1. Sample preparation
56
Human glioblastoma cells (a primary line L of glial tumor origin, developed in the laboratory of
57
cell biology, PNPI) were cultured in DMEM or RPMI-1640 medium containing 5% fetal calf serum in
58
5% CO₂ at 37°C without antibiotics [15–16]. Samples were prepared as described previously [17].
59
Cells (~107) containing 2 mg of protein were treated by 100 µ L of lysis buffer (7 M urea, 2 M thiourea,
60
4% CHAPS, 1% dithiothreitol (DTT), 2% ampholytes, pH 3-10, protease inhibitors mixture). The
61
protein concentration in the sample was determined by the method of Bradford [18].
62
2.2. 2DE
63
2DE was performed using immobilized pH gradient (IPG) for isoelectric focusing (IEF) [19].
64
After IEF, strips (7 or 24 cm) were soaked 10 min in the equilibration solution (50 mM Tris, pH 8.8, 6
65
M urea, 2% sodium dodecyl sulfate (SDS), 30% (v/v) glycerol, 1% DTT). This process was followed
66
by 10-min incubation in the equilibration solution containing 5% iodoacetamide (IAM) instead of
67
DTT. The strips were placed on the top of the 12% polyacrylamide gel of the second direction and
68
sealed with a hot solution of 1 mL of 0.5% agarose prepared in electrode buffer (25mM Tris, pH 8.3,
69
200 mM glycine, and 0.1% SDS) and electrophoresed to second direction under denaturing conditions
70
using the system Ettan DALTsix (240 × 200 × 1 mm) or Hoefer miniVE (80 × 90 × 1 mm) (GE
71
Healthcare, Pittsburgh, PA, USA). Electrophoresis was carried out at room temperature at constant
72
power 3.5 W per gel [16,20]. Gels were stained with Coomassie Blue R350, scanned by ImageScanner
73
III (GE Healthcare), and analyzed using ImageMaster 2D Platinum 7.0 (GE Healthcare). In case of a
74
sectional 2DE, the gel (8 × 8 cm) was divided into 96 sections with determined coordinates identified
75
as 1-12 along the Mw dimension and A-H – along the pI dimension. All procedures were performed
76
according to the protocol described previously [20]. Each section (~0.7 cm²) was cut, shredded, and
77
treated by trypsin according to the protocol for single spots identification with proportionally
78
increased volumes of solutions. Tryptic peptides were eluted from the gel with extraction solution
79
(5% (v/v) ACN, 5% (v/v) formic acid) and dried in a vacuum centrifuge Speed Vac. Peptides were
80
dissolved in 5% (v/v) formic acid. In case of a semi-virtual 2DE [21], a 24 cm IPG strip was cut into 48
81
equal sections (2 mm), and each section was transferred to Eppendorf tube. For complete reduction,
82
300 µ L of 3 mM DTT, 100 mM ABC was added to each sample and incubated at 50°C for 15 min. For
83
alkylation, 20 µ L of 100 mM IAM were added to the same tube and incubated in the dark at room
84
temperature for 15 min. For digestion, stock solution of trypsin (0.1 mg/mL) was diluted 1:10 by 25
85
mM ABC, and 100 µ L of diluted trypsin was added into each tube. Samples were incubated overnight
86
for 4-24 h at 37°C. Supernatants that may contain peptides that have diffused out of the gel slices
87
were collected to new labeled 0.5 mL tubes. Peptides were extracted by adding 150 µ L of 60% ACN,
88
0.1% trifluoroacetic acid (TFA) to each tube containing gel slices. Extracts were dried in Speed Vac,
89
reconstituted in 20 µ L of 0.1% TFA, and analyzed by mass spectrometry.
90
91
2.3. MALDI MS and ESI LC-MS/MS analysis
All procedures were performed according to the protocol described previously [17,22,23].
93
MALDI TOF mass spectrometry was performed using Microflex MALDI/TOF (Bruker Inc, Bremen,
94
Germany). Tandem mass spectrometry analysis was carried out on an Orbitrap Q-Exactive mass
95
spectrometer (Thermo Scientific, Waltham, MA, USA) according to the protocols described
96
previously [24].
97
2.4. Protein identification
98
Identification of proteins was performed using Mascot “2.4.1” (Matrix Science, London, UK) by
99
searching UniProt/Swiss-Protein sequence database (October 2014, 20196 total sequences). The
100
following search parameters were used: trypsin – as the cutting enzyme, mass tolerance for the
101
monoisotopic peptide window was set to ±50 ppm, missed cleavages - 1. Cysteine carbamidomethyl
102
was chosen as a fixed modification. A combination of three variable modifications (acetylation of
103
lysine, acetylation of N-end, phosphorylation of serine/threonine or tyrosine, oxidation of
104
methionine) was used. NeXtProt database was used as a protein sequence database. For FDR
105
assessment, a separate decoy database was generated from the protein sequence database. False
106
positive rate of 1% was allowed for protein identification. A minimum Mascot ion score of 30 was
107
used for accepting peptide MS/MS spectra. Data were also searched, using the SearchGUI, an
open-108
source graphical user interface [25]. Two unique peptides per protein were required for all protein
109
identifications. Exponentially modified PAI (emPAI), the exponential form of protein abundance
110
index (PAI) defined as the number of identified peptides divided by the number of theoretically
111
observable tryptic peptides for each protein, was used to estimate protein abundance [26]. All
112
additional information about the methods can be also reached through the front page of the database
113
by clicking the corresponding links for protocols or articles.
114
3. Results
115
3.1. Overview of the database
116
Our main goal is to construct the proteoform database based on 2DE principles. This database
117
should provide a comprehensive and simple tool to keep and share information about human
118
proteoforms with the scientific community. As each proteoform is a unique molecule (polypeptide),
119
a central point in our strategy is usage of such specific polypeptide parameters as isoelectric point
120
(pI) and molecular weight (Mw). Combination of these physicochemical parameters gives a
121
convenient representation of each polypeptide. It is very felicitous that in the classical 2DE separation
122
is performed exactly according to these parameters. It is logical that the SWISS-2DPAGE database
123
that based on these parameters was developed [9,10]. Because of high popularity of 2DE, the
SWISS-124
2DPAGE became a part of the federated 2-D PAGE database [28]. Following in many aspects the
125
organization style of this database we have constructed our human proteoform database. Compare
126
to the SWISS-2DPAGE database this database has some additions. To obtain information about
127
proteoforms, we are using three different approaches based on 2DE separation and identification by
128
mass-spectrometry. First approach is based on a classical 2DE, which is mainly performed according
129
to rules used in the SWISS-2DPAGE and the federated 2DE database [27]. Second one is a sectional
130
2DE, when a whole gel not only selected spots is analyzed by ESI LC-MS/MS section by section. Third
131
one – a semi-virtual 2DE, when proteoforms are separated only by IEF according to their pI. Each
132
approach allows to produce a specific proteoform pattern for every isoform. All three approaches
133
have limitations, but they are complementary each other and allow to obtain better view of the
134
combine proteoform profiles of isoforms.
135
3.2. Database content and search features
136
Our laboratories have expertise in proteomics by analysis of proteins and proteoforms using
137
2DE and mass spectrometry (MALDI TOF and ESI LC-MS/MS) [28]. We are using different samples,
and information about proteoform patterns obtained from experiments performed with these
139
samples is included into the database. Each entry in the database corresponds to one protein isoform
140
and contains a textual as well as a graphical data. Every search starts from the front page (Figure 1),
141
where four different protein search options are offered: 1 – UniProt accession number of the protein,
142
2 – name of the protein, 3 – name of the gene, 4 – graphical interface (2DE map). Also, in the front
143
page, user can find links to the methods and papers that contain information that was included into
144
the database. Depending on the choice taken, it will be one- or two-step transition to the protein page
145
(Figure 2), where the basic information about the protein is presented. The ID (identification) and the
146
AC (accession number) are the same as the corresponding sequence entry in SWISS-PROT. The
147
description line contains general information about the protein. The page also contains a subset links
148
to protein portals such as protein atlas, UniProt, NeXtProt. Also, accession numbers and names of
149
all known isoforms for this protein are presented here. By clicking on the isoform accession number,
150
user is transferred to the page of this isoform (an isoform page) (Figure 3). Isoform page has links to
151
the pages of different samples with information about this isoform (a sample pages). By clicking on
152
the corresponding link, user can go to the sample page and obtain the proteoform pattern that is
153
produced by each of these approaches. In the first draft of our database, there is only one sample –
154
glioblastoma cells [29]. There is also a link in the sample name, where available information about
155
detected isoforms is presented as a table. More samples, such as normal and cancer cells
156
(hepatoblastoma carcinoma (HepG2), lung fibroblasts (LEH), HeLa, HEK) and tissues (liver, blood
157
plasma) will be incorporated soon.
158
159
Figure 1. The front page of the human proteoform database “2DE pattern”.
161
Figure 2. A protein page of the human proteoform database “2DE pattern”. Main information about ATP synthase
162
subunit alpha (ATPA) is shown. Beneath, a choice of isoform is available.
163
164
165
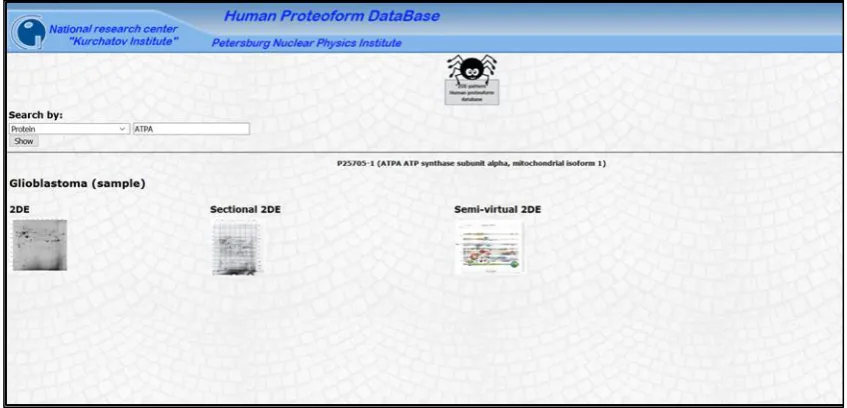
Figure 3. An isoform page of the human proteoform database “2DE pattern”. A selection of three types of the 2DE
166
pattern for the isoform 1 of ATPA (P25705-1) is presented (2DE, sectional 2DE, or semi-virtual 2DE).
167
168
There are three types of a sample page. In a first type (2DE), user can find a proteoform pattern of the
169
isoform that is obtained by a classical 2DE (Figure 4A). This pattern is presented in a page that is
170
organized based on the same principles as the SWISS-2DPAGE database and the federated 2DE
171
database: http://world-2dpage.expasy.org/. In a 2DE map, spots, where different proteoforms of the
172
same isoform were detected, are highlighted. Accordingly, a proteoform pattern of this isoform is
173
produced. Additionally, basic experimental information about the spot abundance and the isoform
174
(isoform name, protein name, gene name, chromosome, theoretical pI, theoretical Mw, experimental
175
pI, theoretical Mw, emPAI, modifications) is shown. Minimal information obtained by mass
176
spectrometric analysis is shown in the table. Also, by clicking on a spot user can extract information
177
about all isoforms that were detected in this spot. For to-day, we have analyzed 700 spots and
178
identified 703 different isoforms.
180
Figure 4A. A sample page of the human proteoform database “2DE pattern”, where a classical 2DE is used. All spots,
181
where isoforms were detected are marked by green. Information about each spot is presented in a table. Spots with
182
proteoforms of the isoform 1 of ATPA (P25705-1) are shown by red.
183
A second type of a sample page – a page, where a pattern is extracted from the sectional 2DE [20]
184
(Figure 4B). Here, two images are presented – a whole image of 2DE with sections and a graph
185
showing distribution of specific proteoforms around these sections. Additionally, in a similar way as
186
in the first type of a sample page the detailed information about the isoform and its proteoforms is
187
presented in the Tables. For to-day, we have data for 3472 isoforms.
188
189
Figure 4B. A sample page of the human proteoform database “2DE pattern”, where a sectional 2DE is used.
190
Proteoform pattern of the isoform 1 of ATPA (P25705-1) is shown.
191
Third type of a sample page – a page, where pattern of the isoform is produced by semi-virtual 2DE
192
(Figure 4C). Here on the left, a semi-virtual 2DE of proteoforms of the most abundant cellular proteins
193
is presented. On the right – a proteoform pattern of the isoform. Inside the graph, proteoforms are
194
represented proportionally (according to emPAI) by balls. Also, available information about the
isoform and detected proteoforms is presented in the tables. At this moment, such patterns are
196
available for 3549 isoforms.
197
198
Figure 4C. A sample page of the human proteoform database “2DE pattern”, where a semi-virtual 2DE is used.
199
Proteoform pattern of the isoform 1 of ATPA (P25705-1) is shown.
200
What is important, in all these sample pages, user can go over to Uniprot or Proteoform atlas. In
201
UniProt, available information about post-translation modifications (PTM) of the isoform can be
202
found. In Proteoform atlas, it is possible for some cases to find proteoforms that have been already
203
detected by top-down mass spectrometry. Collecting all these data together will allow to draw a final
204
proteoform pattern.
205
4. Discussion
206
At the moment, our database doesn’t have the substantial body of information about PTM that
207
are responsible for the variety of observed proteoforms (patterns). The database needs more specific
208
information about PTM of proteoforms. We have plans to include this information into the database
209
gradually after more detailed MS data analysis. The website currently presents information about
210
glioblastoma proteins only. More information using other samples (proteins from FLEH, HepG2,
211
HEK, HeLa, liver, and plasma) will be included into the database as a next step.
212
5. Conclusions
213
This work describes the database “2DE-pattern” that was developed for keeping and sharing
214
information about patterns or profiles of human proteoforms. These patterns were generated by
215
separation of proteoforms, identification them by mass spectrometry, and constructing of multiple
216
graphs, where proteoforms of the same isoform are presented. Separation was performed according
217
to pI/Mw parameters using three variations of a classical 2DE. Accordingly, it can be up to three
218
different proteoform profiles for each protein isoform entry in the database. All these patterns are
219
complementary each other and allow to come closer to the complete set of proteoforms. In some cases,
220
information about PTM of these proteoforms that was obtained from MS data is available.
221
Additionally, based on pI/Mw parameters it is possible to have a hint whether a proteoform has any
222
PTM or not. It is important to point out that usually in the most abundant proteoforms theoretical
223
and experimental pI/Mw parameters are very similar showing that these proteoforms mostly likely
224
are not modified. All types of a shift (left, right, up, down) are a result of different types of PTM. So,
depending on the shift direction we can propose, which kind of PTM was happened. More detailed
226
data can be also found by clicking the links to UniProt database. Using the available information,
227
user will have a chance to construct a more detailed image of the proteoform pattern. We can expect
228
this ideal situation only in future as right now Proteoform atlas has data only about 9,694 proteoforms
229
detected in all human cells. According to the modest evaluations just a single human cell has at least
230
70000 proteoforms and a human proteome could encompass billions of proteoforms [5–8].
231
The database is freely available at http://www.2de-pattern.pnpi.nrcki.ru
232
233
Author Contributions: conceptualization, supervision, writing—review and editing, Stanislav Naryzhny;
234
software, data curation, resources, Nikolay Klopov; formal analysis, data curation, Natalia Ronzhina; formal
235
analysis, data curation, Elena Zorina; formal analysis, data curation, Victor Zgoda; data curation, Olga Kleyst;
236
data curation, Natalia Belyakova; data curation, Olga Legina.
237
Acknowledgments: The data was obtained under the Program of Fundamental Research of State Academies of
238
Sciences for 2013-2020. Mass-spectrometry measurements were performed using the equipment of “Human
239
Proteome” Core Facilities of the Institute of Biomedical Chemistry (Russia).
240
Conflicts of Interest: The authors declare no conflict of interest.
Abbreviations
242
The following abbreviations are used in this manuscript:
243
2DE two-dimensional electrophoresis
244
ESI LC-MS/MS liquid chromatography-electrospray ionization-tandem mass spectrometry
245
ABC ammonium bicarbonate
246
ACN acetonitrile
247
MS mass spectrometry
248
PTM post-translation modifications
249
emPAI exponential modified form of protein abundance index
250
251
References
252
1. Schlüter H.; Apweiler R.; Holzhütter H-G.; Jungblut P.R. Finding one’s way in proteomics: a protein species
253
nomenclature. Chem Cent J. 2009, 3, 11.
254
2. Jungblut P.; Thiede B.; Zimny-Arndt U.; Muller E.C.; Scheler C.; Wittmann-Liebold B.; Otto A. Resolution
255
power of two-dimensional electrophoresis and identification of proteins from gels. Electrophoresis. 1996,
256
17, 839–47.
257
3. Smith L.M.; Kelleher N,L. Proteoform: A single term describing protein complexity. Nature Methods. 2013,
258
10, 186–7.
259
4. Smith L.M.; Kelleher N.L. Proteoforms as the next proteomics currency. Science (80- ). 2018, 359, 1106–7.
260
5. Kelleher N.L. A cell-based approach to the human proteome project. J Am Soc Mass Spectrom. 2012, 23,
261
617–24.
262
6. Jungblut P.R. The proteomics quantification dilemma. J Proteomics. 2014, 107, 98–102.
263
7. Naryzhny S.N.; Lisitsa A.V.; Zgoda V.G.; Ponomarenko E.A.; Archakov A.I. 2DE-based approach for
264
estimation of number of protein species in a cell. Electrophoresis. 2014, 35, 895–900.
265
8. Naryzhny S.N.; Zgoda V.G.; Maynskova M.A.; Ronzhina N.L.; Belyakova N.V.; Legina O.K.; Archakov A.I.
266
[Experimental estimation of proteome size for cells and human plasma]. Biomed Khim. 2015, 61, 279–85.
267
9. Gasteiger E.; Gattiker A.; Hoogland C.; Ivanyi I.; Appel R.D.; Bairoch A. ExPASy: The proteomics server
268
for in-depth protein knowledge and analysis. Nucleic Acids Res. 2003, 31, 3784-8.
269
10. Hoogland C.; Sanchez J.C.; Walther D.; Baujard V.; Baujard O.; Tonella L.; Hochstrasser D.F.; Appel, R.D.
270
Two-dimensional electrophoresis resources available from ExPASy. Electrophoresis. 1999, 20, 3568-3571.
271
11. Lane L.; Argoud-Puy G.; Britan A.; Cusin I.; Duek P.D.; Evalet O.; Gateau A.; Gaudet P.; Gleizes A.;
272
Masselot A.; Zwahlen C.; Bairoch A. NeXtProt: A knowledge platform for human proteins. Nucleic Acids
273
Res. 2012, D76-83.
274
12. Hoogland C.; Mostaguir K.; Appel R.D.; Lisacek F. The World-2DPAGE Constellation to promote and
275
publish gel-based proteomics data through the ExPASy server. J Proteomics. 2008 71, 245-8.
276
13. Toby T.K.; Fornelli L.; Kelleher N.L. Progress in Top-Down Proteomics and the Analysis of Proteoforms.
277
Annu Rev Anal Chem (Palo Alto Calif). 2016, 9, 499–519.
278
14. Leduc R.D.; Schwämmle V.; Shortreed M.R.; Cesnik A.J.; Solntsev S.K.; Shaw J.B.; Martin M.J.; Vizcaino
279
J.A.; Alpi E.; Danis P.; Kelleher N.L.; Smith L.M.; Ge Y.; Agar J.N.; Chamot-Rooke J.; Loo J.A.; Pasa-Tolic L.;
280
Tsybin Y.O. ProForma: A Standard Proteoform Notation. J Proteome Res. 2018, 17, 1321-1325.
281
15. Naryzhny S.N.; Ronzhina N.L.; Mainskova M.A.; Belyakova N.V.; Pantina R.A.; Filatov M.V. Development
282
of barcode and proteome profiling of glioblastoma. Biochem Suppl Ser B Biomed Chem. 2014, 8, 243–251.
283
16. Shtam T.A.; Naryzhny S.N.; Landa S.B.; Burdakov V.S.; Artamonova T.O.; Filatov M.V. Purification and in
284
vitro analysis of exosomes secreted by malignantly transformed human cells. Cell tissue biol. 2012, 6,
317-285
325.
286
17. Naryzhny S.N. Blue Dry Western: Simple, economic, informative, and fast way of immunodetection. Anal
287
Biochem. 2009, 392, 90–5.
288
18. Bradford M.M. A rapid and sensitive method for the quantitation of microgram quantities utilizing the
289
principle of protein-dye binding. Anal Biochem. 1976, 72, 248–54.
19. Gorg A.; Postel W.; Domscheit A.; Gunther S. Two-dimensional electrophoresis with immobilized pH
291
gradients of leaf proteins from barley (Hordeum vulgare): method, reproducibility and genetic aspects.
292
Electrophoresis. 1988, 9, 681–92.
293
20. Naryzhny S.N.; Zgoda V.G.; Maynskova M.A.; Novikova S.E.; Ronzhina N.L.; Vakhrushev I. V.; Archakov
294
A.I. Combination of virtual and experimental 2DE together with ESI LC-MS/MS gives a clearer view about
295
proteomes of human cells and plasma. Electrophoresis. 2016, 37, 302–9.
296
21. Naryzhny S.; Zgoda V.; Kopylov A.; Petrenko E.; Archakov А. A semi-virtual two dimensional gel
297
electrophoresis: IF–ESI LC-MS/MS. MethodsX. 2017, 4, 260–4.
298
22. Naryzhny S.N.; Lee H. Characterization of proliferating cell nuclear antigen (PCNA) isoforms in normal
299
and cancer cells: There is no cancer-associated form of PCNA. FEBS Lett. 2007, 581, 4917-20.
300
23. Naryzhny S.N.; Maynskova M.A.; Zgoda V.G.; Ronzhina N.L.; Kleyst O.A.; Vakhrushev I.V.; Archakov A.I.
301
Virtual-Experimental 2DE Approach in Chromosome-Centric Human Proteome Project. J Proteome Res.
302
2016, 15, 525-30.
303
24. Zgoda V.G.; Moshkovskii S.A.; Ponomarenko E.A.; Andreewski T.V.; Kopylov A.T.; Tikhonova O.V.;
304
Melnik S.; Lisitsa A.V; Archakov A.I. Proteomics of mouse liver microsomes: Performance of different
305
protein separation workflows for LC-MS/MS. Proteomics. 2009, 9, 4102-5.
306
25. Vaudel M.; Barsnes H.; Berven F.S.; Sickmann A.; Martens L. SearchGUI: An open-source graphical user
307
interface for simultaneous OMSSA and X!Tandem searches. Proteomics. 2011, 11, 996–9.
308
26. Ishihama Y.; Oda Y.; Tabata T.; Sato T.; Nagasu T.; Rappsilber J.; Mann M. Exponentially Modified Protein
309
Abundance Index (emPAI) for Estimation of Absolute Protein Amount in Proteomics by the Number of
310
Sequenced Peptides per Protein. Mol Cell Proteomics. 2005, 4, 1265–72.
311
27. Appel R.D.; Bairoch A.; Sanchez J.C.; Vargas J.R.; Golaz O.; Pasquali C.; Hochstrasser D.F. Federated
two-312
dimensional electrophoresis database: A simple means of publishing two-dimensional electrophoresis
313
data. Electrophoresis. 1996, 17, 540–6.
314
28. Naryzhny S. Towards the Full Realization of 2DE Power. Proteomes. 2016, 4, 33.
315
29. Naryzhny S.N.; Maynskova M.A.; Zgoda V.G.; Ronzhina N.L.; Novikova S.E.; Belyakova N.V.; Kleyst O.A.;
316
Legina O.K.; Pantina R.A.; Filatov M.V. Proteomic Profiling of High-grade Glioblastoma Using Virtual
317
experimental 2DE. J Proteomics Bioinform. 2016, 9, 158-165.