a
Corresponding author: [email protected]
Signals features extraction in liquid-gas flow measurements using
gamma densitometry. Part 1: time domain
Robert Hanus1,a, Marcin Zych 2, Leszek Petryka2, Marek Jaszczur2 and Paweł Hanus3
1
Rzeszow University of Technology, 35-959 Rzeszow, Poland
2
AGH University of Science and Technology, 30-059 Krakow, Poland
3Test & Measurement Solutions sp. z o.o., 53-025 Wrocław, Poland
Abstract. The paper presents an application of the gamma-absorption method to study a gas-liquid two-phase flow in a horizontal pipeline. In the tests on laboratory installation two 241Am radioactive sources and scintillation probes with NaI(Tl) crystals have been used. The experimental set-up allows recording of stochastic signals, which describe instantaneous content of the stream in the particular cross-section of the flow mixture. The analyses of these signals by statistical methods allow to determine the mean velocity of the gas phase. Meanwhile, the selected features of signals provided by the absorption set, can be applied to recognition of the structure of the flow. In this work such three structures of air-water flow as: plug, bubble, and transitional plug – bubble one were considered. The recorded raw signals were analyzed in time domain and several features were extracted. It was found that following features of signals as the mean, standard deviation, root mean square (RMS), variance and 4th moment are most useful to recognize the structure of the flow.
1 Introduction
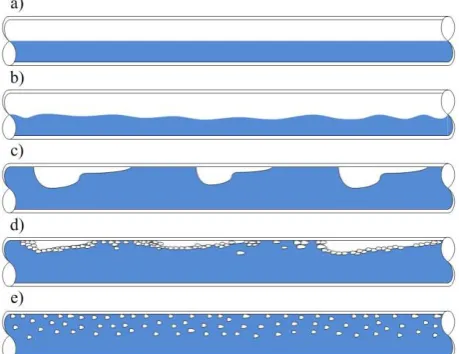
Two-phase flow i.e. flow including gas and liquid phase commonly occurs in industry, especially in nuclear, chemical and petrochemical engineering. To fully describe such flow, it is required to determine variation of the velocity or flow rate for each fluid phase, as well as their mixing and distribution between the transported streams. Depending on the liquid phase velocity, viscosity and existence of turbulence, the same volume of gas may be transported in different ways, evolving from bubble up to annular flow. Selected structures in the case of liquid-gas flow in horizontal pipeline are presented in figure 1 [1].
Currently, such flows may be examined by using several methods, such as computer tomography (resistive, capacitive, optical and X-rays), Coriolis flowmeters, optical equipment, PIV, LDA and nuclear techniques [2-12]. These latter are also used by the authors of this article in studies of two-phase flows [13-21].
The nuclear methods are based on application of radiotracers or on a usage of a sealed gamma ray sources for the flow analysis. The last gamma-absorption method is particularly convenient for continuous non-invasive observation of two-phase flows, providing velocity of gas phase as well as a selected information about flow structure. That goal is achieved by statistical analysis of stochastic signals delivered by scintillation probes mounted outside the analysed stream as detectors of the radiation.
Figure 1. The selected liquid-gas flow patterns in horizontal pipeline: a) stratified smooth, b) stratified wavy, c) plug, d) transitional plug – bubble, e) dispersed bubble.
Flow regimes identification inspires many studies of two-phase flows. A quantitative description of flow regimes can be obtained by the analysis of the signals registered in radioisotope measurements. According to [22-31] the time-series analysis can be made in time domain, frequency domain (spectral analysis) or state-space domain (chaos analysis).
In this work the signals obtained by using gamma-absorption set were analyzed in time domain. Several
C
features of signals, e.g., mean, standard deviation, kurtosis, skewness, root mean square (RMS), variance and 4th order moment were extracted. It was examined which features of signals are the most useful to recognize the flow structure.
2 Gamma-absorption in two-phase flow
evaluation
The gamma absorption is based on exponential decreasing of a monoenergetic gamma beam in function of composition and geometry of absorbent [9]. The changes of the intensity of radiation are recorded by the scintillation detectors and converted into output electrical impulses [7].
The typical gamma-absorption measuring set is presented in figure 2.
Figure 2. The gamma-absorption measuring set: 1 – collimators shaping gamma beam emitted by gamma ray sources, 2– scintillation probes, 3 – detectors’ collimators, 4 – pipeline, 5– the main beam of gamma rays, υa– velocity of gas phase,
υW– velocity of water.
Two sealed radioactive sources emit gamma radiation beams shaped by collimators (1). Photons pass through the pipeline with analyzed two-phase flow (air-water mixture) (4) and detector’s collimator (3) before achieved scintillation probes (2). In the presented experiment two sets consisting of linear 241Am sources with an activity of 100 mCi and probes with NaI(Tl) scintillation detectors are placed at a distance of L = 97 mm between them. At the outputs of two scintillation probes, count signals Ix(t) and Iy(t) are recorded for the first and second probe respectively.
3 Experimental set-up
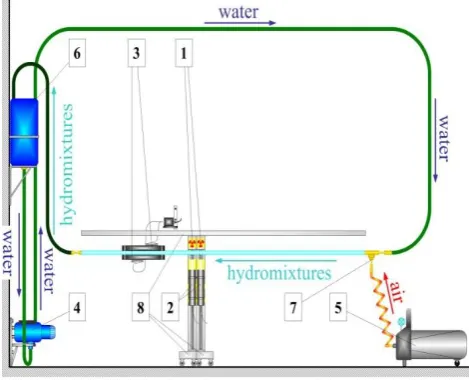
The experimental set-up together with measuring equipment described above, was applied in the Industrial Radiometry Laboratory of the AGH University of Science and Technology in Krakow, Poland. Scheme of experimental set-up has been presented in figure 3.
Figure 3.Scheme of experimental set-up:1 - gamma-ray sealed source, 2 – scintillation probe, 3 – ultrasound flow meter, 4 – pump, 5 – compressor, 6 – air-removing container, 7 – air nozzle, 8 – shifting system of gamma-absorption set.
The test section consists of a transparent acrylic glass pipe with internal diameter of 30 mm and a length of 4.5 m. Water is pumped by a rotary pump (4) and air is provided by the compressor (5) by an injector nozzle (7). Due to this, the controlled mixture of water and air, fills the measuring pipe, and flows up to the air removing tank (6). The measuring system consisting of two -radioactive sources (1), two scintillation probes (2) and the system of data acquisition and analysis. The measuring set is mounted on a special trolley (8), which allows to move the set along the pipeline. The water flow rate being continuously measured by Uniflow 990 ultrasonic flowmeter (3). The rotary pump (4) controlled by an inverter enables selection of water velocity in the measuring pipe between 0.5 - 2.5 m / s. The transparent measuring section of the pipeline allows a photographic documentation of the observed two-phase flows [13].
The data acquisition equipment is comprised of PC with the dedicated counters card connected to a USB port. The pulses Ix(t) and Iy(t) obtained from the detectors counted within the sampling time Δt= 1 ms create stochastic signals x(t) and y(t). The analysis of these signals allows to determine the mean velocity of gas phase υa, its concentration and void fraction [18-21].
4 Examples of recorded signals
and BUB1 with a sampling rate of 1000 Hz. Obtained from the first probe data records length on 300,000 samples have been written to files:
BUB601 - plug flow: υW = 0.90 m / s, υa = 0.710 m / s,
BUB401 - transitional plug – bubble flow: υW = 1.36 m / s, υa = 1.066 m / s,
BUB101 - bubble flow: υW = 1.92 m / s, υa = 1.446 m / s,
where υW– velocity of water measured by ultrasonic flowmeter Uniflow 990. Velocity of gas phase υa was determined using cross-correlation method [32-34]. Photos of particular types of structures performed in a laboratory and time records of the signals obtained in experiments BUB6, BUB4, and BUB1 are presented in figure 4.
5 Signals features extraction
The data records registered in the experiments BUB6, BUB4, and BUB1were divided into segments containing 10,000 samples. Developed in LabVIEW software allows to use moving average to smooth out short-term fluctuations, and overlapping (0–90%) of the segments [35]. Based on the analysis of these segments the following parameters (“features”) were calculated for the three types of the flow regimes (“classes”): “plug flow”, “transitional plug – bubble flow”, and “bubble flow”:
mean value:
N i i x N 1 1 (1) variance: N i i x N m 1 2 2 2 1 1 (2)standard deviation (STD) σ, 4th order moment:
N i i x N m 1 4 4 1 (3)
root mean square (RMS):
2 2 RMS (4) skewness: 2 2 3 1 m m m g (5) where
N i i x N m 1 3 3 1 1 (6) kurtosis: 3 2 2 4 2 m m g (7) a) b) c)Figure 4. Pictures of the flow structures, and time records of signals x(t) obtained in experiments (a) BUB6, (b) BUB 4 and (c) BUB1.
The data presented in figure 5 show values of the
statistical parameters as a function of a segment number.
BUB601 - plug flow
BUB401 - transitional plug – bubble flow BUB101 - bubble flow
Figure 5. Statistical parameters (“features”) of BUB601, BUB401, BUB101 data records, obtained for segments length of 10,000 samples.
6 Conclusions
In the paper an application of the gamma-absorption method to recognition of the gas-liquid flow regime in a horizontal pipeline has been presented. In the tests on laboratory installation the gamma-absorption set based on 241
Am radioactive sources and NaI(Tl) scintillation probes has been used.
Three structures (“classes”) of air-water as plug, bubble, and transitional plug – bubble one have been considered. For these types of flow the signals from probes were recorded and analyzed. The selected parameters (“features”) of signals in time domain were extracted to flow pattern recognition.
The best suitability for the recognition of flow structures are parameters for which the differences between classes are the greatest. On the basis of experiments it was found that the best indicator considered patterns have mean, RMS, standard deviation, variance and 4th order moment.
Further works will involve the application of the most useful features to flow recognition using machine learning methods.
References
1. M. Dziubiński, J. Prywer, Mechanics of two-phase
fluids (WNT, Warsaw 2009) (in Polish)
2. G. Falcone, G.F. Hewitt, C. Alimonti, Multiphase flow metering: principles and applications
(Elsevier, Amsterdam 2009)
3. M. Bottin, et al, Int. J. Multiphas. Flow 60,161-179 (2014)
4. T. Xue, et al, Flow Meas. Instrum.27, 29–36 (2012) 5. M.R. Rzasa, Nucl. Eng. Des. 239,699-707 (2009) 6. G.A. Johansen, P. Jackson, Radioisotope gauges for
industrial process measurements (John Wiley, New
York 2004)
7. Z. Yu, B. Qincheng, H. Richa, Appl. Therm. Eng. 60, 398-410 (2013)
8. S.L. Soo (ed.), Instrumentation for fluid-particle flow (Noyes Publications, New Jersey, 1999)
9. W.A.S. Kumara, B.M. Halvorsen, M.C. Melaaen, Int. J. Multiphas. Flow 36,467-480 (2010)
10. V. Mosorov, Meas. Sci. Technol. 17, 753-760 (2006)
11. S.H. Jung, et al, Appl. Rad. Isotop. 67, 1254-1258 (2009)
12. P. Vlasak, et al, J. Hydrol. Hydrom. 62, 241-247 (2014)
13. R. Hanus, Int. J. Multiphas. Flow 72, 210–217 (2015)
14. M. Zych, et al, Flow Meas. Instrum. 35, 11–15 (2014)
15. L. Petryka, et al, EPJ WoC 92, 02065 (2015) 16. R. Hanus, M. Zych, L. Petryka, Flow Meas.
Instrum. 40,58–63 (2014)
17. M. Zych, R. Hanus, L. Petryka, MATEC WoC 18,
02004 (2014)
18. R. Hanus, M. Zych, L. Petryka, JPCS 530, 012042 (2014)
19. M. Zych, et al.,EPJ WoC 92,02122 (2015)
20. R. Hanus, et al., Math. Probl. Eng. 2014, 475735 (2014)
21. R. Hanus, et al, EPJ WoC 92, 02020 (2015) 22. S. Blaney, H. Yeung, Flow Meas. Instrum.19, 57–
66 (2008)
23. O. Arjmandi-Tash, A. Zarghami, R. Zarghami, Particul. Sci. Technol. 32,498–505 (2014)
24. Y. Chen, et al, Chem. Eng. Sci. 129, 156–167 (2015)
25. F. Johnsson, Int. J. Multiphas. Flow 26, 663–715 (2000)
26. C.M. Salgado, Prog. Nucl. Energy 52, 555–562 (2010)
27. Z. Sun, H. Zhang, Meas. Sci. Technol. 19,015401 (2008)
28. G.H. Roshani, Measurement 62,25–32 (2015) 29. C.M. Salgado, Appl. Radiat. Isot. 67, 1812–1818
(2009)
30. E. Pawlowski, 20th International Conference on Methods and Models in Automation and Robotics
(MMAR), 909-914 (2015)
31. M. Khorsandi, et al, Radiat. Meas. 59, 183–187 (2013)
32. J.S. Bendat, A.G. Piersol, Random data - analysis
and measurement procedures (John Wiley, New
York, 2010)
33. M.S. Beck, A. Plaskowski, Cross correlation
flowmeters - their design and application (Adam
Hilger, Bristol, 1987)
34. W.Q. Yang, M.S. Beck, Flow Meas. Instrum. 8, 77-84 (1998)